Utah State University Utah State University
DigitalCommons@USU
DigitalCommons@USU
All Graduate Theses and Dissertations Graduate Studies
5-2014
Improving the Physical Processes and Model Integration
Improving the Physical Processes and Model Integration
Functionality of an Energy Balance Model for Snow and Glacier
Functionality of an Energy Balance Model for Snow and Glacier
Melt
Melt
Avirup Sen Gupta Utah State University
Follow this and additional works at: https://digitalcommons.usu.edu/etd
Part of the Civil and Environmental Engineering Commons
Recommended Citation Recommended Citation
Sen Gupta, Avirup, "Improving the Physical Processes and Model Integration Functionality of an Energy Balance Model for Snow and Glacier Melt" (2014). All Graduate Theses and Dissertations. 3875.
https://digitalcommons.usu.edu/etd/3875
This Thesis is brought to you for free and open access by the Graduate Studies at DigitalCommons@USU. It has been accepted for inclusion in All Graduate Theses and Dissertations by an authorized administrator of DigitalCommons@USU. For more information, please contact [email protected].
IMPROVING THE PHYSICAL PROCESSES AND MODEL INTEGRATION FUNCTIONALITY OF AN ENERGY BALANCE MODEL FOR SNOW AND
GLACIER MELT by
Avirup Sen Gupta
A dissertation submitted in partial fulfillment of the requirements for the degree
of
DOCTOR OF PHILOSOPHY in
Civil and Environmental Engineering
Approved:
David G. Tarboton Christopher M. U. Neale Major Professor Committee Member
Jeffery S. Horsburgh David E. Rosenberg Committee Member Committee Member
Jiming Jin Mark R. McLellan
Committee Member Vice President for the Research and
Dean of the School of Graduate Studies
UTAH STATE UNIVERSITY Logan, Utah
Copyright © Avirup Sen Gupta 2014 All Rights Reserved
ABSTRACT
Improving the Physical Processes and Model Integration Functionality of an Energy Balance Model for Snow and Glacier Melt
by
Avirup Sen Gupta, Doctor of Philosophy Utah State University, 2014
Major Professor: David G. Tarboton
Department: Civil and Environmental Engineering
Quantification of the hydrologic water sources (snow, ice and rain) to river discharge in the Hindu-Kush Himalayan (HKH) region is important for decision-making in water sensitive sectors, such as flood protection. In this region, access to and
monitoring of snow and glaciers and their melt outflow is challenging; thus modeling based on reanalysis and remote sensing data offers the potential for providing information to improve water resources decision making and management. Here I advanced the streamflow prediction capability in Himalayan watersheds by (1) developing a grid-based input/output framework for a point-based snow model to support its operational
application in an integrated modeling system, (2) developing tools for spatial
downscaling globally available reanalysis weather data to drive an energy balance model in the areas where meteorological observations are scarce and (3) extending an energy balance snowmelt model to include processes for quantifying melt from glaciers. In combination these provide the capability to model surface water supply and examine
changes in the contribution of glaciers to Himalayan water resources. This work uses the Utah Energy Balance (UEB) Snowmelt Model that simulates water inputs to runoff by modeling surface energy balance processes driven by weather inputs. The grid-based input-output framework extends UEB to run on a distributed mesh of grid cells with output aggregated over subwatersheds to facilitate integration into the EPA BASINS modeling system where it can be coupled with models such as the Geospatial Streamflow Forecast Model (GeoSFM) used to simulate streamflow in the Himalayan region. To overcome data scarcity in the HKH region, I developed an R-based procedure to
downscale the NASA Modern-Era Retrospective Analysis for Research and Applications (MERRA) weather products and the NOAA Southern Asia Daily Rainfall estimate
(RFE2) to obtain UEB inputs. The downscaling methods provide spatially and temporally continuous weather and incoming shortwave and longwave radiation data which are needed to drive energy and mass balance models such as UEB in hydrology. The ability to run models driven by these inputs supported examining questions related to the contribution of glaciers to water resources, thereby improving our understanding of hydrology in this area. This study also enhanced UEB by adding capability to quantify glacier melt. Direct physically based validation of this system is challenging due to the data scarcity in this region, but, to the extent possible, the model was validated through comparison to observed streamflow and to point measurements at the locations in the United Sates having available data.
PUBLIC ABSTRACT
Improving the Physical Processes and Model Integration Functionality of an Energy Balance Model for Snow and Glacier Melt
by
Avirup Sen Gupta, Doctor of Philosophy Utah State University, 2014
Major Professor: David G. Tarboton
Department: Civil and Environmental Engineering
The Hindu-Kush Himalayan region possesses a large resource of snow and ice, which acts as a freshwater reservoir for irrigation, domestic water consumption or hydroelectric power for billions of people in South Asia. Monitoring hydrologic resources in this region is challenging because of the difficulty of installing and maintaining a climate and hydrologic monitoring network, limited transportation and communication infrastructure and difficult access to glaciers. As a result of the high, rugged topographic relief, ground observations in the region are extremely sparse. Reanalysis data offer the potential to compensate for the data scarcity, which is a barrier in hydrological modeling and analysis for improving water resources management. Reanalysis weather data products integrate observations with atmospheric model physics to produce a spatially and temporally complete weather record in the post-satellite era. This dissertation creates an integrated hydrologic modeling system that tests whether streamflow prediction can be improved by taking advantage of the National Aeronautics
and Space Administration (NASA) remote sensing and reanalysis weather data products in physically based energy balance snow melt and hydrologic models. This study also enhances the energy balance snowmelt model by adding capability to quantify glacier melt. The novelty of this integrated modeling tool resides in allowing the user to isolate various components of surface water inputs (rainfall, snow and glacier ice melt) in a cost-free, open source graphical-user interface-based system that can be used for government and institutional decision-making. Direct, physically based validation of this system is challenging due to the data scarcity in this region, but, to the extent possible, the model was validated through comparison to observed streamflow and to point measurements at locations in the United States having available data.
DEDICATION
ACKNOWLEDGMENTS
I dedicate this dissertation to my parents, Shafali Sen Gupta and Asit Sen Gupta, for their spiritual endless support. I am grateful to my sister, my wife and my family in Bangladesh for their unconditional love and support in every possible way throughout the process of this course, this dissertation and beyond. None of this would have been
possible without their love and care.
My deepest gratitude is to my advisor, Dr. David G. Tarboton, for his generous availability despite his busy schedule to provide valuable suggestions and
encouragements during the work. I thank him for setting up high academic standards for his students and guiding them to meet those standards. I have been amazingly fortunate to have an advisor like him; without his support this dissertation could not have been completed. I deeply appreciate his persistence in pushing me to improve my research and writing skills so as to produce the best work possible.
I want to thank my committee members, Dr. Christopher Neale, Dr. David Rosenberg, Dr. Jeffery Horsburgh and Dr. Jiming Jin, for their service in my committee and their critical reflections of my work. My special thanks to Ms. Carri Richards at Utah Water research Laboratory for providing language and writing help. Further thanks go to
system administrator KimSchreuders who assisted me to improve my programming
knowledge skills in the earlier part of my PhD program.
I thank my fellow graduate students in the hydrology lab (USU Engineering Lab -33) including Vinod, Ibrahim, Sulochan, John, Tseganeh, Nazmus, Ali and Tian for their friendship and their ability to alleviate the stresses of graduate school. A big part of the
graduate school experience has been interacting with fellow graduate students. I greatly value their friendship and I deeply appreciate their belief in me.
I am also thankful to Dr. Molly Brown, Dr. Shahid Habib from NASA and Dr. Mandira Shrestha from the International Centre for Integrated Mountain Development (ICIMOD) for providing me valuable data, suggestions and financial support. I would also like to thank Hindu Kush Himalayan (HKH) Cryosphere Monitoring Project implemented by ICIMOD and ICIMOD’s glacier hydrologist Dr. Joseph Michael Shea for providing monthly temperature lapse rate data for Langtang Khola watershed.
This research was supported by the NASA Grant NNX11AK03G: Extending Utah Energy Balance Snowmelt Model to Glacial Melt Calculations in HIMALA
CONTENTS Page ABSTRACT ... iii PUBLIC ABSTRACT ...v DEDICATION ... vii ACKNOWLEDGMENTS ... viii
LIST OF TABLES ... xiii
LIST OF FIGURES ... xiv
CHAPTER 1. INTRODUCTION ...1 1.1. Problem Statement ...1 1.2. Objective ...4 1.3. Literature Review ...5 1.4. Summary ...14 References ...16
2. INTEGRATION OF AN ENERGY BALANCE SNOWMELT MODEL INTO AN OPEN SOURCE MODELING FRAMEWORK ...21
Abstract ...21
2.1. Introduction ...21
2.2. Background ...26
2.2.1. Utah Energy Balance Snowmelt Program ...26
2.2.2. Geospatial Streamflow Model ...28
2.2.3. BASINS ...30
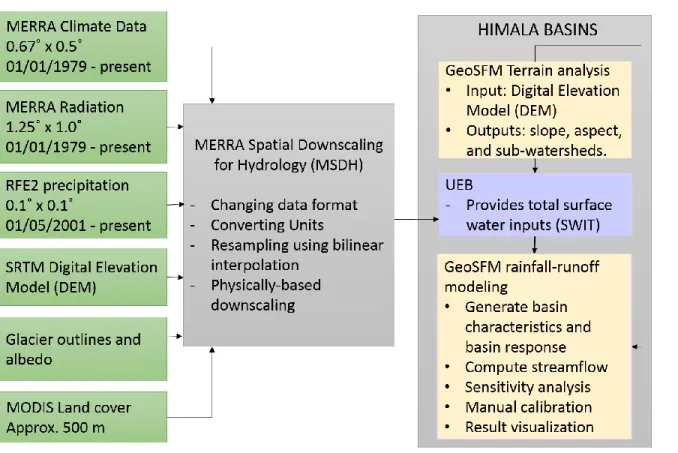
2.3. Integrated HIMALA BASINS System ...31
2.3.1. UEB and GeoSFM Plugings to EPA BASINS ...31
2.3.2. UEB Snowmelt Program Data Model ...33
2.4. Langtang Khola Watershed Case Study ...37
2.4.1. Data Sources ...38
2.4.3. Case Study Results ...42
2.5. Discussion ...44
2.6. Conclusion ...47
References ...48
3. MSDH V1.0: A MERRA SURFACE CLIMATE AND RADIATION DATA SPATIAL DOWNSCALING TOOL FOR HYDROLOGICAL APPLICATION ...62
Abstract ...62
3.1. Introduction ...63
3.2. Background ...69
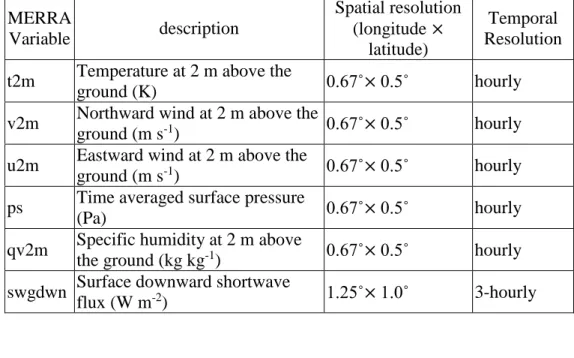
3.3. Data and Methods ...73
3.3.1. Data Sources for Downscaling ...73
3.3.2. Downscaling Methodology ...74
3.3.3. Utah Energy Balance Snow and Glacier Melt Model ...81
3.4. Software Implementation ...82
3.4.1. Implementing Downscaling Algorithms in R ...82
3.4.2. Output Data Storage in NetCDF ...84
3.4.3. MSDH Graphical User Interface ...86
3.5. Example Application ...87
3.6. Discussion ...92
3.7. Conclusion ...93
References ...96
4. ESTIMATING SNOW AND GLACIER MELT IN A HIMALAYAN WATERSHED USING AN ENERGY BALANCE SNOW AND GLACIER MELT MODEL ...112
Abstract ...112
4.1. Introduction ...113
4.2. Study Area ...117
4.3. Input Data ...117
4.4. Model Description ...119
4.4.1. Distributed Utah Energy Balance Snow and Glacier Melt Model (UEBGrid) ...119
4.4.2. Geospatial Stream Flow Model (GeoSFM) ...123
4.4.3. Model Setup ...123
4.5.1. Hydrologic Variability at Three Point Locations on Bare
Ground, Clean Glacier and Debris-covered Glacier ...126
4.5.2. Total Surface Water Input, Observed and Simulated Streamflow ...129
4.6. Discussion ...134
4.7. Conclusion ...136
References ...137
5. SUMMARY, CONCLUSION, AND RECOMMENDATIONS...154
5.1. Summary and Conclusion ...154
5.2. Recommendations ...162 References ...165 APPENDICES ...167 Appendix A ...168 Appendix B ...173 Appendix C ...177 Appendix D ...179 Appendix E ...188 CURRICULUM VITAE ...193
LIST OF TABLES
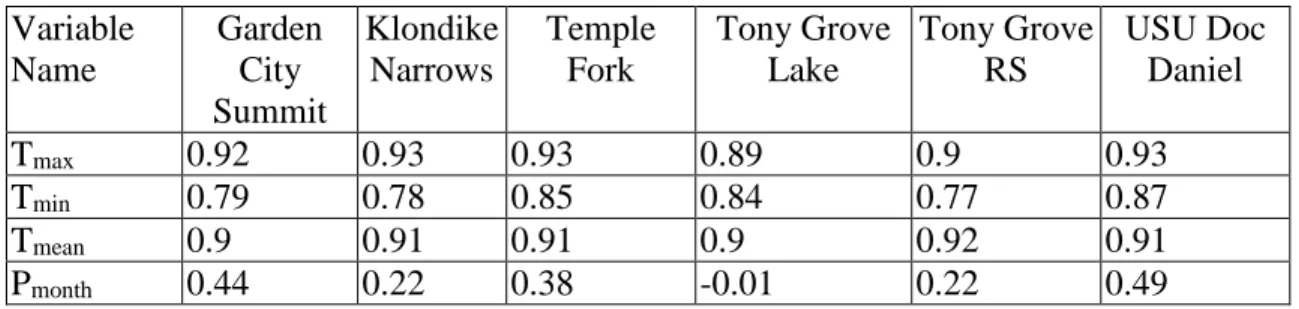
Table Page 3.1. Input MERRA variables used for downscaling ... 102 3.2. NRCS SNOTEL stations in Logan River Watershed ... 102 3.3. Nash-Sutcliffe Efficiency (NSE) of downscaled daily temperature,
incoming shortwave, relative humidity, wind speed and precipitation data
at USU Doc Daniel weather station. ... 102 3.4. Nash-Sutcliffe Efficiency (NSE) of daily maximum, minimum and mean
temperature and total monthly precipitation at six NRCS SNOTEL stations in
the Logan River watershed ... 103
3.5. Nash-Sutcliffe Efficiency (NSE) of UEB simulated Snow Water Equivalent (m)
compared to SNOTEL stations for water year 2010 ... 103 4.1. Physical characteristics of the Langtang Khola Watershed ... 142 4.2. Summary statistics of performance criteria between observed and simulated
streamflow ... 142 4.3. Mass balance components... 143
LIST OF FIGURES
Figure Page
2.1. Plug-in architecture of HIMALA BASINS ... 54
2.2. HIMALA BASINS Graphical User Interface ... 55
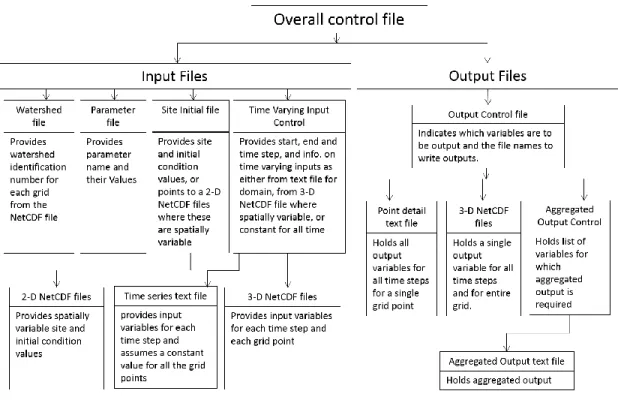
2.3. Organization of input and output files in the UEB program ... 56
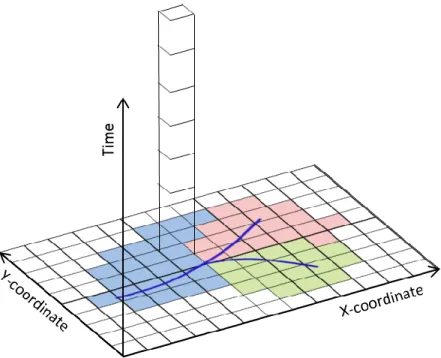
2.4. Representing space and time in a netCDF file ... 57
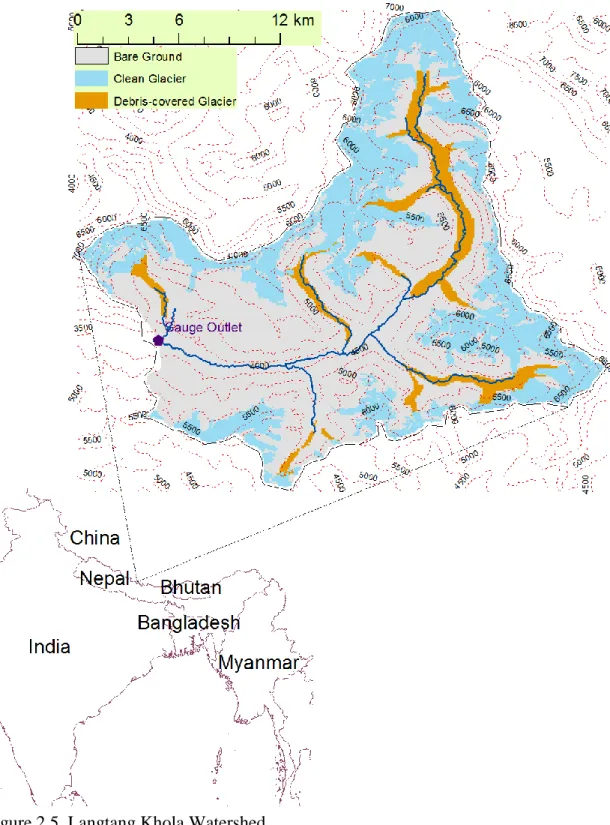
2.5. Langtang Khola watershed. ... 58
2.6. Data workflow of input preprocessing and coupled UEB and GeoSFM modeling system in EPA BASINS for Langtang Khola case study. ... 59
2.7. Downscaling of MERRA temperature (˚C) for Langtang Khola watershed at 3:00 am on January 1, 2003. (a) South Asian region temperature; (b) MERRA grid cells spanning Langtang Khola watershed (c) Downscaled temperature projected to Lambert Azimuthal Equal Area DEM grid. ... 60
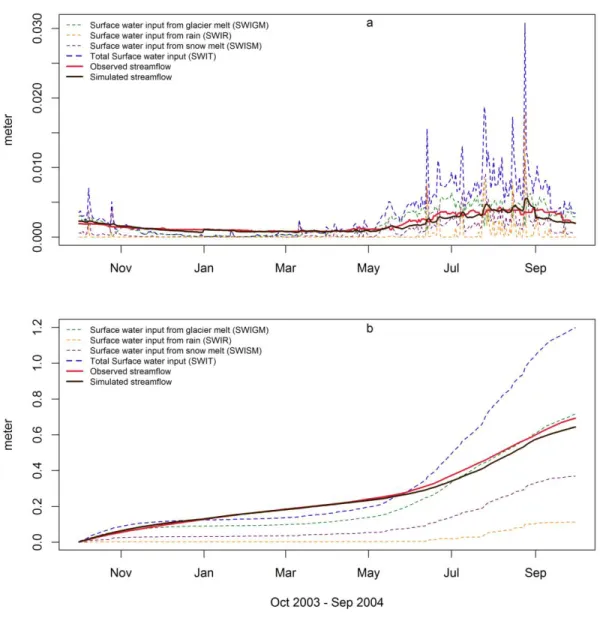
2.8. (a) Daily and (b) cumulative time series of UEB simulated surface water input components, streamflow measured at the Kyangin station and streamflow simulated by GeoSFM ... 61
3.1. Graphical User Interface for MERRA Spatial Downscaling for Hydrology (MSDH) ... 104
3.2. Logan River watershed. Blue lines indicate the stream network within the watershed and red dots symbolized the SNOTEL climate stations. Station numbers correspond with the numbers shown in table 3.2. ... 105
3.3. Relationship between elevation (x-axis) and (a) mean monthly temperature (˚C) (y-axis) and (b) mean monthly precipitation (m) (y-axis) at six SNOTEL stations in December for evaluating vertical temperature lapse rate (Γ) and precipitation adjustment factor (κp), respectively ... 106
3.4. Downscaling of MERRA temperature (o C) for the Logan River watershed 18:00 UTC on Dec 24, 2011 (a) temperature reported in MERRA for Contiguous United States of America (USA); (b) MERRA grid cells spanning Logan River watershed and surrounding areas and (c) downscaled temperature projected to Universal Transverse Mercator (UTM) projection at DEM grid resolution... 107
3.5. Comparison of downscaled daily mean observed temperature, shortwave radiation, wind speed, relative humidity, and precipitation, with respect to measured data at the USU Doc Daniel SNOTEL station. A time series plot (left) and scatter plot (right) of observed and downscaled data are shown
for each variable ... 108 3.6. Comparison of the downscaled data (y-axis) for daily maximum,
minimum and mean temperature and monthly precipitation with observed data (x-axis) at six SNOTEL stations for water year 2010 (Oct 01 2009 - Sep 30 2010). SNOTEL station ID numbers are indicated at the top of
each column ... 109 3.7. Comparison between observed SWE and Utah Energy Balance (UEB)
simulated SWE for water year 2010 (Oct 01 2009 - Sep 30 2010) at the six
SNOTEL stations ... 110 3.8. Comparison between the observed and UEB simulated snow water
equivalent (SWE) (a) using observed temperature, precipitation, wind speed, relative humidity and shortwave radiation, (b) using downscaled temperature with observed data of other variables, (c) using downscaled precipitation with observed data of other variables, (d) using downscaled wind speed with observed data of other variables, (e) using downscaled relative humidity with observed data of other variables, (f) using
downscaled shortwave radiation with observed data of other variables ... 111 4.1. Location of Nepal and Langtang Khola watershed in South Asia. Bare
ground, clean and debris covered glacier ice are shown in antique white, sky blue and dark orange colors, respectively. Three selected points in three substrates (A at bare ground, B at clean glacier and C at debris covered glacier) are shown by green points. Hatched area is the
subwatershed depicted in Figure 4.3 ... 144 4.2. Glacier representation in UEBGrid ... 145 4.3. (a) Substrate type and (b) substrate albedo. In Figure 4.1, this
subwatershed of Langtang Khola is shown as the hatched area ... 146 4.4. Inputs (i.e. (a) temperature (˚C), (b) precipitation (m/hr) and (c) solar
radiation (KJ m-2 hr-1)) and outputs (i.e. (d) SWE (m), (e) Total Surface
water input (SWIT, m/hr) and (f) glacier melt (SWIGM, m/hr)) at three different points (A: bare ground, B: Clean glacier, C: Debris-covered glacier) aggregated (i.e., mean) at a daily scale for the year 10/1/2002-9/30/2003, the first year after the spin up period. Color legend shown in
(d) for bare ground (red), clean (blue) and debris covered glacier (green)
remains unchanged for other figures (i.e., a through f) ... 147 4.5. Comparison between melt estimated by UEBGrid and streamflow
measured at Kyangjin hydrologic station ... 148 4.6. Comparison between observed and GeoSFM simulated streamflow driven
by UEBGrid modeled surface water inputs. (a) Daily time series of observed and simulated streamflow, (b) scatter plot of daily observed and simulated streamflow, (c) monthly mean observed and simulated
streamflow... 149 4.7. Yearly contribution of glacier, snow, and rain in total surface water input
(SWIT) ... 150 4.8. Monthly variation of SWIR (black bar), SWISM (dark grey bar), SWIGM
(light grey bar), observed streamflow (black line), temperature (red line), and sublimation (dark golden line) averaged over the 10 years 2003-2012
(streamflow only available to 2010) ... 151 4.9. Rain, snowmelt and glacier melt from three different substrate types ... 152 4.10. Paired relationship between annual surface water input from glacier melt
(SWIGM, meter), total surface water input (SWIT, meter), precipitation (meter), observed streamflow, (Observed Q, meter), simulated streamflow, (Simulated Q, meter), sublimation (m) and temperature (˚C). The
numerical values given at the top of each plot represents the correlation coefficient between the two variables. Linear regression lines are shown
CHAPTER 1 INTRODUCTION
1.1. Problem Statement
High altitude watersheds in the Hindu-Kush Himalayan (HKH) region possess a large volume of snow and ice, which acts as a freshwater reservoir for irrigation,
domestic water consumption or hydroelectric power for 1.4 billion people in South Asia (Immerzeel et al., 2010). During the dry years with less precipitation, glaciers act as natural buffers, releasing meltwater and sustaining relatively stable flow in the streams. With population growth and projected climate-induced changes in snow and ice, the region is at risk of experiencing water stress in the long-term (Immerzeel et al., 2010; 2012; Kaser et al., 2010), but is also vulnerable to high flow during the melting season in the near future. In particular, there are concerns about the effect of climate change on glacier retreat, and variation in runoff contributions from snow and glacier melt.
As a data driven scientific tools, hydrological models require a vast amount of data for advancing the prediction capability of hydrological quantities such as
streamflow. However, monitoring hydrological resources including glaciers in the HKH region is challenging due to the difficulty in installing and maintaining weather and hydrologic stations, limited transportation infrastructure, difficulty in accessing glaciers and lack of financial support. As a result of the extreme rugged topography, ground observations in the region are extremely sparse and inadequate for hydrologic analysis (Lo et al., 2011). A limited number of weather stations are maintained by the Nepal Department of Hydrology and Meteorology (DHM) for collecting hydrological and meteorological variables such as discharge, temperature, and precipitation in Himalayan
headwaters in Nepal (Konz et al., 2007). These data are a unique resource to examine the physical processes of runoff generation (Konz et al., 2007) and make predictions of runoff from high altitude Himalayan watersheds; however, these measurements are often unable to represent the spatio-temporal variability of the complex terrain and suffer from prolonged periods of missing data. In recent years, the advancement in remote sensing data has greatly helped modelers to model snow and glacier melt in the Himalayas (Thayyen and Gergan, 2010) and has helped to improve water resources decision making and management in these data-scarce areas. Remote sensing data has been used for various hydrological and meteorological studies such as: estimating snowmelt runoff (Thapa, 1993), mapping and characterizing glaciers (Racoviteanu et al., 2008), and using MODIS snow cover for calibrating a distributed hydrological model (Konz et al., 2010). In this study, we used remote sensing data, along with weather reanalysis products and ground-based streamflow observations to model snow and glacier melt for a high altitude watershed in the HKH region.
While some progress has been made in understanding the contribution of snow and ice melt to streamflow, most studies in the HKH region use degree-day models or simple ablation models (Immerzeel et al., 2010; 2012; Racoviteanu et al., 2013). The ablation models analyze the distribution of area over the range elevation in a watershed. Ice area is typically calculated for 100 m altitudinal bands below the average elevation at which annual accumulation equals ablation, the equilibrium line altitude (ELA). These ablation models assume a separate yearly melt rate (mm/day) for clean and debris covered glacier for each elevation band over the watershed (Racoviteanu et al., 2013). Degree-day models, on the other hand, estimate runoff using mean daily or monthly air
temperature and precipitation (Braun et al., 1992; Immerzeel et al., 2010; 2012). Both of these work reasonably well given that they have limited data requirements; however, they do not account for topographic effects, surface albedo, solar radiation and turbulent heat exchanges in melt calculations (Hock, 2003). Recognizing these limitations, this study explored using the physically-based Utah Energy Balance (UEB) snowmelt model (Tarboton et al., 1995) to compute glacier melt. Compared to multi-layer energy balance snowmelt models, UEB is a relatively simple energy balance model that parameterizes the snowpack using lumped (depth averaged) state variables so as to avoid having to model the complex processes that occur within a snowpack. Physical differences between bulk (depth averaged) properties and the surface properties, which are important for calculating surface energy exchanges, are captured by modeling diurnally forced heat flow at the surface using the so-called force-restore parameterization where there is a forcing term related to the difference between surface and depth temperature and a restore term related to the temporal gradient of surface temperature (Deardorff, 1978; Luce and Tarboton, 2010). UEB was chosen for this purpose because the model is open source and provides a relatively simple, transferable, physically-based approach to the quantification of snowmelt.
UEB was initially designed to simulate snowmelt and track the energy and mass balance of snow to model snow accumulation and melt at a single point location such as a weather station (Tarboton and Luce, 1996; Mahat and Tarboton, 2012; 2013; Mahat et al., 2013). In this study, a spatially distributed version of the UEB snowmelt model was developed that applies the model separately at each point on a watershed grid. The physical processes represented by the model were extended to include glacier melt in
addition to snowmelt. The model represents glacier as a substrate layer and computes melt from glacier substrate when seasonal snow cover has melted. Glacier outlines and the albedo of clean glaciers and debris-covered glaciers are used as inputs to the model.
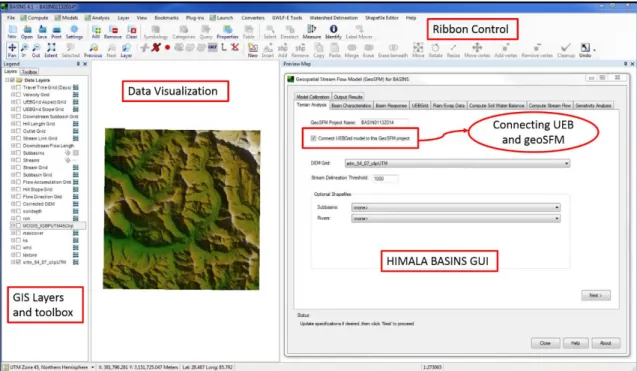
This work was part of a larger NASA sponsored project to apply NASA data products to advancing understanding the snow and glacier melt processes and their relative contribution in streamflow. Inclusion of glacier melt estimates in hydrological analysis in South Asian countries is hindered by a lack of inexpensive, easy-to-use operational hydrologic models and a lack of training. To address this shortcoming, UEB was configured for incorporation as a plug-in to the Environmental Protection Agency (EPA) Better Assessment Science Integrating point and Nonpoint Sources (BASINS) modeling system (EPA, 1998). BASINS is a free, open-source, graphical user interface-based streamflow modeling system that allows users to configure and run a broad set of hydrologic models. The specific version developed for this broader NASA project is referred to as HIMALA BASINS. The addition of UEB to HIMALA BASINS adds the capability incorporate snow and glacier melt information into streamflow simulations using the GeoSFM (Asante et al., 2008) rainfall-runoff model. UEB was integrated into the EPA BASINS simulation environment by AQUATERRA Consultants, the prime developer of EPA BASINS using a graphical user interface coupling approach (Brandmeyer and Karimi, 2000).
1.2. Objective
The primary objective of this work was to develop a hydrological tool that includes modeling of both snow and glacier-melt contributions to river flow in the HKH region. Our goal was to improve streamflow prediction by taking advantage of modern
remote sensing and high resolution weather data products to compensate for the scarcity of ground-based observation data. The UEB model has the capability to predict snowmelt at a point driven by weather data at that point. Our first objective was to convert the point-based UEB to a distributed model that allows it be run over a grid to better represent spatial variability. The second objective was to enable coupling of UEB with other models and enhance usability by integration into the EPA Basins modeling framework. The third objective was to add a glacier substrate layer to the model to compute glacier melt when the seasonal snow cover is melted. Representation of glacier substrate and spatially explicit representation of variability on a grid allowed the model to estimate runoff generation from snow and glaciers. To overcome limitations in data availability, my fourth objective was to develop tools to retrieve distributed weather inputs from Internet data repositories, and downscale them to the spatial footprint of the model. We addressed the following questions by applying the model at a high altitude glacierized Himalayan watershed:
(1) How well can glacier melt be quantified using adaptations of a simple energy balance model initially developed for snow?
(2) What is the relative contribution of glacier melt, snowmelt and rain to the total surface water input?
(3) Are there any changes in glacier mass balance during the model simulation period?
1.3. Literature Review
Review of snow and glacier melt studies in Nepal Himalayas has indicated that temperature index or degree-day methods are the most widely used because of their simplicity and less demanding data requirements. Braun et al. (1992) applied a
HBV-based hydrologic model (Sten and Arne, 1973) over Langtang Khola watershed. HBV is a conceptual rainfall-runoff model originally developed in Scandinavia (Bergstrom, 1976). Braun (1988) enhanced the original HBV model by introducing a temperature index model. Daily melt was estimated based on a seasonally variable melt rate (mm/day) and the difference between the daily air temperature and snow-rain transition
temperature. The model keeps track of snow accumulation. Where glacier is present, an ice melt factor is used to compute the glacier melt after the snow cover melts out. The ice melt factor is assumed to be higher than that of snow due to ice’s lower albedo. However, 7% of the total basin area is covered by debris-cover glacier ice. On debris-covered glacier, the debris layer works as an insulator in heat exchange between the atmosphere and glacier surface; therefore, a lower melt factor was assumed for debris-covered glacier. The model was driven by temperature and precipitation data and was validated using streamflow data at the gauged outlet. The simulated streamflow showed reasonable agreement with observed streamflow on a yearly scale; while streamflow was
overestimated during the post monsoon and underestimated during the pre-monsoon seasons. Following this study, degree-day models were used for quantifying ice melt beneath the debris-covered Kumbu glacier, Nepal (Kayastha et al., 2000), the Langtang Valley (Kayastha et al., 2005), four glaciers in Nepalese Himalayas and Qinghai-Tibetan Plateau (Matsuda, 2003), the Tamakoshi basin in Nepal (Shilpakar et al., 2009) and others. These studies have been used to examine ice melting and discharge and climate change impacts on snow and glacier melt.
Konz et al. (2007) used the distributed tracer aided catchment model (TACD)
HBV model with an enhanced process-based runoff computation module, to simulate streamflow from the Langtang Khola watershed. The model is coded using the PCRaster programing language. Recognizing the data scarcity, the authors used a simplified approach, requiring only temperature and precipitation data, illustrated by Braun et al.
(1992) instead of using sophisticated TACD. The authors presented a statistical approach
to fill the gaps in temperature and precipitation data. Konz et al. (2010) calibrated the
snow and glacier routine of the TACD model using snow cover data from the
Moderate-resolution Imaging Spectroradiometer (MODIS).
Immerzeel et al. (2010) used the Snowmelt Runoff Model (SRM), originally developed by Martinec (Martinec et al., 1994; Rango and Martinec, 1994; 1995) to model discharge over one hundred basins in South Asia. The original version of the SRM model simulates discharge based on snowmelt and rainfall using a deterministic degree day approach. The SRM model has been extended to include glacier melt as an additional source of water by assigning a separate melt rate for ice, if the glacier is present. The model is driven by daily temperature, precipitation and snow-covered area.
Immerzeel et al. (2012) also developed a combined cryospheric hydrologic model to investigate hydrologic response to climate change in the Langtang River watershed. This model includes the simulation of glacier movement by basal sliding. This is the first model, to my best knowledge, to model glacier flow in Nepal Himalayas. Temperature and precipitation are the main forcing variables and glacier melting is estimated using a degree-day approach. Temperature was spatially differentiated using a vertical lapse rate. While temperature is the primary reason to cause melt in the model, there is considerable variability in General Climate Model (GCM) temperature projections from 2000 to 2100.
Therefore, the uncertainty in temperature projections directly gets translated into glacier melt predictions and glacier mass balance.
Racoviteanu et al. (2013) used an ice ablation model to compute the glacier contribution to annual streamflow. The ice ablation model, initially developed by Alford (1992), uses (1) an estimate of the equilibrium line altitude (ELA) giving the average elevation over the basin where the accumulation is at an equilibrium with the ablation, (2) 100 m elevation bands to represent the elevation distribution of the basin, and (3)
separate melt factors for clean and debris covered glacier used to compute melt for every 100 meter altitude band under the ELA based on the digital elevation model and glacier map. The study quantifies the total glacier outflow by multiplying the glacierized area with the melt rate for each specific elevation band. For clean and debris covered glacier, two separate relationships between the elevation and ablation rate were used. The study estimated that 58.3% of the streamflow was generated from glacier melt for Langtang Khola watershed. A major limitation of this model is that it cannot predict the seasonality of the glacier melt and, therefore, cannot be used for decision making in water resources management (such as irrigation in rice or wheat crops) where monthly or seasonal information are required.
Kayastha et al. (1999) applied a mass balance model on a small glacier AX010, Shorong, Himal in Nepal. The model was driven by hourly temperature, precipitation, wind speed, relative humidity and cloud cover. The model estimated surface albedo, shortwave and longwave radiation internally and the screening effect of the surrounding mountains on radiation and multiple reflections were also taken into account. A
precipitation event. This study assumed a constant temperature lapse rate for calculating temperature at high altitudes and constant precipitation over the basin. The surface-elevation changes were validated at three points in the glacier from 25 May to 25 September, 1978. Modeled and observed surface elevation of the glacier were in good agreement except for some discrepancies in June when a thin snow layer covered the glacier due to light precipitation. The authors found that the model was highly sensitive to radiation and surface albedo, suggesting the importance of using energy balance models in glacier and snow melt calculation.
In assessing the models reviewed above it is apparent that there are three types of models used for glacier melt studies in Nepal Himalayas (1) degree day models, (2) ice ablation models and (3) energy and mass balance models. Most recent degree-day models are distributed and capable of explicitly representing the temperature and precipitation variability. Among all these models, Kayastha et al. (1999) used an energy balance model to simulate the change in glacier elevation and showed that the model was well capable of simulating the glacier melt by comparing with the observed elevation change in glacier thickness. However, this model was only run over a small glacier while water resource managers are more interested in streamflow simulation over an entire watershed. Even so, the success of this energy balance model is one factor motivating the use of UEB as a starting point for my work.
In distributed hydrologic modeling a number of data structures have been
developed for the discretization of the spatial domain into model elements that explicitly represent spatial variability. Here, a number of the relevant approaches are reviewed to
provide ideas and information for extending the single point UEB model into a distributed model.
Julien et al. (1995) developed a raster based hydrologic model (CASC2D) for surface runoff simulation. CASC2D has the capability to use raster-based GIS and radar data and graphically display maps of different variables such as rainfall and cumulative infiltration. The spatial area of the watershed is divided into equal size raster grid cells, and a mask map holding values 0 or 1 is used to identify whether a particular grid cell falls within the watershed. The model uses raster inputs of classified soil texture initial soil moisture, elevation, retention depth and surface roughness coefficient to compute overland flow. The raster capability in CASC2D was established by linking the program with the publicly available Geographical Resources Analysis Support System (GRASS) GIS software (Mitasova et al., 1995; Neteler and Mitasova, 2004)
Johnson and Miller (1997) developed another distributed hydrologic model with a goal to use remote sensing and a Digital Elevation Model (DEM) to reduce the
dependence on ground-based observations. The model uses a DEM to delineate the watershed, compute flow directions and build the stream network. Then precipitation is applied to each grid cell to compute accumulated precipitation, excess precipitation, infiltration and runoff at each time step. The model then routes the excess runoff through the stream network to compute a hydrograph at the outlet.
The PCRaster Environmental Modeling Language (Van Deursen and Wesseling, 1992; 1996; Wesselung et al., 1996) is a dynamic programming language for developing and running spatially distributed environmental models. Like other higher level
easy to understand and modify as its interface hides lower level details such as memory management (Van Der Knijff et al., 2010). There are two types of file formats that can be imported into and exported from PCRaster: (1) PCRaster Maps and (2) ASCII files. The language also contains a large number of built-in functions for mathematical analysis and raster processing. Initially developed at Utrecht University in the Netherlands, PCRaster is used for modeling in many disciplines such as hydrology, ecology, and glaciology. Example uses of PCRaster include the hydrologic and soil erosion model (LISEM) (De Roo et al., 1996), ground water modeling by linking with MODFLOW (Schmitz et al., 2009), and comparison between hydrologic processes between a mountainous and valley catchment (Zhang et al., 2009). Konz et al. (2007) and Immerzeel et al. (2012),
respectively, applied the TACD model (tracer aided distributed catchment model) and
combined cryospheric hydrologic model in the Langtang Khola watershed. Both of these models are coded entirely in PCRaster. Despite its many benefits, PCRaster comes with some limitations that restrict its applicability to host an operational model (Van Der Knijff et al., 2010). Input data stored in raster formats such as netCDF, GRIB and GeoTiff require additional software and substantial effort for converting to PCRaster format. Additional software is also required to visualize tabulated time series of model outputs. PCraster does not provide functionality to customize which variables should be output from a model run (Van Der Knijff et al., 2010). It also lacks the flexibility to switch on/off a particular module of the model without modifying the source code (Van Der Knijff et al., 2010).
The Arc Hydro Geographic Information System (GIS) data model (Maidment, 2002; Strassberg et al., 2007; 2011) was developed to provide a standard way to organize
digital elevation and hydrography information in support of hydrology oriented GIS analyses. Arc Hydro combines grid approaches with vector representations of catchments, streams and water bodies. Data is stored in Esri geodatabase format to facilitate analysis from within ArcGIS. Connectivity between the landscape and hydrography network in Arc Hydro starts at the scale of a grid cell. Terrain analysis methods are used to derive flow directions and flow accumulation, which, by
thresholding, produces streams that are represented as vector features and catchments that are represented as vector polygons connected to streams. There is a one-to-one
relationship between the area represented by a catchment and the stream segment to which it drains. Stream segments are also connected upstream and downstream, and this provides a connected discretization of the land surface that can serve as a template for hydrologic modeling with flow generated over catchments being routed down through the stream network.
Kumar et al. (2010) developed an object-oriented, shared data model to support distributed application of the Penn State Integrated hydrologic Model (PIHM). This shared data model developed for integrating PIHM and GIS defines various objects, their attributes and various operations that can be performed. The data model has the capability to represent the same object at different spatial and temporal scales. Clusters of
hydrological entities with similar attributes are defined by a class, which may be further enhanced through additional properties that may be added to some of the members of the class. Real world hydrological entities are the instances of a class. For example, a
be added as an additional data type to the “lake” instance. The data model incorporates a wide range of data types from static objects to dynamic 3-dimensional lines and fluxes.
Along with raster-based hydrologic models and modeling platforms, software tools have also been developed to facilitate linkage between hydrologic models with data in standard file formats. For example, the modular library for raster based hydrological application (MOSAICO) (Ravazzani, 2013b), is a set of libraries developed to support raster-based hydrologic simulations using netCDF as a standard file format. Ravazzani (2013a) showed an example where monthly precipitation is read from an ASCII file and area averaged precipitation is written in a netCDF file. Such applications can also be extended for more complicated modeling applications.
Given recent improvement in computational capability and Geographical Information System (GIS) and related tools, many distributed hydrologic models have emerged with various degrees of complexity. However, only a limited number of studies address the data management aspects of raster-based distributed hydrologic modeling. Many hydrologic models store raster-based input and output data in ASCII format, while others use binary data formats (Ravazzani, 2013a). Storage of numerical data values in ASCII is inefficient as reading and writing it requires translation between the ASCII representation and internal binary representation of numbers. However; binary formats make the data less accessible as they are not immediately human readable. Hydrologists have not agreed on a standard data format for storing and sharing data (Ravazzani, 2013a). The trend towards coupled or integrated environmental modeling for addressing broader environmental problems motivates the need for standard formats for efficiently storing, accessing and sharing data.
This literature review has indicated that due to data scarcity most Himalayan glacier melt efforts have been temperature index or ablation models that rely on empirical relationships developed between the snow and glacier melt and temperature or elevation. However the statistical basis for these models may weaken under climate change
conditions and it is difficult to explicitly represent topographic effects other than
elevation (i.e., slope and aspect) in these models. Distributed energy balance models are physically-based and are likely to have the potential to improve melt simulation
capability. However they have been used only rarely in the HKH region. In this study, we reconfigure a point-based snowmelt model (i.e., UEB) to a distributed model by computing the melt from the snow and glacier. This reconfiguration is done by developing a structured data model using netCDF and ASCII file formats. The data model also enables UEB model to be coupled with other hydrologic models such as GeoSFM. The data model developed in this study can be adopted, extended or modified for the development of raster-based distributed hydrological models. The UEB model was also extended to include computation of glacier melt by adding a static glacier substrate layer into the model. These two additional features in UEB make the integrated system applicable for streamflow simulation in glacierized watersheds where glaciers are significant sources of water.
1.4. Summary
This work was driven by the need for better prediction of streamflow by modeling snow and glacier melt in Himalayan watersheds. This dissertation contributes towards developing an integrated modeling system to compute the snow and glacier melt and accumulation and to assess their relative importance to streamflow in a high altitude
Himalayan watershed. Our work included: (1) a distributed UEB model capable of running on a grid over a watershed to produce snow and glacier ablation, (2) an R-based weather and radiation data downscaling tool for generating time-varying dynamic input data for UEB and (3) an extended version of the model that includes the representation of a glacier substrate layer to compute glacier melt using UEB’s existing formulation of surface energy balance fluxes. Each of these contributions is detailed in a chapter (paper) that follows.
The chapters that present this work are ordered to first present the distributed data model (Chapter 2), then the downscaling tools (Chapter 3) followed by the glacier layer extensions (Chapter 4). Development of the computer codes for the data model described in Chapter 2 and the glacier representation in Chapter 4 proceeded simultaneously, and each does depend on the other. However it seemed best to present the data model and integrated modeling system first with results for just one year at Langtang Khola watershed used to illustrate the integration functionality. Then in Chapter 3 the downscaling model is presented and Chapter 4 that presents the glacier representation serves as the capstone for this work. In Chapter 4 the UEB model was applied for ten years test to compute the glacier contribution and glacier mass balance over an extended period relying on downscaled input data using the model from Chapter 3. Streamflow simulated by GeoSFM with inputs from UEB over a longer time series was compared with 8 years of available observed streamflow. The reasonable comparisons obtained indicate that in aggregate discrepancies offset and the effects of biases are small and do not propagate as the time progresses.
References
Alford, D., 1992, Hydrological aspects of the Himalayan region, International Centre for Integrated Mountain Development, ICIMOD Occas. Pap., Kathmandu.
Asante, K. O., G. A. Artan, S. Pervez, C. Bandaragoda and J. P. Verdin, 2008, Technical manual for the Geospatial Stream Flow Model (GeoSFM), U. S. Geological Survey. Bergstrom, S., 1976, Development and application of a conceptual runoff model for
Scandinavian catchments., Dept. of Water Resources Engineering, Lund Inst, of Technology / University of Lund. Bull. Ser. A no. 52.
Brandmeyer, J. E. and H. A. Karimi, 2000. Coupling methodologies for environmental models, Environ. Modelling & Software 15(5), 479-488.
Braun, L., W. Grabs and B. Rana, 1992. Application of a Conceptual Precipitation-runoff Model in the Langtang Kfaola Basin, Nepal Himalaya, Proceedings of the
Kathmandu Symposium, p. 221-237.
Braun, L. N., 1988. Parameterization of snow-and glaciermelt, Geographisches Institut ETH, Zurich.
De Roo, A., C. G. Wesseling, V. G. Jetten and C. J. Ritsema, 1996. LISEM: a physically-based hydrological and soil erosion model incorporated in a GIS, IAHS
PUBLICATION 235, 395-403.
Deardorff, J. W., 1978. Efficient prediction of ground surface temperature and moisture, with inclusion of a layer of vegetation, J. Geophys. Res. 83(C4), 1889-1903.
EPA, B. V., 1998. 2.0 User's manual: better assessment science integrating point and nonpoint sources, US Environmental Protection Agency, Washington, DC.
Hock, R., 2003. Temperature index melt modelling in mountain areas, J. Hydrol. 282(1), 104-115.
Immerzeel, W. W., L. Van Beek, M. Konz, A. Shrestha and M. Bierkens, 2012.
Hydrological response to climate change in a glacierized catchment in the Himalayas, Clim. Chang. 110(3-4), 721-736.
Immerzeel, W. W., L. P. van Beek and M. F. Bierkens, 2010. Climate change will affect the Asian water towers, Science 328(5984), 1382-1385.
Johnson, D. L. and A. C. Miller, 1997. A spatially distributed hydrologic model utilizing raster data structures, Comput. & Geosci. 23(3), 267-272.
Julien, P. Y., B. Saghafian and F. L. Ogden, 1995. Rater-based hydrologic modeling of spatially-varied surface runoff, J. Am. Water Resour. Assoc. 31(3), 523-536.
Kaser, G., M. Großhauser and B. Marzeion, 2010. Contribution potential of glaciers to water availability in different climate regimes, Proceedings of the National Academy of Sciences 107(47), 20223-20227.
Kayastha, R. B., Y. Ageta and K. Fujita, 2005. Use of positive degree-day methods for calculating snow and ice melting and discharge in glacierized basins in the Langtang Valley, Clim. and Hydrol. of Mt. Ar., 7-14 pp.
Kayastha, R. B., T. Ohata and Y. Ageta, 1999. Application of mass balance model to a Himalayan glacier, J. Glaciol. 45(151), 559-567.
Kayastha, R. B., Y. Takeuchi, M. Nakawo and Y. Ageta, 2000. Practical prediction of ice melting beneath various thickness of debris cover on Khumbu Glacier, Nepal, using a positive degree-day factor, Debris-covered Glaciers: Proceedings of an International Workshop Held at the University of Washington in Seattle, Washington, USA, p. 71-82.
Konz, M., D. Finger, C. Buergi, S. Normand, W. Immerzeel, J. Merz, A. Giriraj and P. Burlando, 2010. Calibration of a distributed hydrological model for simulations of remote glacierised Himalayan catchments using MODIS snow cover data, Global Change: Facing Risks and Threats to Water Resources, p. 465-473.
Konz, M., S. Uhlenbrook, L. Braun, A. Shrestha and S. Demuth, 2007. Implementation of a process-based catchment model in a poorly gauged, highly glacierized Himalayan headwater, Hydrol. and Earth Syst. Sci. 11(4), 1323-1339.
Kumar, M., G. Bhatt and C. J. Duffy, 2010. An object-oriented shared data model for GIS and distributed hydrologic models, Int. J. Geogr. Inform. Sci. 24(7), 1061-1079. Lo, Y.-H., J. A. Blanco, B. Seely, C. Welham and J. P. Kimmins, 2011. Generating
reliable meteorological data in mountainous areas with scarce presence of weather records: the performance of MTCLIM in interior British Columbia, Canada, Environ. Modelling & Software 26(5), 644-657.
Luce, C. H. and D. G. Tarboton, 2010. Evaluation of alternative formulae for calculation of surface temperature in snowmelt models using frequency analysis of temperature observations, Hydrol. and Earth Syst. Sci. 14(3), 535-543.
Mahat, V. and D. G. Tarboton, 2012. Canopy radiation transmission for an energy balance snowmelt model, Water Resour. Res. 48, W01534.
Mahat, V. and D. G. Tarboton, 2013. Representation of canopy snow interception, unloading and melt in a parsimonious snowmelt model, Hydrol. Process. in press Mahat, V., D. G. Tarboton and N. P. Molotch, 2013. Testing above and below canopy
representations of turbulent fluxes in an energy balance snowmelt model, Water Resour. Res. 49(2), 1107-1122.
Maidment, D. R., 2002. ArcHydro: GIS for water resources, ESRI, Inc., Redlands, CA. Martinec, J., A. Rango and R. Roberts, 1994, The Snowmelt-Runoff Model (SRM) Users
Manual, Updated Edition 1994, Version 3.2, Department of Geography - University of Bern, Bern, Switzerland.
Matsuda, Y., 2003. Positive degree-day factors for ice ablation on four glaciers in the Nepalese Himalayas and Qinghai-Tibetan Plateau, Bull. Glaciol. Res. 20, 7-14. Mitasova, H., L. Mitas, W. M. Brown, D. P. Gerdes, I. Kosinovsky and T. Baker, 1995.
Modelling spatially and temporally distributed phenomena: new methods and tools for Grass GIS, Int J. Geogr. Inform. Syst. 9(4), 433-446.
Neteler, M. and H. Mitasova, 2004. Open source GIS: a GRASS GIS approach, Vol 2, Springer, New York.
Racoviteanu, A. E., R. Armstrong and M. W. Williams, 2013. Evaluation of an ice ablation model to estimate the contribution of melting glacier ice to annual discharge in the Nepal Himalaya, Water Resour. Res. 49(9), 5117-5133.
Racoviteanu, A. E., M. W. Williams and R. G. Barry, 2008. Optical remote sensing of glacier characteristics: a review with focus on the Himalaya, Sensors 8(5), 3355-3383.
Rango, A. and J. Martinec, 1994. Areal extent of seasonal snow cover in a changed climate, Nordic Hydrol. 25(1994), 233-246.
Rango, A. and J. Martinec, 1995. Revisiting the degree-day method for snowmelt computations, Water Resour. Bull. 31(4), 657-669.
Ravazzani, G., 2013a. MOSAICO, a Fortran 90 Free Open Source library for raster based hydrological applications, EGU General Assembly Conference, 15, p. 8761.
Ravazzani, G., 2013b. MOSAICO, a library for raster based hydrological applications, Comput. & Geosci. 51, 1-6.
Schmitz, O., D. Karssenberg, W. P. van Deursen and C. Wesseling, 2009. Linking external components to a spatio-temporal modelling framework: Coupling MODFLOW and PCRaster, Environ. Modelling & Software 24(9), 1088-1099. Shilpakar, R. B., N. M. Shakya and A. Hiratsuka, 2009. Impact of climate change on
snowmelt runoff: A case study of Tamakoshi basin in Nepal, International
Symposium on Society for Social Management Systems, SSMS2009, Kochi, Japan, Internet Journal, SMS09-124, p.
Sten, B. and F. Arne, 1973. Development of a conceptual deterministic rainfall-runoff model, Nordic Hydrol. 4(3), 147-170.
Strassberg, G., N. L. Jones and D. R. Maidment, 2011. Arc hydro groundwater, Esri Press, Austin, Texas.
Strassberg, G., D. R. Maidment and N. L. Jones, 2007. A geographic data model for representing ground water systems, Ground Water 45(4), 515-518.
Tarboton, D. G., T. G. Chowdhury and T. H. Jackson, 1995. A Spatially Distributed Energy Balance Snowmelt Model, in Biogeochemistry of Seasonally Snow-Covered Catchments (Proceedings of a Boulder Symposium, July 1995), Edited by K. A. Tonnessen, M. W. Williams and M. Tranter, IAHS Publ. no. 228, Wallingford, p. 141-155.
Tarboton, D. G. and C. H. Luce, 1996, Utah Energy Balance Snow Accumulation and Melt Model (UEB), Computer model technical description and users guide, Utah Water Research Laboratory and USDA Forest Service Intermountain Research Station, Logan, UT, 64 pp.
Thapa, K., 1993. Estimation of snowmelt runoff in Himalayan catchments incorporating remote sensing data, IAHS Publications-Publications of the International Association of Hydrological Sciences 218, 69-74.
Thayyen, R. and J. Gergan, 2010. Role of glaciers in watershed hydrology: a preliminary study of a "Himalayan catchment", The Cryosphere 4(1), 115-128.
Uhlenbrook, S. and C. Leibundgut, 2002. Process‐oriented catchment modelling and
multiple‐response validation, Hydrol. Process. 16(2), 423-440.
Uhlenbrook, S., S. Roser and N. Tilch, 2004. Development of a distributed, but conceptual catchment model to represent hydrological processes adequately in the meso scale, J. Hydrol. 291, 278-296.
Van Der Knijff, J., J. Younis and A. De Roo, 2010. LISFLOOD: a GIS‐based distributed
model for river basin scale water balance and flood simulation, Int. J. Geogr. Inform. Syst. 24(2), 189-212.
Van Deursen, W. and C. Wesseling, 1992. The PCRASTER package, Department of Physical Geography, University of Utrecht, Utrecht, The Netherlands
Van Deursen, W. and C. Wesseling, 1996. PCRaster version 2 manual, Department of Physical Geography, Utrecht University, Utrecht, The Netherlands
Wesselung, C. G., D. J. KARSSENBERG, P. A. Burrough and W. DEURSEN, 1996. Integrating dynamic environmental models in GIS: the development of a Dynamic Modelling language, Trans. in GIS 1(1), 40-48.
Zhang, X., G. Hörmann and N. Fohrer, 2009. Hydrologic comparison between a lowland catchment (Kielstau, Germany) and a mountainous catchment (XitaoXi, China) using KIDS model in PCRaster, Adv. Geosci. 21, 125-130.
CHAPTER 2
INTEGRATION OF AN ENERGY BALANCE SNOWMELT MODEL INTO AN
OPEN SOURCE MODELING FRAMEWORK1
Abstract
This paper presents a data model for organizing the inputs and outputs of an energy balance snowmelt model (the Utah Energy Balance Model, UEB) that provides a foundation for its integration into the EPA BASINS modeling framework and enables its coupling with other hydrologic models in this system. Having UEB as a BASINS component has facilitated its coupling with the Geospatial Streamflow Forecast Model (GeoSFM) to compute the melting of glaciers and subsequent streamflow in the
Himalayas. The data model uses a combination of structured text and network Common Data Form (netCDF) files to represent parameters, geographical, time series, and gridded space-time data. We describe the design and structure of this data model, integration methodology of UEB and GeoSFM and illustrate the effectiveness of the resulting
coupled models for the computation of surface water input and streamflow for a glaciated watershed in Nepal Himalayas.
2.1. Introduction
Snow and Glaciers provide significant contributions to streamflow in the Hindu Kush Himalayan (HKH) region. Managing water resources and protecting against flooding requires an ability to model streamflow that is driven by precipitation and
1Coauthored by Avirup Sen Gupta, David G. Tarboton, Paul Hummel, Molly E. Brown
snowfall, snow and glacier melt, and hydrologic processes involved in runoff generation. This motivates the need to couple snow/glacier and streamflow models. In this study, we combined two independent models (1) the Utah Energy Balance (UEB) Snowmelt Model (Tarboton et al., 1995; Tarboton and Luce, 1996; Mahat and Tarboton, 2012) and (2) the United State Geological Survey (USGS) Geospatial Streamflow Forecast Model
(GeoSFM) (Asante et al., 2008) to simulate streamflow using snow- and glacier-melt information. This was done within the US Environmental Protection Agency (EPA) Better Assessment Science Integrating point and Nonpoint Sources (BASINS) modeling system (Kinerson et al., 2009) modeling framework as part of a NASA project to provide integrated modeling capability to take advantage of NASA data products in this region. To facilitate the integration of UEB into the EPA BASINS so that it could be coupled and made interoperable with other models in BASINS and so it could be applied over a grid, the input/output data model of UEB was redesigned and generalized to have greater flexibility in its text inputs/outputs and to exploit the capability of network Common Data Form (netCDF) to hold gridded space (two dimensions) and space-time (three
dimensions) data.
The Himalayan region is one of the world’s largest reservoirs of snow and glaciers and is a major freshwater source for 1.4 billion people in Asia (Immerzeel et al., 2010). A recent study by Racoviteanu et al. (2013) shows glaciers contribute over 58% of total annual streamflow in a high altitude Himalayan watershed (Langtang Khola) in the Trishuli basin in Nepal. Glacier-melt models and water balance studies are often
complicated by limited access to glacierized area, insufficient data measurement infrastructure, and a lack of financial support (Konz et al., 2007). Yet, some research
advances have been made towards the understanding of glacier melt contributions to streamflow mostly by using temperature index models (Kayastha et al., 2000; 2005; Immerzeel et al., 2010; 2012; Konz et al., 2010). There are, however, challenges associated with these models. Estimates of the glacier-melt contribution to streamflow by different models vary greatly (Racoviteanu et al., 2013), and inconsistent assessment methods and a high degree of uncertainty in modeling glacier change and weather input data make melt estimates inconclusive (Immerzeel et al., 2012). Furthermore,
temperature index models are limited in their ability to quantify energy balance processes in complex topography where the interactions between radiation and topography (slope and aspect) play significant roles in snow and glacier melting. Also, in developing countries in South Asia there is limited expertise and access to tools needed to integrate models and translate research knowledge into policy and water resources management decisions. Thus, there is a need for better models as well as a system that can be used in the local institutions involved in water resources management to conduct their own local analyses. The work here that incorporates a physically based model into EPA BASINS strives to address these needs.
The Utah Energy Balance (UEB) Snowmelt Model (Tarboton et al., 1995; Mahat and Tarboton, 2012; 2013; Mahat et al., 2013) is a physically based model that simulates surface melt by estimating surface energy fluxes from weather inputs. UEB parameterizes the snowpack using lumped (depth averaged) state variables so as to avoid having to model the complex processes that occur within a snowpack. Physical differences
between bulk (depth averaged) properties and the surface properties, which are important for calculating surface energy exchanges, are captured by modeling diurnally forced heat
flow at the surface using the so-called force-restore parameterization where there is a forcing term related to the difference between surface and depth temperature and a restore term related to the temporal gradient of surface temperature (Deardorff, 1978; Luce and Tarboton, 2010). Prior to this study, UEB did not have a glacier melt
component and was configured as a point model that could be applied at a single site with homogeneous (or average) terrain characteristics and weather input data.
GeoSFM is a spatially semi-distributed, physically based streamflow simulation program. GeoSFM incorporates terrain analysis tools, hydrologic simulation routines, and tools for time series post-processing. GeoSFM’s ability to simulate streamflow using remotely sensed data to compensate for lack of ground-based observations makes it especially suitable for the data scarce HKH region. However, GeoSFM does not have an explicit way to represent snow and glaciers or to estimate melt from these sources, which limits its use to only low-elevation, non-glaciated, rain-fed downstream watersheds in HKH. This limitation can be overcome by the addition of a model to estimate snow and glacier melt. UEB was chosen for this purpose because the model was open source and provided a relatively simple, transferable, physically-based approach to the quantification of snowmelt. We envision that the coupling between GeoSFM and UEB in an integrated framework will enhance streamflow prediction information in glaciated watersheds in the HKH region and elsewhere.
UEB and GeoSFM were developed independently with no prior means of interoperability. Prior to this study, these programs were incompatible in terms of data format, scale, and could not be easily coupled. The US EPA’s BASINS software is an open source framework that facilitates the integration of programs. BASINS has as
plug-in components a number of hydrologic programs as well as data preparation and results analysis tools (EPA, 1998; Parisi et al., 2003). Given the target application in the HKH region, the plug-in framework and free and open source aspects of BASINS made it an ideal choice for coupling UEB and GeoSFM. UEB and GeoSFM were each configured as BASINS plug-ins to accomplish their integration. The resulting operational software application is referred to as HIMALA BASINS. This software application retains all of the original BASINS 4.0 analysis, data downloading functionalities, preexisting plug-in and adds UEB and GeoSFM as two new plug-ins. To overcome the scarcity of available input data in the HKH region, we developed a capability to derive inputs for UEB from the Modern-Era Retrospective Analysis for Research and Applications (MERRA) (Bosilovich, 2008; Rienecker et al., 2011) and Southern Asia Daily Rainfall Estimate (RFE2) (Xie et al., 2002; Xie and Arkin, 1996) products provided by NASA and NOAA, respectively. The integrated system can run UEB to simulate total surface water input, and then run GeoSFM to simulate streamflow, perform sensitivity analysis, and enable parameter calibration using streamflow data at a gauged outlet.
The contributions of this paper are (1) the development of a data model to
structure the input and output of UEB to enable its extension from a point-based research model to a spatially distributed operational model capable of running over a watershed to simulate snow and glacier ablation; and (2) the integration of UEB into the EPA BASINS simulation environment for coupling with the GeoSFM model. "Data model" here refers to the specific data structures used to represent UEB parameters, site variables, state variables and dynamic inputs and outputs. The data model is distinct from the computer code or program often also referred to as a “model.” In the remainder of this paper, we
use the word “program” to refer to the computer program and “model” to refer to the data model to keep these concepts distinct.
Section 2.2 provides a brief background on UEB, GeoSFM, and BASINS. In Section 2.3, we describe UEB and geoSFM plugins developed within EPA BASINS and the data model developed to extend UEB from a point program to a grid program to facilitate its integration into BASINS and coupling with GeoSFM. In Section 2.4, we use the coupled models to simulate snow and glacier melt and the generation of streamflow from the glaciated Langtang Khola watershed in Nepal. This paper concludes with a summary of research contributions and ideas for consideration in future work.
2.2. Background
2.2.1. Utah Energy Balance Snowmelt Program
The Utah Energy Balance (UEB) program was originally written in Fortran 77 to produce snowmelt outputs at a point (such as a weather station) driven by the inputs at that location. UEB (Tarboton et al., 1995; You, 2004; Mahat and Tarboton, 2012) is physically-based and tracks point energy and mass balances to quantify snow
accumulation and melt. To enhance the capability of UEB to quantify snow processes in a forest covered area, Mahat and Tarboton (2012) developed a two-stream radiation transfer process that explicitly accounts for canopy scattering, absorption, and refection. They also added the capability to represent turbulent exchanges within and above a forest canopy (Mahat et al., 2013) and to represent snow interception (Mahat and Tarboton, 2013). The most recent version of UEB with forest canopy additions has four state
content, US (kJ m-2); the dimensionless age of the snow surface; and the snow water
equivalent of canopy intercepted snow, WC (m). The dimensionless age of snow is a
surface condition variable defined by Dickinson et al. (1993) to parameterize the
sensitivity of the decrease of albedo over time due to the increase in snow grain size and accumulation of dirt to environmental conditions such as temperature. The UEB program is driven by inputs of air temperature, precipitation, wind speed, relative humidity, and incoming shortwave and longwave radiation at time steps (i.e., typically less than 6 hours) sufficient to resolve the diurnal cycle.
UEB was initially tested by simulating snow water equivalent (SWE) and snow melt at point locations such as experimental weather stations in the Western United States. These included stations in the Reynolds Creek Experimental Watershed, Boise, Idaho; Utah State University drainage and evapotranspiration research farm; and the TW Daniels Experimental Forest (TWDEF) in Logan, Utah (Tarboton and Luce, 1996; Luce and Tarboton, 2010; Mahat and Tarboton, 2012). UEB has also successfully been used in several snow studies such as estimating snowmelt and sublimation in the high Atlas mountains in Morocco (Schulz and De Jong, 2004), examining climate change impacts in Sacramento/San Joaquin watershed in the Western US (Knowles and Cayan, 2002), and assessing the importance of meteorological variables in snowmelt processes (Raleigh et al., 2008).
To account for glacier melt, which is primarily driven by surface energy
exchanges, we extended the representations of surface energy balance fluxes in the UEB snowmelt program to include the melting and generation of surface water from a glacier surface. Maps of glaciers and their surface albedo, determined from remote sensing, are
used as inputs. Seasonal snow may accumulate and melt on a surface of glacier ice or bare ground. When seasonal snow cover on top of glacier ice completely melts the surface energy balance switches to the glacier substrate surface and may generate melt from the glacier ice. The surface, or substrate, beneath seasonal snow may be input as one of four types: (1) Ground/non-glacier, (2) Clean glacier ice, (3) Debris covered glacier ice and (4) Glacier accumulation zone. For grid cells with ground/non-glacier substrate, the program computes energy content and simulates snow melt as it did prior to the implementation of glacier melting. For grid cells in the glacier accumulation zone, the program is bypassed, as all precipitation is presumed to add to glacier accumulation. For clean or debris-covered glacier, the program tracks seasonal snow accumulation and ablation, but when seasonal snow water equivalent is zero, the energy balance at the surface is used to calculate the melting of glacier ice, which becomes a component of the surface water input. The difference in functionality between a debris-covered and clean glacier ice surface is the substrate albedo, which quantifies the fraction of incoming solar radiation reflected from the surface when the substrate is exposed. This albedo is
provided as a separate input layer. Debris covered glacier albedo is generally lower than that of clean glacier ice, resulting in larger energy inputs and higher melt rates.
Additional details on the glacier implementation are reported in Chapter 4.
2.2.2. Geospatial Streamflow Model
The USGS Geospatial Streamflow Model (GeoSFM) is a semi-distributed, physically-based hydrologic program developed to monitor flood hazards and provide early warning across Africa and other data scarce regions around the globe (Asante et al., 2008). It was originally configured to operate as an extension within ArcView 3.2 to take
advantage of existing spatial analysis algorithms. GeoSFM uses a wide range of input data, including digital elevation model (DEM), topographical, land cover, and soil data, daily estimates of precipitation, and potential evapotranspiration to predict daily
streamflow at in-situ gauge stations. GeoSFM is designed to use remotely sensed and satellite data to compensate for the data scarcity in data sparse parts of the world. The program has six components: (1) the terrain analysis module, (2) the parameter
estimation module, (3) the data preprocessing module, (4) the water balance module, (5) the flow routing module, and (6) the post-processing module.
GeoSFM has been used in the HKH region for the past ten years to take
advantage of satellite-derived precipitation data products to help with water management and flood prediction (Shrestha et al., 2008; Shrestha, 2011).The International Centre for Integrated Mountain Development (ICIMOD), a HKH regional organization for water resources management, used GeoSFM for streamflow simulation in large watersheds such as Brahmaputra (Pervez et al., 2008) and Bagmati rivers (Shrestha et al., 2008) using satellite-based rainfall data.
GeoSFM’s terrain analysis module uses DEM data to delineate subwatersheds and stream networks to establish the connectivity among various subwatersheds and to
compute topographical parameters such as slope and aspect. Using United Nations Food and Agriculture Organization (FAO) and United Nations Educational, Scientific and Cultural Organization (UNESCO) soil data (Batjes, 1997), the parameter estimation module estimates soil parameters such as water holding capacity, hydrological active depth, texture, and saturated hydraulic conductivity. The land cover data is used to compute an impervious area grid and vegetation roughness of each subwatershed. The