Developments in Tourism Climatology
A. Matzarakis, C. R. de Freitas and D. Scott
(Eds.)
3rdInternational Workshop on Climate, Tourism and Recreation
Alexandroupolis, Greece 19 – 22 September 2007 Commission on Climate, Tourism and
Recreation
Commission on Climate, Tourism and Recreation
International Society of Biometeorology
Freiburg, December 2007
Developments in Tourism Climatology
Edited by: Andreas Matzarakis, Christopher de Freitas and Daniel Scott
Commission Climate, Tourism and Recreation, International Society of Biometeorology
Contact: [email protected]
Pages: 289
CONTENTS
Preface 5
Climate, tourism and recreation – A decade of the ISB’s Commission on Climate, Tourism and Recreation - C. R. de Freitas, A. Matzarakis and D. Scott
7 Climate and bioclimate information for tourism – The example of Evros prefecture in
Greece - A. Matzarakis 12
Climate preferences for tourism: An exploratory Tri-Nation comparison - D. Scott, S. Gössling and C. R. de Freitas
18
Biometeorological basis for Croatian tourism - K. Zaninovic and A. Matzarakis 24 The importance of climate for recreational planning in rural areas - Case Study of Mugla
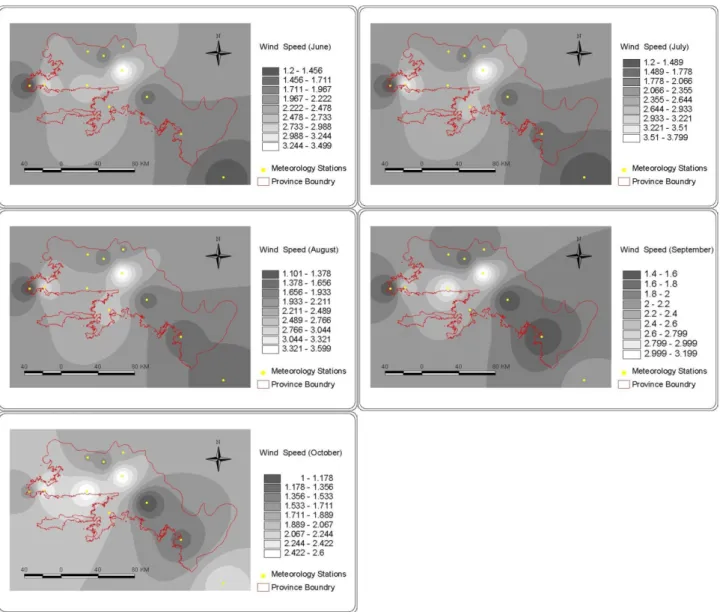
province - M. Topay
29 Variation of thermal bioclimate in the Lake Balaton tourist region (Hungary) -A. Nemeth,
V. Schlanger and A. Katona 37
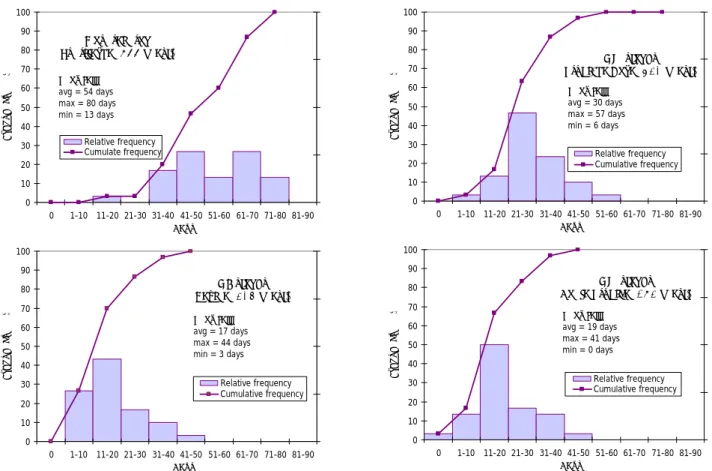
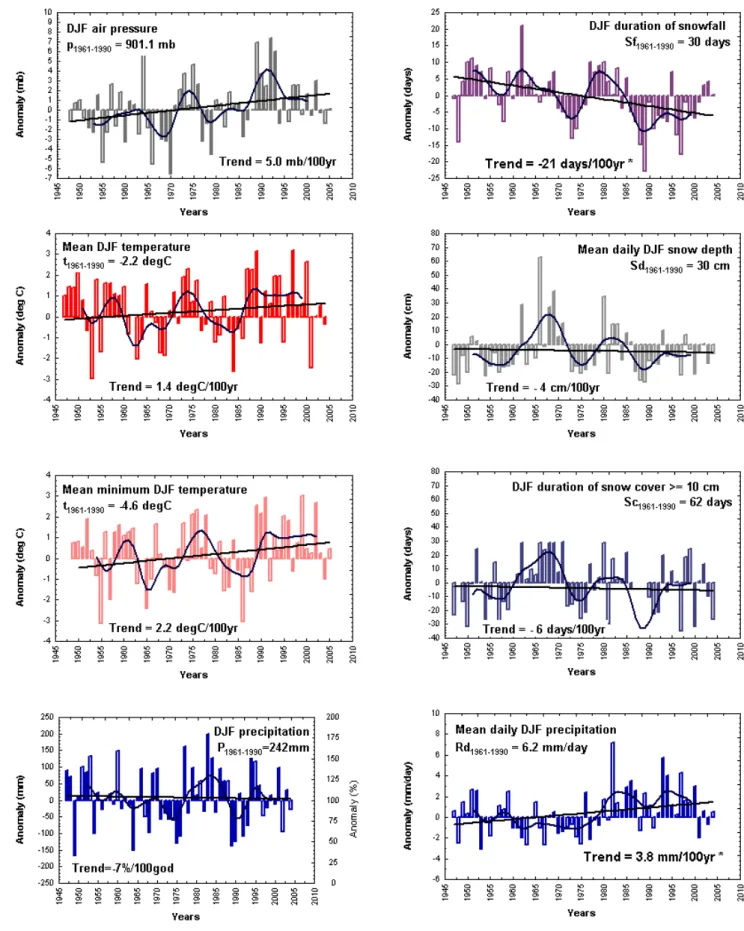
Snow baseline conditions and changes for winter tourism - M. Gajic-Capka 43 Assessment method for climate and tourism based on daily data - A. Matzarakis 52 Bioclimate and tourism potential in National Parks of Taiwan - T.-P. Lin
and A. Matzarakis
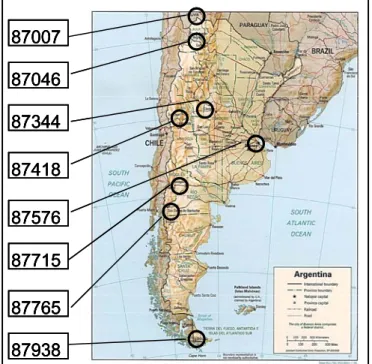
59 North-South variation of bioclimatic parameters in Argentina during summer months -
A. Helbig, A. Matzarakis and E. Piacentini
66 How does climate effectively affect tourism? The advantage of weather type methodology - H. Andrade, M. J. Alcoforado and S. Oliveira
74
Using webcam images for climate and tourism research - A. Moreno 80
Estimation of climatic resources for summer sport recreation in the Jewish Autonomous Region of Russia - E. Grigorieva and E. Fetisov
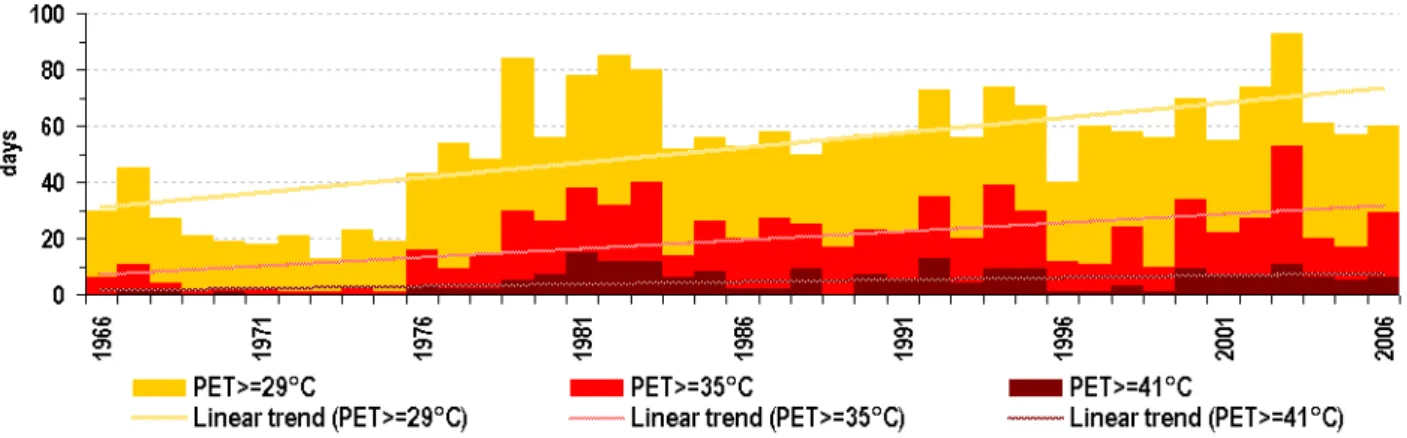
87 The heatwaves over southern Balkans as an indicator of the climate change: A case study
on August 2006 - Ch. Balafoutis 93
"The sky fell down” - Perceptions and implications of extreme weather events for Hungarian tourism - T. Rátz and K. Szalai
101 Weather and climate as limiting factors in winter tourism in polar areas: Changing climate and nature-based tourism in Northern Finland - K. Tervo
109 Weather limitations for winter and summer tourism in Central Europe - K. Blazejczyk 116 Analysis of summer tourism period for Austria based on climate variables on daily basis -
A. Matzarakis, E. Koch and E. Rudel 122
RayMan: A tool for tourism and applied climatology - A. Matzarakis and F. Rutz 129 The need of the weather forecasts adapted for recreation in Lithuania - J. Liukaityte 139 Biometeorological conditions in mountainous communities and adjacent urban center in Greece by the use of indices: The case study of Mountainous Nafpaktia -
A. Kamoutsis, A. Matsoukis, I. Charalampopoulos and A. Chronopoulou-Sereli
144
The human comfort conditions in Bulgarian Black seaside - A. Tzenkova, J. Ivancheva, ´ E. Koleva and P. Videnov
150 Spa destination development using a decision support system - The role of climate and bioclimate - E. A. Didascalou, P. Th. Nastos and A. Matzarakis
158 Bioclimate information for climate therapy in Istanbul - A. Matzarakis and Z. Karagülle 166 The impacts of climate change on ski resorts and tourist traffic - M. Tepfenhart,
W. Mauser and F. Siebel
172 Snowmaking - A suitable adaptation strategy? Examples from Tyrol/Austria - R. Steiger 178 Using an analogue approach to examine climate change vulnerability of the New England (USA) ski tourism industry - J. Dawson, D. Scott and G. McBoyle
The potential influences of climate change on tourist demand in winter sport centres in
Slovenia - K. Vrtacnik Garbas 199
Climate trends and sustainable development of tourism in coastal and low mountain range regions (CAST) - C. Bartels, H. Heinrichs, M. Barth, E. Kreilkamp, A. Matzarakis
and A. Möller
207
Acclimatization demands of recreationists moving within the southern region of the Russian Far East - E. Grigorieva
214 Weather dependence of tourist’s spatial behaviour and destination choices: Case study with passive mobile positioning data in Estonia - O. Järv, A. Aasa, R. Ahas
and E. Saluveer
221
“Summer (2007) set in with its usual severity” (Coleridge) - Impacts on tourism and the
insurance industries - A. Perry 228
Sensitivity of thermal conditions for tourism to climate change and variability: A comparison of regional scale case studies - C. R. de Freitas and A. Matzarakis
232 Climate change scenarios and tourism - How to handle and operate with data –
A. Matzarakis, O. Matuschek, R. Neumcke, F. Rutz and M. Zalloom
240 Climate Change = Tourism Change? Likely impacts of climate change on tourism in
Germany's North Sea Coast Destinations - J. Willms 246
The impacts of climate change on tourism and potential adaptation responses in Coastal and Alpine Regions - T. Cegnar
254 Climate change and climate-tourism relationships in Germany - C. Endler
and A. Matzarakis 260
Climate change and tourism in the Black Forest in Germany – A tourism and climate approach for forest areas - K. Oehler and A. Matzarakis
267 How can recreation and tourism benefit from multi-disciplinary approaches to assess and adapt to climate change? Lessons from the U.S. Southwest -B. Morehouse, G. Frisvold and R. Bark
274
Adaptive responses of tourism to climate change - A sociological perspective -
J. Jetzkowitz
This publication grew out of the Third International Workshop of the International Society of Biometeorology, Commission on Climate Tourism and Recreation (CCTR), held in Alexandropoulos, Greece from 19 to 22 September 2007. The aims of the Workshop were to bring together a selection of researchers and tourism experts to review the current state of knowledge of tourism and recreation climatology and explore possibilities for future work and the role of the CCTR in this.
A total of 38 delegates from 22 countries attended the meeting. Their fields of expertise included biometeorology, bioclimatology, thermal comfort and heat balance modelling, tourism marketing and planning, urban and landscape planning, architecture, sociology, geography, meteorology, environmental physics, ecology, emission reduction and climate change impact assessment. Participants came from universities and research institutions in 22 countries, including: Austria, Bulgaria, Canada, Croatia, Estonia, Lithuania, Finland, France, Germany, Greece, Hungary, Italy, the Netherlands, New Zealand, Portugal, Russia, Slovenia, Switzerland, Taiwan, Turkey, United Kingdom and United States of America.
Business conducted during the Workshop was divided between nine sessions, namely: 1) climate as nature based resource for tourism; 2) weather and climate as limiting factors for tourism and recreation; 3) development and presentation of new climate tourism indices; 4) relationships between climate and tourism; 5) effects of weather and climate extremes on tourism and recreation; 6) climate therapy for tourism and recreation; 7) effects of climate change on winter tourism and tourism industry; 8) economic effects of climate change on tourism industry; and 9) adaptation of tourists and tourism industry on climate change. The oral presentations and posters covered a wide spectrum of themes; many were the product of co-operative research projects between members of the CCTR.
The content of this publication is based on the presentations made at the Workshop and reflects the new perspectives and methods that have evolved since the CCTR was established. To enable all presentations to be included in one volume, papers were limited to a maximum of eight pages. Readers are advised that English is not the first language of many of the contributors to this publication and no attempt was made by the editors to re-write any part of the submissions received from the authors. Consequently, the grammar and syntax in some of the articles is quaint but the meaning is clear.
3rdInternational Workshop on Climate, Tourism and Recreation
Alexandroupolis, Greece 19 – 22 September 2007 Commission on Climate, Tourism and
Recreation
Figure 1: Poster for the CCTR Third International Workshop
We would like to thank Mr. Jiannis Balafoutis from Greek Hospitality for the management of accommodation and other matters related to holding the Workshop in Greece and also Mr. Panagiotis Kyrou for his support and help. The financial support provided by TUI AG in Hannover, Germany, is gratefully acknowledged. We would also like to thank the management and staff of Alexander Beach Hotel in Alexandropoulos for their hospitality and support, including the facilities provided at the Hotel’s Thrace Conference and Convention Centre.
Andreas Matzarakis, Chris de Freitas and Daniel Scott December 2007
ISB’S COMMISSION ON CLIMATE, TOURISM AND RECREATION
C. R. de Freitas1, A. Matzarakis2 and Daniel Scott3
1School of Geography, Geology and Environmental Science, University of Auckland, New Zealand. 2Meteorological Institute, University of Freiburg, Freiburg, Germany
3 Department of Geography, University of Waterloo, Waterloo, Canada
The International Society of Biometeorology’s Commission on Climate, Tourism and Recreation (CCTR) was founded at the 15th International Congress of Biometeorology in Sydney, Australia in 1999 (from 1996 to 1999 it was an ISB Working Group). The co-founders were Andreas Matzarakis of the University of Freiberg, Germany, and Chris de Freitas of the University of Auckland, New Zealand. The aims of the CCTR are to: a) bring together a selection of researchers and tourism experts from around the world to review the current state of knowledge of tourism and recreation climatology; and b) explore possibilities for future research and the role of the CCTR in this. A decade on research in tourism and recreation climatology has developed and expanded due in large part to the initiatives and activities of the CCTR, including collaborative research projects run under the auspices of the CCTR and three international workshops.
The collaborative research projects included: 1) a research project on devising and testing a second generation climate index for tourism (CIT) conducted by Chris de Freitas (New Zealand), Daniel Scott and Geoff McBoyle (Canada); 2) a cross-cultural analysis of climate preferences for tourism by Daniel Scott (Canada), Chris de Freitas (New Zealand) and Stefan Gossling (Sweden); 3) preparation of a chapter on ‘Climate Change Adaptation in Tourism and Recreation’ by Daniel Scott (Canada), Chris de Freitas (New Zealand) and Andreas Matazarakis (Germany) in the ISB-sponsored book ‘Biometeorology for Adaptation’; 4) an comprehensive bibliography of work in tourism and recreation climatology by the Canadian team of Daniel Scott, Brenda Jones and Geoff McBoyle covering the period 1936 to 2005; 5) a research project investigating climate change and tourism in the Black Forest and North Sea region of Germany by researchers from the University of Freiburg (Andreas Matzarakis) and the University Lüneburg (Harald Heinrichs); and 6) an investigation into the effects of climate change on the climatic tourism potential in Austria by Andreas Matzarakis and the Central Institute of Meteorology and Geodynamics.
Three international workshops of climate, tourism and recreation have been convened by the CCTR since its inception in 1999. The initial conference was the “First International Workshop on Climate, Tourism and Recreation: The Way Forward” held in Halkidiki in northern Greece from
5-climatology, thermal comfort and heat balance modelling, climate change impact assessment, tourism marketing and planning, urban and landscape planning, architecture and UV-radiation. Delegates were from Australia, Austria, Bulgaria, Canada, Croatia, Germany, Greece, New Zealand, Poland, United Kingdom, USA, and Switzerland. The First Workshop noted that: a) tourism is one of the world’s biggest industries and also the fastest growing, b) for many regions, tourism is the most important source of income, and c) generally accepted that climate is an important part of the tourism resource base. Despite this the Workshop highlighted
The fact that little is known about: a) the effects of climate on tourism, or the role it plays; the economic impacts of climate on commercial prospects for tourism; and c) which climate related-criteria people use to make decisions about tourism choices. The Workshop identified several research themes that warrant attention:
• Better understanding of what climate-related information is required by tourists and the tourism industry.
• The need to explore the distinction between impacts of climate on tourists versus the impact on the tourism industry.
• The need to assess the role of weather and longer term expectations of climate on destination choices.
• To identify what climate related-criteria people use to make decisions about tourism choices
• Determine how climate information products are currently used by the tourism industry.
• Identify the sort of climate information required by the tourism sector.
• The need for a tourism climate index that integrates all facets of climate, uses standard data, and is objectively tested and verified.
Overall delegates concluded that future research directions should depend to a large extent on what is required by tourism planners, members of the tourism industry and tourists themselves. Determining what these requirements should be a high priority. The presentations at the meeting were published as the ‘Proceedings of the First Workshop of the Commission on Climate, Tourism
and Recreation’, edited by at Andreas Matazarakis. and Chris de Freitas (Available at:
<http://www.mif.uni-freiburg.de/isb/>).
The Second International Workshop on Climate, Tourism and Recreation was held at the village of Kolimbari, Crete, from 9-12 June 2004. A total of 40 international delegates attended. A substantial publication covered the proceedings of the Workshop in the form of a book edited by A. Matzarakis, C.R. de Freitas, C.R. and D. Scott, 2004, ‘Advances in Tourism Climatology’ (Berichte des Meteorologischen Institutes der Universität Freiburg, Nr. 12, 260 pp). Hard copies were sent to over 500 libraries and made available free of charge electronically at
<http://www.mif.uni-can be taken as recognition of the work of the CCTR and its standing among the research community.
The Third International CCTR Workshop was held in Alexandropoulos, Greece from 19 to 22 September 2007, and is the basis of the current book ‘Developments in Tourism Climatology’. The aims of the Workshop were to bring together a selection of researchers and tourism experts to review the current state of knowledge of tourism and recreation climatology and explore possibilities for future work and what the role of the CCTR might be in this research agenda.. Attending the workshop were 38 delegates from 22 countries, including Austria, Bulgaria, Canada, Croatia, Estonia, Lithuania, Finland, France, Germany, Greece, Hungary, Italy, the Netherlands, New Zealand, Portugal, Russia, Slovenia, Switzerland, Taiwan, Turkey, United Kingdom and United States of America. Their fields of expertise included biometeorology, bioclimatology, thermal comfort and heat balance modelling, tourism marketing and planning, urban and landscape planning, architecture, sociology, geography, climate change, meteorology, environmental physics, ecology, emission reduction and climate change impact assessment. Highly encouraging was that more than the half of those who attended were female and about one third of the delegates were young scientists under 35 years old. These demographics portend a very positive future for progress in tourism climatology over the next two decades.
The programme of the Third Workshop consisted of nine sessions and three brainstorming sessions. Each day the Workshop had two separate types of meetings. Oral and poster presentations of scientific papers took place during the day. This was followed by evening sessions at which the results of day’s presentations and various themes were discussed and key points summarised for publication in a report on the findings of the CCTR Workshop.
Business conducted during the Workshop was divided between nine sessions, namely: 1) climate as nature based resource for tourism; 2) weather and climate as limiting factors for tourism and recreation; 3) development and presentation of new climate tourism indices; 4) relationships between climate and tourism; 5) effects of weather and climate extremes on tourism and recreation; 6) climate therapy for tourism and recreation; 7) effects of climate change on winter tourism and tourism industry; 8) economic effects of climate change on tourism industry; and 9) adaptation of tourists and tourism industry on climate change.
The oral presentations and posters covered a wide spectrum of themes; many were the product of co-operative research projects between members of the CCTR. Among these were: processing and presentation of meteorological and climatological data for tourism purposes; processing of GSG data and links with tourism; observations via webcams and the perception of weather; ways for
climate research; effects of climate on tourism in coastal and mountainous areas; effects of extreme events on tourism and recreation and their causes and consequences; sensitivity of thermal conditions with regard to climate variability and change; interactions between ecological and socio-economical factors; and risks and opportunities from climate change. The themes of the brainstorming sessions were: development of indices for climate and tourism; weather and climate information for media and tourism industry; winter sports and climate change; climate preferences of tourists and reflect areas where substantial research is taking place.
This volume is made up of are summaries of papers presented at the Third CCTR Workshop. The content reflects the new perspectives and methods in studying climate–tourism relationships that have evolved since the CCTR was established. Figure 1 depicts the key themes conceptually.
What stands out is the diversification of research questions and methodologies in the field over the past decade. The work presented here clearly demonstrates that the field of tourism and recreation climatology has become truly multidisciplinary, with researchers from a number of disciplines bringing fresh perspectives and new methods to the task of advancing the field of tourism and recreation climatology. It is a truly exciting time in the field of tourism and recreation climatology, and as the title suggests, the purpose of this volume is to showcase the diversity of on-going research in this rapidly advancing field of inquiry.
Figure 1. Current climate-tourism relationships: themes and issues.
Looking forward to the decade ahead, the CCTR intends to continue its work, which aims to:
climate-based indices for tourism and recreation.
• Develop frameworks for collaborative research on climatic risks, opportunities, and research/information needs for reducing impacts on the tourism and recreation industries;
• Identify sources of data and potential partnerships to investigate interactions between tourism and climate variability and change and to provide usable information for planning and management; and
• Encourage the development of young scholars interested in the multi-faceted dimensions of weather-climate and tourism-recreation.
CLIMATE AND BIOCLIMATE INFORMATION FOR TOURISM – THE EXAMPLE OF EVROS PREFECTURE
A. Matzarakis
Meteorological Institute, University of Freiburg, D-79085 Freiburg, Germany [email protected]
ABSTRACTThere is demand for climate data and information it can provide, but in regions with a
poor network of climate stations there is a shortage of appropriate quantity of climate data. A two way approach for the creation of climate information is developed here and tested on the Evros prefecture of northeastern Greece. We use the data from the collation program of the Climatic Research Unit, based on climatological observations between 1960 and 1990, to produce seasonal maps. The existing data sets provide adequate information for the production of high spatial resolution maps. The results were presented by mapping the generated parameters using digital elevation models. The available data were processed with modern geo-statistical methods. Maps for air temperature, relative humidity, sunshine duration, wind speed, precipitation and physiologically equivalent temperature have been generated. This approach generates climate and climate related information for areas with a low density of climate stations.
KEYWORDS:Tourism, climatology, climate data, Evros
INTRODUCTION
On the whole Greece has a low density network of climate stations. The poor spatial coverage results in a shortage of good quality climate data for applied climate rsearch in areas such as agriculture and tourism (Matzarakis, 2006) and for bioclimate applications in particular (Matzarakis et al., 1999). The aim of this study is to present a bioclimatic analysis of Evros prefecture by means of climate mapping with the aid of geo-statistical methods (between the meso and macro scale).
STUDY AREA
The study area is the Evros prefecture of northeastern Greece comprised of two national parks, the forest reserve of Dadia and the river delta of the river Evros, the island Samothraki, which also belongs to the district of Evros, is also a government controlled reserve. The climate can be described as a mix of Mediterranean and Central European climate. Τhe national parks of Evros contain special ecosystems that are home to a number of rare animal species which are a major tourst attraction of the region.
Thracia). The river Evros is the natural border to Bulgaria in the northeast and with Turkey in the east. In the south the district Evros abuts on the Aegean Sea. The district of Evros extends between 40° and 42° degrees latitude and 25° to 27° degrees longitude. In the east, the topography is dominated by rivers - predominantly by the river Evros - and areas with heights of less than 100 m. In the west the district’s topography rises up to 1200 m. The island Samothraki is mountainous, with 1611 m the highest point of the island
METHODS AND DATA
The used climate data for this analysis was provided by the data collation program at the Climatic Research Unit of the University of Norwich (New et al., 1999, 2000). The method employed uses this to data to to produce high spatial (ten minute) resolution climate information for applications at the meso scale. The data required for thermal bioclimate analysis are air temperature, relative humidity, solar radiation (sunshine duration) and wind speed. These are available at monthly resolution for the climate period 1961 to 1990 for the Evros prefecture. The grid referernces of the climate data are used as the dependent variable. They are recalculated to provide a higher spatial resolution (1 km) through the use of geo-statistical methods, where the independent variables are latitude, longitude and elevation. The multiple regression using the three factors is accurate enough to contruct maps. Digital elevation data of the GLOBE data set (Hastings et al., 1999) was used. Mean monthly data is used for the following variables: air temperature, relative humidity, wind speed, percentages of sunshine duration, monthly temperature amplitude, precipitation amount and days with precipitation a simple statistical downscaling based on latitude, longitude and elevation have been applied for the target areas.
The statistical correlation for the applied spatial resolution of approximately one kilometer show that the correlation coefficient between the climate parameters and the geographical and topographical factors depend more or less on the distribution of the land and sea masses and the size of the target area. Nevertheless, the statistical results allow the production of high resolution climate and bioclimate maps for Evros and other parts of Greece.
The calculation of PET is performed with the aid of the RayMan Model, which calculates the thermal indices mentioned above (Matzarakis et al. 2000, 2007).
Additionally, daily data of the Alexandroupolis airport station of the Hellenic National Weather Service have been analysed for tourism purposes.
RESULTS AND EXAMPLES
Seasonal air temperature, relative humidity, wind speed, percentages of sunshine duration, precipitation amount, days with precipitation and physiologically equivalent temperature have been constructed. Given that air temperature is one of the most important, meteorological/climatological variables for the description of the climate of a place or a region, this variable was given special attention. In winter the air temperature varies between -1 and 7 °C in the Evros region. The lowest temperatures, is found in winter (December until February) in the mountains and the highest temperatures are found in the regions near the sea with lower elevation. In spring (March to May) the temperature varies between 9 °C and 18 °C. The lowest temperature is measured at higher elevations on the island Samothraki and the high-lying areas of the mountains in the west of the Evros area. In summer (June to August) average temperatures are between 18 °C and 24 °C. In autumn (September to November) the temperatures lie predominantly between 9 °C and 11 °C (Fig. 1, example summer).
The seasonal duration of sunshine (hours) show the proportional value of sunshine hours in each season. Cloud cover and radiation conditions are also shown. The duration of sunshine ranges between 35 % and 60 % in winter, where the highest values are found close to the coasts and the lowest are obtained in the northern and the mountainous areas. In spring the values lie between 55 % and 75 % with the same distribution as in winter. In summer the duration of sunshine ranges between 70 % and 85 %; this is the season with the highest radiation benefit. In autumn the values ranges between 30 % and 60 % and thus show that the cloud cover has its maximum in autumn and winter (Fig. 2, for summer months).
The precipitation data is given in mm, where 1 mm corresponds to a volume of 1 l/m². Precipitation is usually high in winter and the values range between 520 mm and 800 mm. The highest values are detected at higher elevations and the lowest values in the low-lying central inland region. In spring falls approx. 80 mm of precipitation in higher elevated areas and less than 30 mm near the coast. In summer the precipitation is below 30 mm and declines gradually from north to south. In autumn the precipitation increases again and the values rise to approx. 100 mm, whereby the highest values are obtained in the mountainous areas and in the south (Fig. 3, for summer months).
Bioclimate parameters describe the influence of the thermal environment on humans (Höppe, 1999). With the bioclimate of humans and other variables, i.e. the duration of sunshine, the climate of a place or a region can be described and categorized regarding tourism and recreation. The human bioclimate here is described here through the physiologically equivalent temperature (PET), which includes the influence of air temperature, air humidity, wind velocity, radiation, clothing and activity of humans are contained (Matzarakis et al., 1999, VDI, 1998). PET of approximately 20 °C equates to thermal comfort.
Figure 1: Summer map of air temperature (°C) for Evros
Figure 2: Summer map of sunshine duration (%) for Evros
Figure 3: Summer map of precipitation (mm) for Evros
Figure 4: Summer map of physiologically equivalent temperature (°C) for Evros
Increasing values indicate heat stress and falling values cold stress. PET-conditions up to 23 °C do not mean heat stress for humans. Values over 30 °C indicate large heat load and thus affect the human health. In the Evros district the PET values vary between -3 °C and +4 °C, which indicates a cooling load for humans in winter. In spring the PET values range between 13 °C and 22 °C and
exists also in autumn, although the values are lower than in spring. In summer the highest values are observed in the central parts of the region and the areas with more pleasant bioclimate are located in the coastal zone and in the mountainous areas (Fig. 4, for summer months).
Alexandroupolis, 1951 - 2002 0% 10% 20% 30% 40% 50% 60% 70% 80% 90% 100%
I II III IV V VI VII VIII IX X XI XII
Month Frequency PET > 41 35.1 - 41.0 29.0 - 35.0 23.1 - 29.0 18.1 - 23.0 13.1 - 18.0 8.1 - 13.0 4.1 - 8.0 0.1 - 4.0 -10.0 - 0.0 < -10 PETa = 16.6 °C PETmax = 49.8 °C PETmin = -14.8 °C PETd < 0 = 29.8 d PETd > 30 = 54.2 d PETd > 35 = 13.1 d 18 > PETd > 29 = 103.4 d
Figure 5: PET-Diagram for Alexandroupolis for the period: 1951-2001
Alexandroupolis, 1951 - 2002 0% 10% 20% 30% 40% 50% 60% 70% 80% 90% 100%
I II III IV V VI VII VIII IX X XI XII Month Fr eque n cy R R > 20.0 15.1 - 20.0 10.1 - 15.0 5.1 - 10.0 3.1 - 5.0 1.1 - 3.0 0.1 - 1.0 No RR RRa = 588.0 mm RRmax = 140.2 mm RH > 93% = 1.3 d Cloud < 5 = 231.0 d VP > 18 = 0.0 d VV > 8 m/s = 90.3 d 64.7 58.2 49.1 39.7 36.9 30.2 22.9 15.0 31.8 58.0 90.4 91.1 Sunnydays = 303.7 d
Figure 6: Precipitation diagram for Alexandroupolis for the period: 1951-2001
Based on daily information of the Alexandroupolis station of the National Hellenic Weather Service, for the period 1955 to 2003 a tourism-climate approach have been used (Matzarakis, 2007). The data have been analyzed in a human-biometeorological manner (PET-classes and frequencies) (Fig. 5) and precipitation (classes and frequencies) (Fig. 6) in ten days intervals. Additionally, based on the data a CTIS (climate tourism information scheme) has been calculated. The CTIS includes thermal, aesthetic and physical facets of climate for tourism purposes.
Figure 7: CTIS for Alexandroupolis for the period: 1951-2001
CONCLUSIONS
Spatial climate modelling used here is useful for generating data with higher quality spatial coverage useful in a variety of applications requiring seasonal or monthly climate data, such as agriculture, tourism, health and regional planning. Because only monthly mean data were available, only monthly and seasonal maps of simple climatological and bioclimate (physiologically equivalent temperature) maps can be constructed. Given the avialbility of daily climate data, high resolution temporal analysis can be performed and the results presented in a demanded way, a.e. CTIS.
ACKNOWLEDGEMENT
Thanks to the Hellenic National Weather Service for providing the data for the station of Alexandroupolis.
REFERENCES
Hastings, D.A., Dunbar, P.K., Elphingstone, G.M., Bootz, M., Murakami, H., Maruyama, H., Masaharu, H., Holland, P., Payne, J., Bryant, N.A., Logan, T., Muller, J.-P., Schreier, G., MacDonald, J.S., (eds.) (1999) The Global Land One-kilometer Base Elevation (GLOBE) Digital Elevation Model, Version 1.0. National Oceanic and Atmospheric Administration, National Geophysical Data Center, 325 Broadway, Boulder, Colorado 80303, U.S.A. Digital data base on the World Wide Web (URL: http://www.ngdc.noaa.gov/mgg/topo/globe.html). Matzarakis, A. (2006) Το κλίμα του Έβρου – The climate of Greece – Das Klima von Evros.
www.mif.uni-freiburg.de/matzarakis/evros.htm
Matzarakis, A. (2007) Entwicklung einer Bewertungsmethodik zur Integration von Wetter- und Klimabedingungen im Tourismus. Ber. Meteor. Inst. Univ. Freiburg Nr. 16, 73-79.
Matzarakis, A., Mayer, H., and Iziomon, M.G. (1999) Applications of a universal thermal index: physiological equivalent temperature. Int. J. Biometeorol. 43: 76-84.
New, M., Hulme, M., Jones, P. (1999) Representing twentieth century space-time climate variability. Part 1: development of a 1961-1990 mean monthly terrestrial climatology. J. Clim. 12: 829-856.
New, M., Hulme, M. and Jones, P.D. (2000) Representing twentieth century space-time climate variability. Part 2: development of 1901-96 monthly grids of terrestrial surface climate. J. Clim.
CLIMATE PREFERENCES FOR TOURISM: AN EXPLORATORY TRI-NATION COMPARISON
D. Scott*1, S. Gössling2 and C. R de Freitas3
1Dept. of Geography, University of Waterloo, Waterloo, Ontario, Canada 2Dept. of Service Management, Lund University, Helsingborg, Sweden
3School of Geography, Geology and Environmental Science, University of Auckland, Auckland, New Zealand
ABSTRACT This study examines tourist perceptions of optimal climatic conditions for tourism
and the relative importance of four climatic parameters (air temperature, precipitation, sunshine, wind) in three major tourism environments (beach-coastal, urban, mountains). A survey instrument was administered to 831 university students representative of the young-adult travel segment, in three countries (Canada, New Zealand, Sweden). Three salient findings included: the perceived optimum climatic conditions varied significantly among the three major tourism environments, the relative importance of the four climatic parameters was not the same in the three tourism environments, and the climatic preferences of respondents from the three nations were found to be consistent in some ways but varied significantly in others. The findings have a number of important implications for the literature on climate and tourism, including the development of climate indices for tourism, the definition of single optimal climate for global tourism, and climate change impact assessments. We believe that with a broader cross-cultural sample of tourist segments, this approach holds much promise for revealing the detailed complexities of tourist preferences for climate.
KEYWORDS: Preference, Canada, New Zealand, Sweden
INTRODUCTION
A number of lines of evidence indicate that the atmospheric environment is a dominant attribute of a tourist destination and has a major effect on tourism demand and satisfaction (de Freitas, 2003). Weather and climate affect tourists and the desirability of tourist destinations in different ways. Weather is the current state of the atmospheric environment and is what tourists actually experience when at a destination, affecting their activities and holiday satisfaction. Weather also affects key aspects of tourism operations, including infrastructure, activity programming, and operating costs. Climate is the weather that is expected at a location for a certain time and is typically expressed as ‘average weather’ (sometimes referred to as ‘climate normals’ or ‘climate means’) over a 30-year
Climate is what a tourist would anticipate experiencing at a specific destination and time and is a key factor considered by tourists, consciously or implicitly during travel planning, For these reasons it is an important attribute taken into account in locational planning, infrastructure development and destination marketing.
Weather and climate are an intrinsic component of the vacation experience and can act as a central motivator in an individual’s selection of holiday destination and timing of holiday travel, and be a salient factor in tourism spending and holiday satisfaction. Hu and Ritchie (1993) reviewed several destination image studies and found that ‘natural beauty and climate’ were of universal importance in defining destination attractiveness. Weather has been found to influence travel patterns and expenditures in several nations (see Scott 2006, for a review). It is thought that for many travellers, weather conditions at the destination are central to overall trip satisfaction, although further research to understand the influence of weather on consumer travel satisfaction is required. Seasonal climate fluctuations at tourism destinations and at high latitude source regions are considered a key driver of the seasonality of global tourism demand (Gossling and Hall, 2006).
The aforementioned body of research indicates clearly that climate is a resource that is exploited by the tourism industry and tourists alike and as such is a resource that can be measured and evaluated (de Freitas, 2003). An important challenge of doing so rests in the selection of appropriate meteorological variables (e.g., temperature, rain, wind, sunshine, visibility, humidity, air quality, UV radiation, etc.) and in the definition of ‘optimal’ through to ‘unacceptable’ climatic states, as perceived by tourists.
The preferences of tourists for all aspects of climate have been explored in various ways. Several attempts have been made to identify most favourable or ‘optimal’ climate conditions for tourism generally and for specific tourism segments or activities (e.g., 3S holidays in beach environments). The purpose of evaluating climate for tourism and identifying ‘optimal’ climate conditions has varied in the literature. Overall, the heterogeneous approaches to examining tourist climate preferences and defining ‘optimal’ climates for tourism can be grouped into three types of studies: expert-based, revealed preference and stated preference. These respective bodies of literature are reviewed by the authors elsewhere and cannot be adequately discussed in this short paper.
The purpose of this study is to examine these two central questions using a survey of climatic preferences of a sample of tourists from three nations: Canada, New Zealand and Sweden. Four specific research questions guiding the study included:
1) What is the range of climate preferences among tourists in terms of the optimal conditions for certain variables, such as temperature? Are tourists homogenous in their climate preferences so
2) What is the relative importance of different climate parameters to tourists? Is temperature the dominant climate variable or are other variables equally important?
3) In what way, if at all, do the climate preferences of tourists differ among tourism environments or destinations where the dominant tourist activities would differ substantially?
4) Do cultural or ethnic differences exist in tourist climate preferences?
METHOD
To our knowledge, this study represents the first ex situ study of tourist climate preferences, where the survey is administered in a climate controlled laboratory setting, free of potential bias from existing or recent weather conditions and where respondents can express their perceived satisfaction with a wide range of climate conditions in very different tourism settings. A sample of university students was used for this study of stated climate preferences for tourism. Structured questionnaires were administered to undergraduate students attending upper year classes in the University of Waterloo (Waterloo, Canada), the University of Auckland (Auckland, New Zealand) and Lund University, Helsingborg Campus (Helsingborg, Sweden). The total survey sample consists of 831 students, with 333 from Canada, 207 from New Zealand and 291 from Sweden. A pre-test of the survey instrument (n=35) was conducted in Canada and slight modifications made to improve the clarity of some questions. The survey was conducted in English in all three countries.
RESULTS
Much of the existing literature considers air temperature to be the primary climate variable of importance to tourism. It was therefore deemed important to further explore the range and distribution of temperature preferences among the three distinct tourism environments. Preferred temperatures for each of the three environments varied among respondents and importantly among the three tourism environments. The median preferred temperature for beach holidays was 27 °C, five-degrees warmer than for urban destinations and seven-degrees warmer than for mountain destinations (Table 1). For a beach holiday, a majority (58 %) preferred a range of between 25-28 °C, while an additional 25 % of respondents preferred temperatures of 30°C or warmer. In an urban destination, 82 % preferred a cooler daily maximum temperature of between 19-26 °C. The preference for mountain destinations was even cooler, with 84 % identifying a daily maximum temperature of 15-26 °C as ideal and 44 % indicating a narrower range of between 19-22 °C. These results appear theoretically correct given the types of activities common to each type of tourism destination.
Beach Urban Mountain Mean 26.8 22.5 20.5
Median 27 22 20
Std Dev 4.54 4.12 3.96
Table 2 shows that the majority of respondents preferred scattered light cloud (25 %) as the sky condition in all three tourism environments. This finding is consistent with de Freitas’s (1990) findings in a beach tourism environment, but appears to carry through other tourism environments as well. There were however some notable differences in the preferences for sky condition among the three tourism environments.
Table 2: Ideal sky conditions in different tourism environments (percent of respondents) Cloud Cover
(% of sky) Beach Urban Mountain
0 % 41 % 12 % 23 % 25 % 54 % 54 % 57 % 50 % 4 % 31 % 18 % 75 % <1 % 1 % 3 % 100 % <1 % <1 % <1 % Mean Value (1-5) 1.64 2.39 2.01
Table 3 shows a clear majority preference for light breezes, particularly in beach environments where the cooling effect may be most beneficial, considering the stated preference for warmer temperatures in that environment and access to water to enhance the cooling affect of a light breeze. In urban and mountain environments there was more diversity in the stated preferences for wind conditions, as the remaining respondents were almost equally split by a preference for no wind or moderate wind conditions.
Table 3: Ideal wind conditions in different tourism environments (percent of respondents)
Wind Speed Beach Urban Mountain
No wind 7 % 10 % 18 %
Light breeze (1-9 km/h) 87 % 78 % 68 % Moderate wind (10-40 km/h) 6 % 12 % 14 % Strong wind (41-60 km/h) <1 % <1 % <1 % Very strong wind (61-90 km/h) <1 % <1 % <1 % Mean Value (range 1-5) 2.00 2.03 1.99
Exploring the relative importance of the four different weather variables (sunshine, temperature, rain and wind) in each of the tourism environments was an important objective of this study. A key finding is that the order of importance of the four climate variables investigated is not the same for any of the three major tourism environments. The results somewhat contradict the contention that temperature is the primary climate parameter for tourism and support the contention that climate indices that only examine the thermal aspect are not sufficient to assess the suitability of climate for tourism. The different climate preferences (temperature, sky condition and importance ranking of climate parameters) indicate (Tab. 4) that a universal climate index for tourism, as originally conceived by Meiczkowski (1985), may be conceptually unsound. Instead, the development of climate indices for specific major tourism segments, particularly those that are strongly influenced by weather (e.g., beach tourism, skiing), would appear more appropriate and an area deserving further inquiry.
Table 4: Importance of weather variables in different tourism environments Importance Rank Beach Mean (1-7) Urban Mean (1-7) Mountain Mean (1-7)
1 Sun 6.14 Temp 5.98 Rain 6.04
2 Temp 6.11 Rain 5.77 Temp 5.84
3 Rain 5.87 Sun 5.14 Sun 5.55
4 Wind 5.13 Wind 4.75 Wind 5.41
Temp = ‘comfortable temperature’ Rain = ‘absence of rain’
Wind = ‘absence of strong wind’ Sunshine = ‘presence of sunshine’
While the preceding findings have a number of salient implications for the literature, some of the most interesting results pertain to the different climate preferences among the respondents from the three countries. A discussion of these differences remains beyond the scope of this short paper.
CONCLUSION
In this study, a questionnaire was developed to investigate the perceived optimum climate conditions for tourism and the relative importance of four climate parameters in three major tourism environments. Data collection took place in three different countries – Canada, New Zealand, and Sweden – allowing for limited intercultural comparisons. Although the study only examined the perceptions of a sample of the young adult traveler market (represented by university students) the findings nevertheless have important implications for the assessment of tourism and climate interactions. Three findings were particularly notable. First, the study established that the perceived
examined. Second, the relative importance of the four climate variables examined (temperature, sunshine, rain and wind) was not the same in any of the three major tourism environments. Third, climate preferences were found to differ among respondents from the three nations in some ways, yet were highly consistent in others. The relative importance of the four climate parameters in the three tourism environments was also found to differ among the respondents from the three nations. The main limitations of this study are the relatively narrow tourist market segment it examined (young adults) and the restricted spatial coverage of the survey (only three nations). However, we believe this limitation is compensated for by the novel ability of the approach to explore the climate preferences of tourists in a detailed manner. Future research with a broader cross-cultural sample from more diverse climatic regions (tropical, temperate, monsoon and semi-arid) remains a potentially productive direction. It would seem that the existing literature has only begun to unveil the complexities of the interactions between climate and tourism and much more remains to be explored.
REFERENCES
de Freitas CR (1990) Recreation climate assessment. International Journal of Climatology 10: 89-103.
de Freitas CR (2003) Tourism climatology: evaluating environmental information for decision making and business planning in the recreation and tourism sector. International Journal of Biometeorology 4:45-54.
Gössling S, Hall CM (eds) (2006). Tourism and Global Environmental Change. Ecological, social, economic and political interrelationships. Routledge, London.
Hu Y, Ritchie J (1993) Measuring destination attractiveness: a contextual approach. Journal of Travel Research 32(20):25-34.
Mieczkowski Z (1985) The tourism climatic index: a method of evaluating world climates for tourism. The Canadian Geographer 29(3): 220-33.
Scott, D. (2006) Climate change and sustainable tourism in the 21st century. In: Tourism Research: Policy, Planning, and Prospects. J. Cukier (ed.). Waterloo: Department of Geography Publication Series, University of Waterloo. 175-248.
BIOMETEOROLOGICAL BASIS FOR TOURISM
Ksenija Zaninović1 and Andreas Matzarakis2
1Meteorological and Hydrological Service of Croatia, Zagreb, Croatia 2Meteorological Institute, University of Freiburg, Germany,
ABSTRACT Climate is an important resource for tourism and must be taken into account in
tourism promotions. Here the biometeorological conditions on the Adriatic coast and in the Croatian inland are compared. The biometeorological conditions are analyzed by means of frequency of thermal sensation based on physiologically equivalent temperature in ten-day periods throughout the year. In combination with some other meteorological parameters, such as air and sea temperature, sunshine duration, amount and number of days with precipitation and wind roses can be valuable for tourists, enabling everyone to choose the most convenient period for holidays, depending on personal conditions and needs.
KEYWORDS: Thermal sensation, physiologically equivalent temperature, meteorological leaflet
INTRODUCTION
Weather and climate, together with some other natural resources, such as geographical location, orography and landscape, play important roles for tourism and recreation (de Freitas, 2003). Since outdoor recreation is very weather sensitive (Perry, 1972), weather and climate can be one of the most important features attracting tourists, but also present limiting factors. The role of climate in determining the suitability of a region for tourism or outdoor recreation is often assumed to be self-evident and therefore to require no elaboration. Climate-related information is often very poor and barely helps tourists in planning and scheduling their holidays or the promotion of a tourist destination in publicity campaigns.
Climatic information can be useful in decision-making if presented in an appropriate form. Therefore it is important to identify which climate-related criteria people use to make their decisions about holiday destinations, taking into account that the human response to climate depends on individual perception and sensitivity. The atmospheric conditions can be divided into three main groups – thermal, physical and aesthetic (de Freitas, 1990). The “thermal” climate variable is air temperature or thermal sensation, “physical” variables are rain, snow and wind, while sunshine and cloudiness can be treated as the “aesthetic” climate variables (de Freitas, 1990).
In the first part, the biometeorological conditions in the period 1961-1990 at six meteorological stations in different climatic regions of Croatia are analyzed. These are Rovinj at Istra Peninsula, island Hvar in the middle Adriatic, Varazdin and Osijek in the continental lowland and Parg (863 m) and Zavizan (1594 m) in the mountain region of Croatia (Fig. 1). The biometeorological conditions are analyzed by means of ten-day mean values of thermal sensation measured at 7am, 2pm and 9pm during the year, and by means of the probability of occurrence of different thermal sensations that enable more detail information about bioclimate. The thermal sensation is defined by means of physiologically equivalent temperature PET as the physiologically significant assessment of the thermal environment derived from the human energy balance (Höppe, 1999, Matzarakis et al., 1999).
The second part of the work here puts together a “presents a climatological leaflet” useful for tourism, based on the analysis of 10-day periods of meteorological parameters important for tourism and recreation. The selection of meteorological parameters used here takes into account the thermal, physical and aesthetic components relevant for tourists.
Varazdin Osijek Parg Zavizan Rovinj Hvar BOSNIA AND HERZEGOVINA CROATIA SLOVENIA SERBIA Varazdin Osijek Parg Zavizan Rovinj Hvar BOSNIA AND HERZEGOVINA CROATIA SLOVENIA SERBIA
Figure 1: The position of analysed stations
RESULTS
Biometeorological conditions in Croatia
In the relatively small area of Croatia one can find several climates suitable for a variety of tourism actvities including recreational walking, fishing or health tourism in spas on the mainland, hiking, rafting and winter sports in the mountainous part, for summer sports as well as different sport activities in other seasons on the coast.
cold with mean values of PET between -5°C and 0°C and falling below -5°C only during the morning and evening. On the other hand, along the coast very cold weather is only found in mornings and evenings (PET mainly between 0°C and 4°C), while it is cold or even cool on the islands in the Mid Adriatic during the day. On the high elevated locations, mean PET is lower than -5°C for all days from mid November until the end of March.
In summer in the continental lowland and along the Adriatic coast it is mostly slightly warm or warm during the day, while the sensation of hot does not appear in mean values even during the afternoon. However, while the mornings in the continental part are comfortable, at the coast they are slightly warm. In the mountainous area it is mainly comfortable or even slightly cool, while slightly warm afternoons appear only at the end of July and the beginning of August at altitudes below 1000 m.
The probabilities of different thermal sensations according to PET values at 7 a.m. and 2 p.m. in ten-day periods during the year show that, for example, at 7 a.m. PET sometimes drops below -5°C on the coast although it does not influence the mean annual course. Similarly, during summer one can expect hot or very hot afternoons, especially in the eastern part of Croatia or the mid Adriatic region. Varaždin Osijek Rovinj Parg Zavižan Hvar 21 h I 7 h 14 h
JAN FEB MAR APR MAY JUN JUL AUG SEP OCT NOV DEC
21 h
I
7 h 14 h
JAN FEB MAR APR MAY JUN JUL AUG SEP OCT NOV DEC 21 h
I
7 h 14 h
JAN FEB MAR APR MAY JUN JUL AUG SEP OCT NOV DEC
21 h
I
7 h 14 h
JAN FEB MAR APR MAY JUN JUL AUG SEP OCT NOV DEC
I
7 h 14 h 21 h
JAN FEB MAR APR MAY JUN JUL AUG SEP OCT NOV DEC 21 h
I
7 h 14 h
JAN FEB MAR APR MAY JUN JUL AUG SEP OCT NOV DEC
PET (°C) -5 0 4 8 13 18 23 29 35 41 Varaždin Osijek Rovinj Parg Zavižan Hvar Varaždin Osijek Rovinj Parg Zavižan Hvar 21 h I 7 h 14 h
JAN FEB MAR APR MAY JUN JUL AUG SEP OCT NOV DEC
21 h
I
7 h 14 h
JAN FEB MAR APR MAY JUN JUL AUG SEP OCT NOV DEC 21 h
I
7 h 14 h
JAN FEB MAR APR MAY JUN JUL AUG SEP OCT NOV DEC
21 h
I
7 h 14 h
JAN FEB MAR APR MAY JUN JUL AUG SEP OCT NOV DEC
I
7 h 14 h 21 h
JAN FEB MAR APR MAY JUN JUL AUG SEP OCT NOV DEC 21 h
I
7 h 14 h
JAN FEB MAR APR MAY JUN JUL AUG SEP OCT NOV DEC
PET (°C) -5 0 4 8 13 18 23 29 35 41 Varaždin Osijek Rovinj Parg Zavižan Hvar PET (°C) -5 0 4 8 13 18 23 29 35 41 0% 20% 40% 60% 80% 100%
JAN FEB MAR APR MAY JUN JUL AUG SEP OCT NOV DEC
0% 20% 40% 60% 80% 100%
JAN FEB MAR APR MAY JUN JUL AUG SEP OCT NOV DEC
0% 20% 40% 60% 80% 100%
JAN FEB MAR APR MAY JUN JUL AUG SEP OCT NOV DEC
0% 20% 40% 60% 80% 100%
JAN FEB MAR APR MAY JUN JUL AUG SEP OCT NOV DEC
0% 20% 40% 60% 80% 100%
JAN FEB MAR APR MAY JUN JUL AUG SEP OCT NOV DEC
0% 20% 40% 60% 80% 100%
JAN FEB MAR APR MAY JUN JUL AUG SEP OCT NOV DEC Varaždin Osijek Rovinj Parg Zavižan Hvar Varaždin Osijek Rovinj Parg Zavižan Hvar PET (°C) -5 0 4 8 13 18 23 29 35 41 0% 20% 40% 60% 80% 100%
JAN FEB MAR APR MAY JUN JUL AUG SEP OCT NOV DEC
0% 20% 40% 60% 80% 100%
JAN FEB MAR APR MAY JUN JUL AUG SEP OCT NOV DEC
0% 20% 40% 60% 80% 100%
JAN FEB MAR APR MAY JUN JUL AUG SEP OCT NOV DEC
0% 20% 40% 60% 80% 100%
JAN FEB MAR APR MAY JUN JUL AUG SEP OCT NOV DEC
0% 20% 40% 60% 80% 100%
JAN FEB MAR APR MAY JUN JUL AUG SEP OCT NOV DEC
0% 20% 40% 60% 80% 100%
JAN FEB MAR APR MAY JUN JUL AUG SEP OCT NOV DEC
Figure 2: Annual course of ten-day mean values of thermal sensation at 7 am, 2 pm and 9 pm (left) and the probability of occurrence of different thermal sensations right at 7 a.m. (right above) and 2 p.m. (right below) Varaždin Osijek Rovinj Parg Zavižan Hvar PET (°C) -5 0 4 8 13 18 23 29 35 41 0% 20% 40% 60% 80% 100%
JAN FEB MAR APR MAY JUN JUL AUG SEP OCT NOV DEC
0% 20% 40% 60% 80% 100%
JAN FEB MAR APR MAY JUN JUL AUG SEP OCT NOV DEC
0% 20% 40% 60% 80% 100%
JAN FEB MAR APR MAY JUN JUL AUG SEP OCT NOV DEC
0% 20% 40% 60% 80% 100%
JAN FEB MAR APR MAY JUN JUL AUG SEP OCT NOV DEC
0% 20% 40% 60% 80% 100%
JAN FEB MAR APR MAY JUN JUL AUG SEP OCT NOV DEC
0% 20% 40% 60% 80% 100%
JAN FEB MAR APR MAY JUN JUL AUG SEP OCT NOV DEC Varaždin Osijek Rovinj Parg Zavižan Hvar Varaždin Osijek Rovinj Parg Zavižan Hvar PET (°C) -5 0 4 8 13 18 23 29 35 41 0% 20% 40% 60% 80% 100%
JAN FEB MAR APR MAY JUN JUL AUG SEP OCT NOV DEC
0% 20% 40% 60% 80% 100%
JAN FEB MAR APR MAY JUN JUL AUG SEP OCT NOV DEC
0% 20% 40% 60% 80% 100%
JAN FEB MAR APR MAY JUN JUL AUG SEP OCT NOV DEC
0% 20% 40% 60% 80% 100%
JAN FEB MAR APR MAY JUN JUL AUG SEP OCT NOV DEC
0% 20% 40% 60% 80% 100%
JAN FEB MAR APR MAY JUN JUL AUG SEP OCT NOV DEC
0% 20% 40% 60% 80% 100%
The climatological and biometeorological leaflet contains the analysis of thermal, aesthetic and physical parameters important for the tourists. In Fig. 3 the meteorological leaflet for Hvar is presented.
The thermal parameters are presented by means of annual trends of mean minimum and mean maximum temperatures and the number of days with different temperature characteristics (warm and tropical days, warm nights and cold days). The aesthetic characteristics of climate are shown using the annual trends of insolation and cloudiness as well as the number of clear and cloudy days. The physical parameters are represented by the means of annual courses of precipitation amounts and the number of days with precipitation. For winter tourism destinations some snow parameters can be presented, such as the number of days with snow cover higher than 30 cm, which is the minimum cover required for skiing. The analysis of biometeorological conditions is presented by means of thermal comfort distribution during the year as well as by the probability of occurrence of different thermal sensations (right column). Finally, the annual wind rose is shown for all terms of observation together. Sometimes, for example for sailors, the roses for different seasons and different terms of observations can be presented separately.
Climate and bioclimate of HVAR
According to Köppen’s classification of climate, Hvar has a moderately warm rainy climate, with the warmest month of July, with the mean temperature 24.7°C and the coldest month of January with the mean temperature 8.8°C. The daily mean temperature above 20°C can be expected from the beginning of June to the end of September. The swimming is convenient from mid June to early October when the sea temperature exceeds 19°C. Frost days with sub-zero temperatures are very rare. On the contrary, summer days with the highest daily temperature above 25°C appear between May and October, and in July and August nearly all days are summer days. During July and August the highest daily temperature often exceeds 30°C (tropical days), while the night temperature does not drop below 20°C (days with warm nights). The mean annual cloudiness is about four tenths. There is more cloudiness in the winter when over half the sky is overcast. In the spring the amount of cloudiness decreases, and in the summer it reaches the lowest values - in July and August only two to three tenths of the sky are overcast. With about 2700 hours of insolation a year, or an average of about 7.4 hours per day, Hvar belongs to the sunniest areas of Croatia. From November to February it has an average of 4-5 hours of sunshine a day, and in the sunniest season, in the summer, the sun shines on the average almost 12 hours a day. Clear days when the mean daily cloudiness is under two tenths, are twice as frequent as cloudy days, when over eight tenths of the sky are overcast. During July and August almost 75% of days in the month are clear. Most cloudy days occur between November and March, but even then there are not more than 10 cloudy days a month on average.
The mean annual precipitation in Hvar is about 730 millimetres. Most precipitation occurs in winter, which is a characteristic of the maritime precipitation regime. About 65% of the total precipitation occur between October and March, and in that period there are about 7 to 9 rainy days per month. The warm season has less precipitation and fewer rainy days, while in the summer there are only about 3-4 rainy days per month.
In the annual wind rose mild winds prevail. The most frequent winds come from the north-west and south-east directions (23%-24%), indicating the appearances of the maestral and the scirocco (jugo). In the summer, about midday, a characteristic flow comes from the west quadrant, the well-known mistral, which is insignificant in the total annual wind rose.
The average thermal sensation, influenced by the temperature, radiation, humidity and wind, ranges from very cold to hot. On average from mid November to the end of March mornings and evenings are cold, while during the afternoon it is cool. Very cold appears only early in the morning and late in the evening from December to February. Early spring and late autumn are slightly cool, but comfortable days are not rare. In May and September prevails comfortable. Spring and autumn are very favourable for active holidays with walks and sports.
In the summer prevails slightly warm with comfortable evenings, and warm afternoons in July and August. A favourable characteristic of the Hvar bioclimate is that the sensation of hot and very hot are rare and are felt nearly exclusively during the afternoon hours. Due to the fair and warm weather in that season, it is possible to stay in the open nearly all day, and in the warmest part of the day a refreshing sea bath mitigates the feeling of warmth.
Meteorological and hydrological service of Croatia
Autor / Author: M.Sc. Ksenija Zaninović
0 5 10 15 20 25 30 35 1 3 5 7 9 11 13 15 17 19 21 23 25 27 29 31 33 35 T em pe rat u re ( °C ) 30 50 70 90 R ela ti ve h um id ity ( % ) Relative humidity Mean min. temperature Mean air temperature Mean max. temperature Sea temperature JAN FEB MAR APR MAY JUN JUL AUG SEP OCT NOV DEC
0 2 4 6 8 10 1 3 5 7 9 11 13 15 17 19 21 23 25 27 29 31 33 35 Da ys
Summer days (tmax>25oC) Warm nights (tmin>20oC) Tropical days (tmax>30oC) Cold days (tmin<0oC)
JAN FEB MAR APR MAY JUN JUL AUG SEP OCT NOV DEC
0 2 4 6 8 10 12 14 16 18 20 1 3 5 7 9 11 13 15 17 19 21 23 25 27 29 31 33 35 In so la tio n ( ho ur s) 0 2 4 6 8 10 Cl ou dine ss ( ten th s) Insolation Cloudiness
JAN FEB MAR APR MAY JUN JUL AUG SEP OCT NOV DEC
0 2 4 6 8 10 1 3 5 7 9 11 13 15 17 19 21 23 25 27 29 31 33 35 Da ys Clear days Cloudy days
JAN FEB MAR APR MAY JUN JUL AUG SEP OCT NOV DEC
I
7 h 14 h 21 h
JAN FEB MAR APR MAY JUN JUL AUG SEP OCT NOV DEC
0% 20% 40% 60% 80% 100%
JAN FEB MAR APR MAY JUN JUL AUG SEP OCT NOV DEC
-5 0 5 10 15 20N NNE NE ENE E ESE SE SSE S SSW SW WSW W WNW NW NNW 0.8 PET (°C) -5 0 4 8 13 18 23 29 35 41 0 20 40 60 80 100 1 3 5 7 9 11 13 15 17 19 21 23 25 27 29 31 33 35 P re cip ita tio n ( m m ) 0 2 4 6 8 10 Day s
Days with precipitation Precipitation
JAN FEB MAR APR MAY JUN JUL AUG SEP OCT NOV DEC
Climate and bioclimate of HVAR Climate and bioclimate of HVAR
According to Köppen’s classification of climate, Hvar has a moderately warm rainy climate, with the warmest month of July, with the mean temperature 24.7°C and the coldest month of January with the mean temperature 8.8°C. The daily mean temperature above 20°C can be expected from the beginning of June to the end of September. The swimming is convenient from mid June to early October when the sea temperature exceeds 19°C. Frost days with sub-zero temperatures are very rare. On the contrary, summer days with the highest daily temperature above 25°C appear between May and October, and in July and August nearly all days are summer days. During July and August the highest daily temperature often exceeds 30°C (tropical days), while the night temperature does not drop below 20°C (days with warm nights). The mean annual cloudiness is about four tenths. There is more cloudiness in the winter when over half the sky is overcast. In the spring the amount of cloudiness decreases, and in the summer it reaches the lowest values - in July and August only two to three tenths of the sky are overcast. With about 2700 hours of insolation a year, or an average of about 7.4 hours per day, Hvar belongs to the sunniest areas of Croatia. From November to February it has an average of 4-5 hours of sunshine a day, and in the sunniest season, in the summer, the sun shines on the average almost 12 hours a day. Clear days when the mean daily cloudiness is under two tenths, are twice as frequent as cloudy days, when over eight tenths of the sky are overcast. During July and August almost 75% of days in the month are clear. Most cloudy days occur between November and March, but even then there are not more than 10 cloudy days a month on average.
The mean annual precipitation in Hvar is about 730 millimetres. Most precipitation occurs in winter, which is a characteristic of the maritime precipitation regime. About 65% of the total precipitation occur between October and March, and in that period there are about 7 to 9 rainy days per month. The warm season has less precipitation and fewer rainy days, while in the summer there are only about 3-4 rainy days per month.
In the annual wind rose mild winds prevail. The most frequent winds come from the north-west and south-east directions (23%-24%), indicating the appearances of the maestral and the scirocco (jugo). In the summer, about midday, a characteristic flow comes from the west quadrant, the well-known mistral, which is insignificant in the total annual wind rose.
The average thermal sensation, influenced by the temperature, radiation, humidity and wind, ranges from very cold to hot. On average from mid November to the end of March mornings and evenings are cold, while during the afternoon it is cool. Very cold appears only early in the morning and late in the evening from December to February. Early spring and late autumn are slightly cool, but comfortable days are not rare. In May and September prevails comfortable. Spring and autumn are very favourable for active holidays with walks and sports.
In the summer prevails slightly warm with comfortable evenings, and warm afternoons in July and August. A favourable characteristic of the Hvar bioclimate is that the sensation of hot and very hot are rare and are felt nearly exclusively during the afternoon hours. Due to the fair and warm weather in that season, it is possible to stay in the open nearly all day, and in the warmest part of the day a refreshing sea bath mitigates the feeling of warmth.
Meteorological and hydrological service of Croatia
Autor / Author: M.Sc. Ksenija Zaninović
Meteorological and hydrological service of Croatia
Autor / Author: M.Sc. Ksenija Zaninović
0 5 10 15 20 25 30 35 1 3 5 7 9 11 13 15 17 19 21 23 25 27 29 31 33 35 T em pe rat u re ( °C ) 30 50 70 90 R ela ti ve h um id ity ( % ) Relative humidity Mean min. temperature Mean air temperature Mean max. temperature Sea temperature JAN FEB MAR APR MAY JUN JUL AUG SEP OCT NOV DEC
0 2 4 6 8 10 1 3 5 7 9 11 13 15 17 19 21 23 25 27 29 31 33 35 Da ys
Summer days (tmax>25oC) Warm nights (tmin>20oC) Tropical days (tmax>30oC) Cold days (tmin<0oC)
JAN FEB MAR APR MAY JUN JUL AUG SEP OCT NOV DEC
0 2 4 6 8 10 12 14 16 18 20 1 3 5 7 9 11 13 15 17 19 21 23 25 27 29 31 33 35 In so la tio n ( ho ur s) 0 2 4 6 8 10 Cl ou dine ss ( ten th s) Insolation Cloudiness
JAN FEB MAR APR MAY JUN JUL AUG SEP OCT NOV DEC
0 2 4 6 8 10 1 3 5 7 9 11 13 15 17 19 21 23 25 27 29 31 33 35 Da ys Clear days Cloudy days
JAN FEB MAR APR MAY JUN JUL AUG SEP OCT NOV DEC
I
7 h 14 h 21 h
JAN FEB MAR APR MAY JUN JUL AUG SEP OCT NOV DEC
0% 20% 40% 60% 80% 100%
JAN FEB MAR APR MAY JUN JUL AUG SEP OCT NOV DEC
0% 20% 40% 60% 80% 100%
JAN FEB MAR APR MAY JUN JUL AUG SEP OCT NOV DEC
-5 0 5 10 15 20N NNE NE ENE E ESE SE SSE S SSW SW WSW W WNW NW NNW 0.8 PET (°C) -5 0 4 8 13 18 23 29 35 41 0 20 40 60 80 100 1 3 5 7 9 11 13 15 17 19 21 23 25 27 29 31 33 35 P re cip ita tio n ( m m ) 0 2 4 6 8 10 Day s
Days with precipitation Precipitation
CONCLUSIONS
The analysis of climate and bioclimate, especially if presented in a clear and simple way understandable for everyone provides a basis for the promotion of tourism destinations. The information can be used by tourist managers in advertising, by tourists who want to decide as to when to take their holidays and by physicians to warn their patients of periods that are unsuitable or ideal for health therapy. For example, the people who have difficulty tolerating summer heat, such as the elderly and infirm, could choose the best period of biometeorological conditions to take vacation, which prevail at the Adriatic coast during spring and autumn or in the mountains during summer. For sportsmen, who prefer an active vacation, pleasant or even cool conditions would be more convenient than summer heat, when the body has to spend energy for defence from heat.
REFERENCES
de Freitas, C.R. (1990) Recreation climate assessment. Int. J. Climatol. 10: 89-103.
de Freitas, C.R. (2003) Tourism climatology: evaluating environmental information for decision making and business planning in the recreation and tourism sector. Int. J. Biometeorol. 48: 45-54 Höppe, P. (1999) The physiological equivalent temperature – a universal index for the
biometeorological assessment of the thermal environment. Int. J. Biometeorol. 43: 71–75. Matzarakis, A., Mayer, H., Iziomon, M.G. (1999) Applications of a universal thermal index:
physiological equivalent temperature, Int. J. Biometeorol. 43: 76-84. Perry, A. H. (1972) Weather, climate and tourism. Weather 27: 199-203.