Transportation Research Procedia 14 ( 2016 ) 3390 – 3398
2352-1465 © 2016 The Authors. Published by Elsevier B.V. This is an open access article under the CC BY-NC-ND license (http://creativecommons.org/licenses/by-nc-nd/4.0/).
Peer-review under responsibility of Road and Bridge Research Institute (IBDiM) doi: 10.1016/j.trpro.2016.05.291
ScienceDirect
6th Transport Research Arena April 18-21, 2016
Left-turn phasing decisions based on conflict analysis
Nikiforos Stamatiadis
a,*, Salee Tate
a, Adam Kirk
aa
University of Kentucky, Raymond Bldg., Lexington, KY 40506-0281, USA
Abstract
The need to balance safety and operational efficiency at intersections requires special attention for accommodating left turn movements. Signalized intersections epitomise this need because unnecessary protection of left turns can significantly increase operational delay. Left turn protection however, increases safety and there is a need for proper balancing between the conflicting goals of safety and operations. The long time required to collect crash data to evaluate the use of existing warrants render them frequently ineffective and the need for a preliminary design tool to assist in left turn phasing decisions is needed. This research developed a quantitative safety assessment tool that predicts left turn related conflicts and uses them to determine the appropriate phasing scheme for left turns. The model was developed based on VISSIM micro-simulation software in conjunction with the Surrogate Safety Assessment Model.
© 2016The Authors. Published by Elsevier B.V..
Peer-review under responsibility of Road and Bridge Research Institute (IBDiM).
Keywords:Left turn phasing; traffic signals; intersction design
1. Introduction
All roadway design components require a continuous balance between safety and operational needs to provide for an efficient and appropriate design. Signalized intersections are a prime example of this need, since their goal is to apportion space and time to various competing movements in a safe and efficient manner. Accommodation of left
* Corresponding author. Tel.: +1-859-257-8012; fax: +1-859-257-4404. E-mail address:[email protected]
© 2016 The Authors. Published by Elsevier B.V. This is an open access article under the CC BY-NC-ND license (http://creativecommons.org/licenses/by-nc-nd/4.0/).
turn movements is especially critical due to their inherent safety concerns stemming from the need of driver judgment to complete them. Phasing strategies have been used to separate conflicting movements and diminish any potential safety impacts of such movements but this comes at the expense of higher delays for the intersection. It is therefore critical to develop tools that can assist in balancing safety and operations and aid in the identification of the appropriate left turn phasing for an intersection.
The interactions between left turning vehicles and opposing traffic can crate safety concerns and traffic signal phasing has been used to separate these streams of traffic. In the US, the Manual on Uniform Traffic Control Devices (MUTCD) identifies four potential design alternatives for the left turn movement at signalized intersections:
permissive only, protected only, protected/permissive, and variable left turn mode (FHWA, 2009). Permissive only left turn phasing allows vehicles to complete their turn only when they are unopposed and they have to yield to oncoming traffic and pedestrians crossing the cross street. This permits completion of the left turn as and when the driver sees fit and has no adverse delays impacts, i.e., most appropriate phasing for operations. Protected only phasing separates the two streams of traffic providing the right of way to each movement separately and thus is the most appropriate for safety. Protected/Permissive phasing is a combination of the two phasing plans attempting to balance intersection safety and operational efficiency. Variable left turn phasing is an adaptive traffic signal strategy that uses all three phase options and implements them based on the time of day or level of traffic activity experienced at a specific intersection aiming to accommodate the variable nature of traffic.
Intersection capacity, geometric features, and crash history are typical factors used in selecting the appropriate left turn phasing at signalized intersections. The cross product of the left turns and opposing volume is typically a factor that many state departments of transportation (DOTs) use as the main metric for selecting phasing schemes. A review of 40 state signal design policies indicated that 24 have such a policy in place and 17 DOTs use crash history in addition to cross product for left turn phase selection (Hedges, 2014). It is therefore important to develop a metric that can assist in the left turn phase selection due to the absence of any state policies.
Past research has used empirical before-and-after studies to assess the effectiveness of converting a protected only left turn intersection to protected/permissive; however, this required years of time to complete because of the rarity of crash events (Tarko et al., 2009). An issue with studies similar to Tarko et al. (2009) is that they do not provide any predictive information because their focus is only in the assessment of the left turn treatments based on historical crash data. The recently developed Intersection Design Aid Tool (IDAT) used conflicts as a surrogate measure to crash events and micro-simulation software helped to develop models for left turn, right turn angle, rear end, and sideswipe (lane change) conflicts (Kirk, 2013; Stamatiadis et al., 2012). The scope of this research, however, did not specifically examine left turn movements at intersections but rather overall intersection performance.
As noted above, there is no quantitative safety assessment tool that signal designers can rely upon to determine left turn phasing decisions and this study fulfils this void. The study utilized micro-simulation to identify potential conflicts at signalized intersections in order to provide a predictive model to enhance safety considerations when selecting left turn phasing options. The model can be used in a proactive manner instead of the time-consuming approach of historical crash data.
2. Literature review
The review of the state policies focusing on the safety criteria they use for left turn phase selection indicated that all use insufficient sight distance and 17 use high left turn crash rates (Hedges, 2014). However, there is no agreement on the number of crashes to be sued and this was varied from 4 crashes over a one-year period to 7 crashes over a three-year period. Historically, left turn studies have focused on utilizing safety indicators to develop these safety warrants (Agent, 1979; FL-ITE, 1982; Rouphail, 1986; McCoy & Malone, 1989; Lalani et al., 1986; Clark & Daniel, 1994; Agent, Stamatiadis & Dyer, 1995). Empirical analysis and surrogate analysis in conjunction with microsimulation have been utilized to evaluate crash histories.
Past researchers agree that, in general, protected left turn phasing is a safer option than permissive (Sheeeb, 1995; Al-Kaisy & Stewart, 1999; Chen et al., 2012; Gibby et al., 1992). However, Cottrell (1985) noted that at roads with speeds around 45 mph permitted/protected phasing does not affect safety.
Tarko et al. (2009) noted that the use of historical left turn crash data, can take time and it is difficult to assess the performance of each safety treatment pointing to the need to develop alternative methods that can be used to predict the intersection safety performance. The use of surrogate measures has been utilized recently to alleviate the time issues associated with crashes and traffic conflicts are considered the most promising metric ( (Gettman et al., 2003; Hyden, 1987; Tarko et al., 2009). Gettman et al. (2003) define a conflict as an observable event where two or more road users approach each other in time and space and they will collide if they will not change their movements. Conflict patterns have already been used in empirical analysis of crash data (Wang & Abdel-Aty, 2008) and their advantage is that there are many more than crashes (Saleem, 2012). Further, it has been shown that the proportion of conflicts that occur at an intersection is roughly the same to the proportion of collisions, meaning that the evaluation of conflicts is an appropriate substitute to examining only crashes (Sachi et al., 2013). Using these two facts, quantifiable modelling is possible with the help of microsimulation software.
Microsimulation can provide the platform for estimating conflicts from different scenarios but not all agree on this approach (Tarko & Songchitruksa, 2005; Saunier & Sayed, 2007). Typical reasons for this belief include the intrinsic approach of the simulation models that are based on the fundamental rules of crash avoidance, the reliance on input parameters and its effect on accuracy, and the relevancy of safety performance with verifiable crash experience (Shahdah et al., 2014). In other words, the idea of what is deemed safe may not be solely related to conflict or crash occurrence. On the other hand, there are several examples of studies, however, where the predictive capabilities of micro-simulation are accurate (Caliendo & Guida, 2012; Shahdah et al., 2014; Saleem, 2012) in comparison with the traditional empirical methods. AIMSUN or VISSIM were used in these studies in conjunction with the Surrogate Safety Assessment Model (SSAM) to identify, classify, and evaluate conflicts. In 2008, the Federal Highway Administration (FHWA) conducted a study to validate the use of SSAM when predicting traffic conflicts (FHWA, 2008). The results on peak-hour volumes indicate a correlation between SSAM-predicted total conflicts and field-observed total crashes with an R2 value of 0.41. The same analysis with the yearly average 24-hour traffic volumes correlated the predicted and field values with an R2value of 0.68. Based on these findings, FHWA recommends the use of micro-simulation research efforts with SSAM.
Caliendo and Guida (2012) demonstrated that there is a significant correlation between recorded crash data and simulated conflicts when they compared recorded crashes in the field to critical conflicts identified by micro-simulation software at signalized intersections. Shahdah et al. (2014) concluded that the simulated CMFs were consistent with the EB before-and-after study estimations produced by Srinivasan et al. (2012).
Past research has utilized total intersection flow as an explanatory variable (Srinivasan et al., 2008) or approach specific (Hauer et al., 1988) considering the left-turning volume and the opposing through volume (Upchurch, 1991). Research has used these traffic flows either as the cross product or as independent variables in multivariate models. Geometric variables have also been considered including the number of lanes entering and exiting, the angle of intersection, sight distance, and the presence and length of turning bays (Harwood et al., 2003; Srinivasan et al., 2008). Operational characteristics such as speed limits, delay, and complexity of the phases have also been suggested as explanatory (Bonneson & McCoy 1993, Stamatiadis et al., 1997, Poch & Mannering 1998). Kirk (2013) showed correlation between cycle length and effective green time percentage and simulated conflicts.
It is apparent that micro-simulation combined with surrogate safety measures can be utilized in developing safety prediction models. Conflicts are considered as the viable surrogate to crashes due to their frequency and relatability to crash events and current micro-simulation models can be used to determine their frequency. Number of opposing lanes and length of green times and cycles are the most common variables used in prediction models but the use of cross product or individual volumes is still debated.
3. Methodology
The micro-simulation used in this study is VISSIM, since it allows to coordinate the output vehicle trajectory file for each simulation with the FHWA Surrogate Safety Assessment Model package. In addition, the downstream left turning volumes and downstream opposing movements were used form the output to address the study objective of for assessing intersection safety surrounding the left turn movement during permissive phasing. Conflicts are identified with SSAM software by type utilizing the vehicle trajectories. The default SSAM values were used here, i.e., maximum time-to-collision of 1.5 seconds and maximum post-encroachment time of 5.0 seconds. SSAM
identifies conflicts by type according to the angle that the trajectories of two vehicles encounter each other. In this case, vehicles with conflicts at angles less than 30 degrees are considered Rear End conflicts, with angles greater than 85 degrees are considered Crossing conflicts, and all others are Lane Change conflicts.
The basic layout for the simulation was a four-leg signalized intersection with a single left turn exclusive lane to eliminate any safety related issues including intersection skew angles, poor sight distances, and multiple left turn lanes. Permissive left turn phasing is used for the left turning vehicles, since the goal of this research is to quantify conflicts attributed to the left turn movement. The variables and their ranges considered are summarized in Table 1 reflecting typical traffic conditions found at four-leg signalized intersections (Hedges 2014).
Table 1. Simulation input parameters.
Values
Variables
Opposing Volumes Opposing Lane Cycle Length Percentage Green Time Left Turn Capacity Percentage
Range 500-3,000 1 to 3 90-120 30-70 20-100
Increments 500 vehicles 1 lane 30 seconds 10 percent 20 percent
Finally, The Statistical Package for the Social Sciences (SPSS) developed by IBM is the software used to identify explanatory variables and develop statistical, predictive models (IBM 2009).
4. Results and analysis
The first step in the analysis was to identify those variables most promising to predict left turn Crossing conflicts (Table 2, Model 1). This was achieved through a stepwise linear regression followed by variable combinations to reflect the trends observed in the stepwise analysis (Models 2 and 3). The variables of concern include the following:
x Left Turn Volume (LTLDown)
x Opposing Volume (OppVolOut)
x Opposing Number of Lanes (OpposingLanes)
x Cycle Length (Cycle)
x Effective Green Time Percentage (%Green)
x Cross Product (XProdOut)
Table 2. Modelling results.
Model Variable Coefficient Significance R2
1 Constant -1.028 .000 0.372 %Green 0.856 .000 LTDown 0.000 .000 OppVolOut 0.000 .000 Opposing Lanes 0.443 .000 2 Constant -0.181 .000 0.400
(LTDown* OppVolOut * Opposing Lanes)/%Green 1.652E-6 .000
3 Constant 0.144 .001 0.514
(LTDown2
* OppVolOut * Opposing Lanes3
)/%Green1/3
4.457E-9 .000
It should be noted here that the left turn and opposing volumes were counted downstream of the approach in order to account for processed flow and not just the design demand values in the models developed. In many
scenarios, the entire input volume did not travel through the intersection due to capacity issues and therefore the downstream volumes are more accurate exposure measures.
In the initial stepwise approach, Model 1 in Table 2, all four variables were identified as significant predictors for the number of Crossing conflicts. Three of the four variables show expected relationships. Traffic volumes are expected to have a positive correlation with conflicts, since they are an exposure metric and increase volumes could result in an increased number of conflicts. Similarly, more opposing lanes could result in more Crossing conflicts, since the greater number of lanes that need to be traversed increases the risk for a crash with opposing traffic. The final variable, percent green time, shows an unexpected trend indicating that as the green time increases, the number of Crossing conflicts would also increase. This is not an expected result since the traditional belief is that as constant opposing volumes are given more green time, gaps allowing safe, permissive left turns would also increase and thus, reducing the number of Crossing conflicts. Based on the low adjusted R2value, the additive regression model does not have an adequate explanatory power. Therefore, a combination of variables was sought that could provide a higher predictive model power.
Model 2 represents the following variable created based on the positive/negative relationships (Eq. 1) provided from Model 1 and reconsidering the effect of green time:
ܺ௦௦= (ܮܶܦݓ݊ ×ܱܸ݈ܱݑݐ × ܱݏ݅݊݃ܮܽ݊݁ݏ)/(%ܩݎ݁݁݊) (1)
At this point, it was deemed appropriate to keep the left turn and opposing through volumes as independent variables instead of the cross product, since it was believed that there is a potential for specific contribution of each volume in the crossing conflicts (see next section for additional explanation). As also noted above, there is no agreement on this issue and thus the use of each variable was considered more appropriate. The explanatory power of the Model 2 is higher than the previous model, but may be improved by adjusting the individual powers of the root variables to reflect possible differences in their contribution to the conflict potential.
Through an iterative process, the powers of the individual root variables (Eq. 2) are adjusted withinܺ௦௦.
The result of several iterations yield the following variable:
ܺ௦௦= (ܮܶܦݓ݊ଶ ×ܱܸ݈ܱݑݐ × ܱݏ݅݊݃ܮܽ݊݁ݏଷ)/(%ܩݎ݁݁݊ଵ/ଷ) (2)
Model 3 supports the notion that each volume may have a different impact on the potential for a conflict since the left turning movements have more of an influence (higher power) than the opposing through movements when predicting Crossing conflicts.
5. Discussion
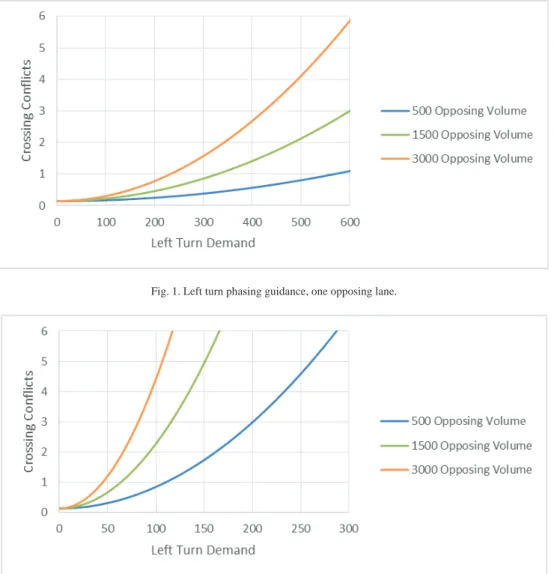
The study objective was to develop a predictive model to assist in left turn phase selection. To address this goal, Model 3 can be used to develop the point where a decision can be made as to whether protected or permissive only phasing can be implemented based on the anticipated safety levels, i.e., potential Crossing conflicts. Based on Model 3, a series of nomographs may be developed to assist in left turn phase selection representing the thresholds between permissive and protected phasing. Figures 1 and 2 are examples of such graphs and have been developed for general conditions for main street, i.e., effective green 60 percent, and for one and three opposing lanes, respectively.
Fig. 1. Left turn phasing guidance, one opposing lane.
Fig. 2. Left turn phasing guidance, three opposing lanes.
The lines in Figures 1 and 2 represent the point of transition from permissive to protected phase, i.e., to the left of the line a permissive phase is appropriate while to the right of the line a protected phase will be more appropriate. In this case, with give the traffic volumes, percent green and number of opposing lanes, a designer can determine which phase is more appropriate for the intersection. Figures 1 and 2 illustrate the differences between one and three opposing lanes. Both plots indicate that a higher number of left turns are possible at intersections with one opposing lane than in three opposing lanes when the same number of conflicts is considered. Graphs similar to these are easily derived for any effective green percentage or lane configuration using Model 3 (Eq. 3)
ܮ݂݁ݐܶݑݎ݊ܥݎݏݏ݅݊݃ܥ݂݈݊݅ܿݐݏ = 4.45ܧିଽ×ܺ
௦௦+ 0.144 (3)
where XCrossingis as defined in Equation 3.
An issue that merits attention and discussion here is the use of the traffic volumes as independent variables instead of their cross product. The reason for this is the need for differentiation between each of these volumes and their potential effects on completing the left turn movement and thus, implicitly, on safety. For example, an
intersection with 500 left turning vehicles and 1,000 opposing through vehicles has the same cross product as an intersection with 1,000 left turning vehicles and 500 opposing through vehicles. It is therefore reasonable to assume that each combination would have a different safety performance and this was captured in the Crossing conflict model developed here though the inclusion of the independent variables and their relative impact, i.e., left turn volume has a power of 2 in the model. The results indicate that left turning movements have a higher correlated relationship with Crossing conflicts than the opposing through movements. As an example, the data used here produced 15 scenarios with cross products of 350,000 to 400,000 vehicles resulting in 33 Crossing conflicts. Twenty of these conflicts were attributed to higher left turn movements in the cross product and only 13 were due to higher opposing volumes in the cross product. This same relationship is true for other cross product ranges. Therefore, the model developed captures this greater influence of left turn volumes with the higher power in the variable.
Model 3 can be used to develop the nomographs and predict left turn conflicts, but also one needs to recognize its limitations. First, the research only considered a single intersection geometry design (i.e. four-leg signalized with a single left turn lane). It is therefore recommended to use it only on similar layouts and application of the model to other deigns may reduce their reliability. Second, left turn capacity was derived from a microsimulation involving permissive left turns only. Application of such models to existing intersections with phasing schemes that already include a form of protection may be a questionable practice. Third, driver behaviour is always a concern when using microsimulation analysis because the software may not reflect reactive behaviour in real world situations. Finally, conflict prediction models prove to be correlated with historical crash data, but better surrogate metrics may exist and need to be investigated.
6. Conclusions
This study was set out to develop a predictive safety assessment model for left turn movements at signalized intersections. The literature review indicated that conflicts are an acceptable and reliable surrogate safety measure due to a number of cases studies where a correlated relationship with real crash data was documented. Moreover, the ease of analysis with micro-simulation software packages makes this option an appealing prospect, given the long time that one may have to wait for historical crash data to determine the safety effects of the option implemented.
MUTCD recommends the use of permissive, protected or permissive/protected phasing to control left turns. Many state DOTs have developed warrants, or guidelines, for selecting the left turn phasing type for an intersection but most of them are based on operational factors such as the cross product between left turn movements and opposing through volumes. A few DOTs have safety related warrants such as the left turn related crash history. The problem associated with the current warrants is that they are based on real world historical crash data. It is a reactive method that takes a considerable amount of time to complete such an analysis. Left turn crashes are typically rare events with small sample sizes. Thus, developing safety related warrants for left turn phasing could take a long time.
The model developed here with its accompanying nomographs provides an improvement over the existing methods and warrants and allows for a systematic and quick evaluation of the left turn phase to be selected. The model utilizes the most common variables that are already known during the design phase and can be used to determine whether a permissive or protected only phase will suit the intersection when considering safety performance. It should be pointed out that model in its current form is not capable to recommend the cases where a permissive/protected phase may be appropriate.
The findings of this study also point to some future research to improve understanding of the left turn phasing implications. The first recommendation is to develop better design criteria when conducting microsimulation analysis. This research uses theoretical values that are deemed “typical” for real world conditions. Based on the findings, the observed micro-simulation traffic conditions may be sometimes oversaturated, allowing for too few left turning movements and thus, less interactions between left turns and opposing through movements. Another recommendation is to further investigate the effectiveness of surrogate safety measures and more specifically, those used by SSAM. TTC and PET are utilized by SSAM, but as Wang (34) determined, these measures may not reflect actual driver behavior due to the difficulty of mimicking unpredictable human reaction with computer software. Furthermore, Kirk (2013) suggests in his research to adjust the default parameters SSAM uses for TTC and PET. Kirk uses 2.0 and 5.0 seconds, respectively, for these values. The default parameters for TTC and PET in SSAM
were not adjusted for the research proposed in this report. Finally, the use of historical crash data could be beneficial in validating the model developed here and increase its predictive power.
References
Al-Kaisy, A.F. and Stewart, J.A., 2001. “New Approach for Developing Warrants of Protected Left-Turn Phase at Signalized Intersections,” Transportation Research Part A: Policy and Practice, Vol. 35 (6), pp. 561-574.
Box, P. C., & Basha, P. E., 2003. A study of accidents with lead versus lag left-turn phasing. ITE Journal (Institute of Transportation Engineers), 73(5), 24-28.
Caliendo, C., and Guida, M, 2012. Microsimulation Approach for Predicting Crashes at Unsignalized Intersections Using Traffic Conflicts. Journal of Transportation Engineering, 138(12), pp. 1453-1467.
Chen, L., Chen, C., Ewing, R., McKnight, C. E., Srinivasan, R., and Roe, M., 2012. Safety countermeasures and crash reduction in New York City—Experience and lessons learned. Accident Analysis & Prevention.
Cottrell, B. H., 1985. “Guidelines for Exclusive/Permissive Left-Turn Signal Phasing,” Research Report VHTRC 85-R19, Virginia Highway & Transportation Research Council, Charlottesville, VA.
Federal Highway Administration. "MUTCD 2009 Edition with Revision Numbers 1 and 2 Incorporated, Dated May 2012 (PDF)." Retrieved from http://mutcd.fhwa.dot.gov/pdfs/2009r1r2/pdf_index.htm
Federal Highway Administration, 2009. Permissive/Protected Left-Turn Phasing Can Improve Safety at Signalized Intersections. Retrieved from http://safety.fhwa.dot.gov/intersection/resources/casestudies/fhwasa09015/pp_article.cfm
Federal Highway Administration, 2008. Surrogate Safety Assessment Model and Validation: Final Report. Retrieved from http://www.fhwa.dot.gov/publications/research/safety/08051/08051.pdf
Gettman, D., Pu, L., Sayed, T., & Shelby, S. G., 2008. Surrogate safety assessment model and validation: Final report (No. FHWA-HRT-08-051), Washington, D.C.
Gibby, A., Washington, S., and Ferrara, T., 1992. Evaluation of High-Speed Isolated Signalized Intersections in California (with Discussion and Closure). Transportation Research Record: Journal of the Transportation Research Board, 1376.
Harkey, D., Srinivasan, R., Baek, J., Council, F., Eceles, K., and Leften, N., 2008. Accident modification factors for traffic engineering and ITS improvements (NCHRP Report 617). Washington, DC: Transportation Research Board.
Harwood, D. W., Bauer, K. M., Potts, I. B., Torbic, D. J., Richard, K. R., Rabbani, E. R. K., & Griffith, M. S., 2003. Safety effectiveness of intersection left-and right-turn lanes. Transportation Research Record: Journal of the Transportation Research Board, 1840(1), pp. 131-139. Hauer E., Ng J., and Lovell J., 1988. Estimation of safety at signalized intersections, Transportation Research Record, 1185, Transportation
Research Board, National Research Council, Washington D. C., pp. 48-61.
Hauer, E., and Bamfo, J., 1997. Two tools for finding what function links the dependent variable to the explanatory variables. In Proceedings of the ICTCT 1997 Conference (pp. 05-05), November 1997.
Hedges, Adam J., 2014. "SIGNALIZED LEFT-TURN CAPACITY – MODEL ESTIMATION THROUGH MICRO-SIMULATION". University of Kentucky, Lexington, KY.
IBM. "SPSS Software."IBM. N.p., n.d. Web. Nov. 2014. Retrieved from http://www-01.ibm.com/software/analytics/spss/
Kirk, Adam J., 2013. "DEVELOPMENT OF A DESIGN BASED INTERSECTION SAFETY PERFORMANCE EVALUATION TOOL".Theses and Dissertations--Civil Engineering.Paper 17, University of Kentucky, Lexington, KY.
Lalani, N., Cronin, D., Hattan, D., and Scarls, T., 1986. A Summary of Warrants for the Installation of Left-Turn Phasing at Signalized Intersections. ITE Journal, 4, 57-59.
Miaou S. and Lum H., 1993. Modeling vehicle accident and highway geometric design relationships, Accidents Analysis and Prevention, Vol. 25, No. 6, pp. 689-709.
Milton, J., and Mannering, F., 1998. The relationship among highway geometrics, traffic-related elements and motor-vehicle accident frequencies. Transportation, 25(4), 395-413.
Mitra, S., and Washington, S., 2007. On the nature of over-dispersion in motor vehicle crash prediction models. Accident Analysis & Prevention, 39(3), 459-468.
Perfater, M., 1983. Motorists' Reaction to Exclusive-Permissive Left-Turn Signal Phasing. Transportation Research Record: Journal of the Transportation Research Board, 926, 7-12.
Poch, M., and Mannering, F., 1996. Negative binomial analysis of intersection-accident frequencies. Journal of Transportation Engineering, 122(2), 105-113.
Sachi, E., Sayed, T., and deLeur, P. A., 2013. Comparison of Collision-Based and Conflict-Based Safety Evaluations: The Case of Right Turn Smart Channels. Accident Analysis and Prevention: 59, pp. 260-266.
Saleem, T., 2012. Evaluation of the Predictive Capabilities of Simulated Peak Hour Conflict Based Crash Prediction Models. MASc Thesis, Ryerson University, Toronto, Canada.
Saunier, N., Sayed, T., 2007. Automated road safety analysis using video data. Transp. Res. Record: J. Transp. Res. Board 2019, 57–64. Sbayti, H. and Roden, D., 2010.Best Practices in the Use of Micro Simulation Models, NCHRP Project 8-36, Task 90, National Cooperative
Highway Research Program, Washington, DC.
Shahdah, U., Saccomanno, F. and Persaud, B., 2014. Integrated Traffic Conflict Model for Estimating Crash Modification Factors. Accident Analysis and Prevention Volume 71, pp. 228–235.
Shebeeb, B., 1995. Safety and efficiency for exclusive left-turn lanes at signalized intersections. ITE Journal (Institute of Transportation Engineers), 65(7), 52-59.
Srinivasan, R., Council, F., Lyon, C., Gross, F., Lefler, N., and Persaud, B., 2008. Safety effectiveness of selected treatments at urban signalized intersections. Transportation Research Record: Journal of the Transportation Research Board, 2056, 70-76.
Stamatiadis, N., Kirk, A., and Agarwal, N., 2012. “Improving Intersection Design Practices- Phase II,” Kentucky Transportation Research Center Report KTC-12-04, College of Engineering, University of Kentucky, Lexington, KY.
Tarko, A., Davis, G., Saunier, N., Sayed, T., and Washington, S., 2009. Surrogate measures of safety. White paper, ANB20 (3) Subcommittee on Surrogate Measures of Safety, Transportation research Board, Washington, D.C.
Tarko, A.P., Songchitruksa, P., 2005. Estimating the frequency of crashes as extreme traffic events. In: 84th Annual Meeting of the Transportation Research Board, Washington D.C.
Upchurch, J., 1991. Comparison of left-turn accident rates for different types of left-turn phasing. Transportation Research Record: Journal of the Transportation Research Board, 1324, 33-40.
Wang, Chen, 2012. "A NEW SIMULATION-BASED CONFLICT INDICATOR AS A SURROGATE MEASURE OF SAFETY". Theses and Dissertations--Civil Engineering.Paper 3 University of Kentucky, Lexington, KY.
Wang, X., and Abdel-Aty, M., 2008. Modeling left-turn crash occurrence at signalized intersections by conflicting patterns. Accident Analysis & Prevention, 40(1), 76-88.
Zhang, L., Prevedouros, P. D., and Li, H., 2008. Warrants for Protected Left-Turn Phasing. Paper presented at the 10th International Conference on Applications of Advanced Technologies in Transportation, ASCE, Athens, Greece.