Contents lists available atScienceDirect
Forest Ecology and Management
j o u r n a l h o m e p a g e :w w w . e l s e v i e r . c o m / l o c a t e / f o r e c oBiomass distribution among tropical tree species grown under
differing regional climates
Sara Bastien-Henri
a,∗, Andrew Park
b, Mark Ashton
c,d, Christian Messier
aaCentre d’étude de la Forêt, Département des sciences biologiques, Université du Québec à Montréal, CP 8888, Succursale Centre-Ville, Montréal (Québec), H3C 3P8 Canada bUniversity of Winnipeg, Centre for Forest Interdisciplinary Research, Department of Biology, 515 Portage Avenue, Winnipeg, MB, R3B 2E9 Canada
cYale University, School of Forestry and Environmental Studies, 195 Prospect Street, New Haven, CT 06511, USA
dNative Species Reforestation Project (PRORENA), Center for Tropical Forest Science, Smithsonian Tropical Research Institute, Unit 0948, APO, AA 34002, USA
a r t i c l e i n f o
Article history:
Received 15 February 2010
Received in revised form 22 April 2010 Accepted 28 April 2010 Keywords: Biomass distribution Size effect Aitchison transformation Site condition Panama Native tree species
a b s t r a c t
In the Neotropics, there is a growing interest in establishing plantations of native tree species for com-merce, local consumption, and to replant on abandoned agricultural lands. Although numerous trial plantations have been established, comparative information on the performance of native trees under different regional environments is generally lacking. In this study, we evaluated the accumulation and partitioning of above-ground biomass in 16 native and two exotic tree species growing in replicated species selection trials in Panama under humid and dry regional environments. Seven of the 18 species accumulated greater total biomass at the humid site than at the dry site over a two-year period. Species-specific biomass partitioning among leaves, branches and trunks was observed. However, a wide range of total biomass found among species (from 1.06 kg forDipteryx panamensisto 29.84 kg forAcacia mangium
at Soberania) justified the used of an Aitchison log ratio transformation to adjust for size. When biomass partitioning was adjusted for size, a majority of these differences proved to be a result of the ability of the tree to support biomass components rather than the result of differences in the regional environments at the two sites. These findings were confirmed by comparative ANCOVAs on Aitchison-transformed and non-Aitchison-transformed variables. In these comparisons, basal diameter, height and diameter at breast height were robust predictors of biomass for the pooled data from both sites, but Aitchison-transformed variables had little predictive power.
© 2010 Elsevier B.V. All rights reserved.
1. Introduction
Until relatively recently, reforestation in the Neotropics mostly employed exotic species such as teak (Tectona grandisLf.),Acacia
sp. orEucalyptussp. Exotic monocultures are thought to provide fewer ecological services relative to native forest (Stier and Siebert, 2002; Craven et al., 2007), and their establishment has even been cited as a driver of deforestation (Butler and Laurance, 2008).
In recent decades, land managers and development organiza-tions in Neotropical countries have become interested in using native tree species in reforestation. Native species are now being planted for commercial (timber and carbon sequestration) pur-poses, to provide ecological services, and to serve social interests (Lugo, 1997; Carpenter et al., 2004). There is a growing body of information on the growth and survival of some native Neotropi-cal species (Lugo, 1997; Stier and Siebert, 2002; Piotto et al., 2004). Nevertheless, there are still relatively few data on biomass parti-tioning and habitat preferences for most Neotropical trees. Most
∗Corresponding author. Tel.: +1 514 987 3000x5048; fax: +1 514 987 4647. E-mail address:[email protected](S. Bastien-Henri).
native species plantations have been established on single sites (King, 1991; Menalled and Kelty, 2001; Petit and Montagnini, 2006), which makes it difficult to generalize their growth potential to a variety of sites and regional climates.
Tropical tree species have developed physiological, morpho-logical and phenomorpho-logical plasticity in the face of uncertain water availability. Photosynthesis, intrinsic water use efficiency, dark res-piration, and foliar C:N ratios all vary among species and among sites with different rainfall regimes (Mulkey and Wright, 1996; Craven et al., 2007). Precipitation may be the most important cli-matic variable affecting tree growth in the seasonal tropics. Variable precipitation assumes particular importance in areas such as Cen-tral America, where the pronounced dry seasons can last up to eight months. Species distribution (Condit, 1998; Santiago et al., 2004; Santiago and Mulkey, 2005; Engelbrecht et al., 2007) and productivity (Austin and Vitousek, 1998; Coyle and Coleman, 2005) are closely related to rainfall patterns and water availability. Lit-ter quantity and quality, which indirectly affect plant community composition and productivity, are modified by rainfall (Santiago and Mulkey, 2005). Direct nutrient availability to plants may also be affected by the amount of precipitation (Santiago et al., 2004; Coyle and Coleman, 2005).
0378-1127/$ – see front matter © 2010 Elsevier B.V. All rights reserved. doi:10.1016/j.foreco.2010.04.035
Trees also display year to year phenotypic plasticity (Coomes and Grubb, 1998; King, 2003; Delagrange et al., 2004; Balandier et al., 2007) in response to seasonal environmental signals, leading to variations in the proportions of biomass allocated to different plant tissues (Coleman et al., 1994). These intraspecific variations allow plants to maximize their functional fitness in response to a changing environment (Coleman et al., 1994; McConnaughay and Coleman, 1999; Lewis and Tanner, 2000). As trees grow, biomass accumulation and partitioning will therefore vary under differ-ent site conditions (Ketterings et al., 2001; Zianis and Mencuccini, 2004; Heras et al., 2007). For this reason, the effect of tree size on allometry should be clearly separated from that of the environ-ment, especially when biomass is being compared at different sites among diverse species with highly variable growth patterns.
Site differences are likely to affect the allocation of biomass to leaf, stem and root components that are valued for commer-cial or subsistence purposes by landowners who plant trees. Diffe-rential allocation will also feed back to growth by affecting overall rates of photosynthesis and the ability of plants to absorb sufficient water and mineral nutrients. Our knowledge of biomass accu-mulation and partitioning under different regional climates must therefore be greatly improved (i) to fine-tune species selection cri-teria for plantations and agroforestry, and (ii) as a step towards understanding differential growth and survival of multiple species. Comparative studies performed along gradients of site conditions, or in different regional climates are particularly needed (Condit, 1998; Santiago and Mulkey, 2005; Craven et al., 2007; Wishnie et al., 2007).
In this paper, we compare the biomass production and parti-tioning among 16 Neotropical (hereafter “native”) and two Old World (“exotic”) tree species after two years in plantation. Our primary objectives were (1) to perform intraspecific comparisons of biomass accumulation in species growing on two sites with different regional climates and soils, (2) to compare intraspecific allometric differences among sites after adjusting for species-specific differences in size, and (3) to test the ability of simple biometric variables (such as basal diameter) to predict biomass in a multi-species data set.
2. Methods
2.1. Study sites and species selection
Our research sites were located in two large species selection trials established by PRORENA, the native species reforestation project of the Smithsonian Tropical Research Institute and Yale
School of Forestry and Environmental Studies (PRORENA, 2005). These sites are representative of regional climatic and edaphic extremes that occur across the Isthmus of Panama. Soberania National Park (hereafter “Soberania”) received an average of 2226 mm annual rainfall between 1966 and 2003, with a 4.1-month dry season during which <100 mm of rain fell every month. With a 6.7-month dry season and an average annual rainfall of 1107 mm, Río Hato is part of the driest region of Panama along the Pacific coast in Coclé Province (Wishnie et al., 2007). Soberania is characterized by rolling hills punctuated by moist depressions while Río Hato has flat or gently sloping terrain. Soils at Soberania are primarily clays and silty clay loams, and soil texture at Río Hato ranges from loamy sand to heavy clay (Andrew Park, personal observation). The soils at Río Hato were less fertile than those of Soberania, with consider-ably lower cation exchange capacities and concentrations of N, K, Mg and P (Craven et al., 2007).
In 2003, 16 native and two exotic tree species (Table 1) were planted at both sites in monoculture plots of 20 trees (initial spac-ing of 3 m×3 m) with nine replicates per site (Wishnie et al., 2007). Trees were 2–8-month old when planted, this variation depen-ding on the time needed for the container-germinated seedlings to be ready for planting. On the day of planting and again two months later, 115 g/plant of granular fertilizer (12-72-12 N-P-K) was applied at each planting spot. Competing vegetation was cut with machetes on a regular basis at least three times every year (Wishnie et al., 2007.). Species were chosen for their forest restora-tion potential, timber value, and silvopastoral use (Table 1) (see Wishnie et al., 2007for further details). After two years of growth in plantation, when some plots had achieved crown closure, all plots were thinned to 50% of their original density by cutting alternate stems in every row.
The planned thinning gave us the opportunity to compare the above-ground partitioning of biomass among species. Between July and September 2005, six two-year old trees per species were selected for biomass measurement from each of the two sites. Sam-ple trees were selected using a stratified random samSam-ple of stems from the 1 to 33rd, 34th to 66th, and 67th to 100th percentiles of the basal diameter distributions for each species based on previous measurement.
2.2. Data collection
2.2.1. Pre-harvest biometrics
Prior to cutting the trees, a complete set of crown and stem mea-surements were taken. These included basal diameter at 5 cm above the soil surface (BD), diameter at the base of the crown below the Table 1
Scientific name, family, common name, wood density and main uses of the 18 tropical tree species studied (adapted fromWishnie et al., 2007).
Scientific name Family Common name Species code Uses
Acacia mangiumWilld. Fabaceae Acacia AM Exotic: restoration, timber
Albizia adinocephala(Donn. Sm.) Britton & Rose Fabaceae Frijolillo AA Restoration
Albizia guachapele(Kunth) Dugand Fabaceae Guachapalí AG Fodder, timber
Cedrela odorataL. Meliaceae Cedro CO High value timber
Colubrina glandulosaPerkins Rhamnaceae Carbonero CG Timber, fuel wood
Diphysa robinioidesBenth. Fabaceae Macano DR Fencing, fuel wood
Dipteryx panamensis(Pittier) Record & Mell Fabaceae Almendro de monta ˜na DP Timber
Enterolobium cyclocarpum(Jacq.) Griseb. Fabaceae Corotú EC Timber, fodder
Erythrina fuscaLour. Fabaceae Palo bobo, Palo santo EF Restoration
Gliricidia sepium(Jacq.) Kunth ex Walp. Fabaceae Balo GS Live fencing, fodder
Guazuma ulmifoliaLamk. Sterculiaceae Guácino GU Fodder, fuel wood
Inga punctataWilld. Fabaceae Guabita cansaboca IP Fruit, restoration
Ochroma pyramidale(Cav. Ex Lam.) Urb. Bombacaceae Balsa OP Restoration
Pachira quinata(Jacq.) W.S. Alverson Bombacaceae Cedro espino PQ Timber
Samanea saman(Jacq.) Merr. Fabaceae Guachapalí SS Fodder, timber
Tabebuia roseaDC. Bigniniaceae Roble TR Timber
Tectona grandisL. Verbenaceae Teck TG Exotic: high value timber
first live branch, diameter at breast height (DBH, taken on trees
whose main stem was≥1.3 m tall), total height (from the ground to
the highest leaf or leaflet, H), height of the lowest leaf or leaflet, the length of the live crown (CL, taken from the lowest live branch to the tallest leaf), and crown diameter (CD, mean of two perpendicular measures).
2.2.2. Tree harvest
The biomass measurements were based on the biomass
sub-sampling method outlined bySnowdon et al. (2002), which was
adapted, where necessary, to the crown morphologies of our sub-ject species. We first determined fresh weights of main stems, branches and leaves in the field immediately after cutting. These components were weighed on a hanging spring-loaded balance with an accuracy of±25 g. An electronic top-loading balance with an accuracy of±0.01 g was preferred for tissue fractions weighing <500 g.
As leaves may differ in area and thickness according to their canopy location, the crown was separated into three parts (bot-tom, middle and top) to sample the full range of leaf properties (Snowdon et al., 2002). The smallest trees, which were 1.5 m or less in height, and those whose canopies grew as single layers near the apex of the trunk were either not divided or were separated into two parts only. Once removed from the stem, branches were pooled by section (bottom, middle and top of the crown) and weighed. Main stems were weighed separately.
To effectively manage the large amounts of leaves and wood produced by the harvesting, subsamples of each tissue type were taken to calculate wet to dry mass conversion factors (Snowdon et al., 2002). For tree crowns, it was important to choose samples that were representative of the proportion of leaves and branches for the section sampled. Following the recommendations ofSnowdon et al. (2002), samples were chosen visually to represent branches from each crown section that were characteristic in terms of the concen-tration of leaves around branches, numbers of branches and twigs, and the dimensions of the main branch. Leaves were removed from the sampled branches and the wet weight of each component of the sample (leaves and branches) was determined separately.
For monopodial trees, the trunk was defined as the whole length of the stem from soil level to the highest point (including the leader) after removal of the branches. The trunk of monopodial trees was separated into three parts of equal length, and weighed before taking cross-sectional samples to determine oven-dry weight. When a tree had two or more major branches sprouting from the base or close to the base, it was considered a multistemmed tree. In these cases, principal stems could not generally be defined, and all branches identified as “multistem” were weighed together.
Stem subsamples consisted of two cross-sections (cookies) of 3 cm in width that were cut on each side of the center of mass of each stem section to compensate for variations in stem form and wood density. These cookies were weighed immediately after cutting and before drying. Multistem subsamples consisted of two portions of approximately 20 cm from each major stem (one from the upper and one from the lower part of the branch). When large numbers of stems were present in multiple stemmed trees (e.g.Diphysa robinoides), we selected a representative subsample of stems based on their length, diameter, and their total number. Two portions of approximately 20 cm from each selected multi-stem were taken and processed in the same way as monopodial stem cookies.
No field work was done during or immediately after rain to avoid biasing the fresh weight determinations due to tissue wetting. Tis-sues were processed immediately after being cut to avoid drying of the fresh material (Snowdon et al., 2002). After transport from the field site, samples were initially placed in a low humidity storage room to avoid decomposition or the growth of mould. They were
then dried to constant weight at 65◦C in an industrial wood drying kiln and weighed.
After drying, subsamples were weighed with the electronic ba-lance. Dry to wet mass conversion factors were calculated, and used to extrapolate from wet to dry weights of each tree compartment. From the dry weight/fresh weight ratio of each stem, branch and leaf sample, a proportion was calculated to determine dry biomass of the compartment from the fresh weight using the following for-mula:
DWc=
DWsFWs
×FWc (1)
whereDWc= dry weight of a section of a compartment,FWc= fresh
weight of the same section,DWs= dry weight of the subsample and
FWs= fresh weight of the same subsample (Snowdon et al., 2002).
Section biomasses calculated using Eq.(1)were summed to obtain estimates of the total dry biomass of leaves, branches and trunk for the whole plant.
2.3. Statistical analysis
Based on previous work and experience (e.g. Wishnie et al., 2007), we expected to observe obvious interspecific differences in biomass accumulation in our diverse species pool. We there-fore focussed our analysis on intraspecific differences in biomass partitioning between Río Hato (dry regional climate) and Sobera-nia (humid regional climate). We used non-parametric Wilcoxon rank sum tests to analyze intraspecific differences in total biomass between sites. Wilcoxon rank sum tests were also used to ana-lyze site differences in biomass partitioning to leaves, branches and stems. Because some species were represented by relatively low sample sizes at Río Hato, we chose an alpha level of 0.1 as the critical Type I error rate against which to measure statistical significance.
We predicted that the partitioning of biomass to different plant tissues would change with overall plant size to meet physical and mechanical constraints. Size effects on biomass partitioning should therefore be removed from the data if we are to fully understand the effects of environment on the distribution of tissues within a plant. We therefore transformed raw biomass and mensuration data using an Aitchison log ratio transformation (Aitchison, 1986) to control for the effect of tree size on relative biomass partitioning (Eq.(1)): yij=log xij−1p p
i logxij (2)where yij is the adjusted value of thejth trait in theith
indivi-dual,pis the number of characters included in the analysis, and
xij is the unadjusted value of trait jin theith individual
(Peres-Neto and Magnan, 2004). An Aitchison-transformed variable is therefore standardized with respect to the average value of all (log-transformed) measurements or traits under consideration. The Aitchison transformation has the statistical advantage of main-taining the independence of individual variables while using a composite of several related variables to develop a global measure of size (Peres-Neto and Magnan, 2004).
We performed separate Aitchison transformations on above-ground biomass components: leaves, branches and trunks, and on mensuration data: DBH, BD, H, CL, and CD. Intraspecific differences in Aitchison-transformed biomass components were investigated using Wilcoxon rank sum tests, as described earlier. The transformed mensuration variables were tested against their non-Aitchison-transformed equivalents for their ability to act as simple predictors of total biomass on pooled species data from the two sites. Basal diameter and height were used as simple predictor
variables. Diameter at breast height (DBH) was also used as a pre-dictor for those trees that were taller than 1.5 m. We also tested two ratio variables – the diameter: height ratio and the live crown (crown length:crown height) ratio (LCR) for their predictive power. Raw diameter height ratios and LCRs were arcsin square root trans-formed. Aitchison-transformed ratio variables were constructed by deducting one from the other because subtraction on logarithms is equivalent to division.
We used exploratory analyses of covariance (ANCOVA) to deter-mine whether each mensuration variable had a similar predictive relationship with biomass at the two sites. In the event that the site by covariate interaction term was significant, we used sepa-rate regressions with comparisons of slopes (Zar, 1996) to probe the relationship of mensuration variables to total biomass. As sample size was relatively higher for regression analyses made on pooled species, an alpha of 0.05 was appropriate.
3. Results
3.1. Biomass accumulation and partitioning among species and sites
Overall, trees at Río Hato achieved only 60.8±48.9 percent of the biomass of those growing at Soberania. Seven of the 18 species had significantly greater total biomass at Soberania (Wilcoxon rank sum rest,P≤0.1). These species:Colubrina glandulosa,Diphysa robi-noides,Dipteryx panamensis,Erythrina fusca,Ochroma pyramidale,
Tabebuia rosea, andTerminalia amazonia, had greater total biomass at Soberania than at Río Hato (Fig. 1). Only three species:Albizia guachapele, Enterolobium cyclocarpum, and Samanea saman had greater average biomass at Río Hato than at Soberania, but these differences were not statistically significant.
Eight species displayed significant differences in at least one of stem, branch, or leaf biomass, and in five species, differences were observed in the biomass of all three compartments (Wilcoxon
Fig. 1.Comparison of total dry biomass of 18 tree species at Río Hato (black bars) versus Soberania (grey bars). Error bars represent standard deviations of the mean. The numbers above selected error bars are Type I error probabilities returned by Wilcoxon rank sum tests. Species acronyms are as described inTable 1.
rank sum test,P≤0.1;Fig. 2).C. glandulosa,E. fusca,O. pyramidale,
T. rosea, andT. amazoniahad significantly greater biomass in all three compartments at Soberania.Gliricidia sepiumdisplayed sig-nificant difference in stem biomass alone, whileD. robinoidesand
D. panamensishad greater stem and leaf biomass at Soberania.
3.2. Effects of size on biomass partitioning
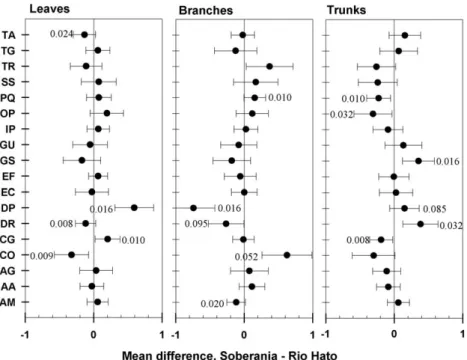
Intraspecific comparisons of Atichison-transformed biomass demonstrated differing levels of relative investment into tissue compartments at Soberania versus Río Hato. Unlike the untrans-formed biomass compartments, relative investment in different tissues was sometimes significantly greater at Río Hato than at Soberania (Wilcoxon rank sum tests,P≤0.1;Fig. 3). For example,C. glandulosainvested relatively more resources in leaves at Sobera-nia, but fewer resources in trunks andD. robinoidesinvested more resources into leaves and branches at Río Hato, but fewer resources in trunks.
Fig. 2.Comparison of raw biomass allocation to trunks (black), branches (hatched) and leaves (clear) among 18 tree species between (a) Soberania and (b) Rio Hato. Significance figures for Wilcoxon rank sum tests follow the same ascending order as the bar plots for tissues. Species acronyms are as described inTable 1.
Fig. 3.Mean differences in Aitchison-transformed tissue biomasses for leaves, branches, and trunks. Dark circles are the differences between treatment means (Soberania minus Río Hato), and error bars represent standard errors of the difference between means. Significance figures for each species and tissue tested for intraspecific differences between sites using Wilcoxon rank sum tests. Species acronyms are as described inTable 1.
Although 11 of the differences in untransformed biomass par-titioning were eliminated by the Aitchison transformation, seven new differences were recorded (seeFigs. 2 and 3). Thus, bothD. robinoidesand D. panamensis, species with very different crown architectures, invested relatively more resources in branches at Río Hato than at Soberania.Acacia mangiumandCedrela odorata, neither of which had significant differences in absolute biomass partitioning between sites, invested relatively more in branches at Río Hato (A. mangium), and in leaves at Río Hato and branches at Soberania (C. odorata). Similarly,T. amazonia, another tree with no site differences in absolute biomass, invested relatively more biomass in leaves at Río Hato compared to Soberania.
3.3. Predicting biomass from biometric traits
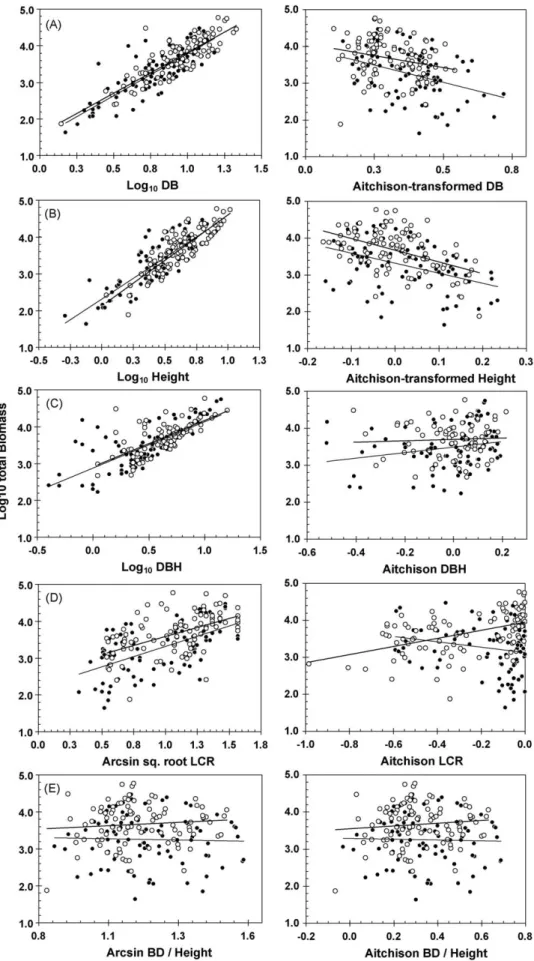
The slopes of biometric trait – log10-transformed total biomass
relationships were parallel for both Aitchison-transformed and non-Aitchison-transformed variables (site by covariate interac-tion,P> 0.05 in every case). Subsequent ANCOVAs conformed to the assumptions of parametric analyses (Levene’s test for equa-lity of error variance, P> 0.05, residuals normally distributed). All of the simple biometric variables, except for arcsine square root-transformed BD:height ratio, had significant positive rela-tionships with log10 transformed total tree biomass (F-test,
P≤0.05;Fig. 4a–e, andSupplemental Tables S1 and S2). Aitchison-transformed BD and height were also significantly related to biomass, but had negative slope coefficients (Fig. 4a and b; Table S2), indicating a greater investment in diameter and height growth (relative to other mensurational traits) among small trees at both sites.
Log10-transformed basal diameter was the most robust
predic-tor of total tree biomass, followed by height and DBH. There was no effect of site for either BD or DBH, which indicated congruence of the regression slopes. Slope coefficients on pooled data from both sites were highly significant for these variables (BD:F1, 178= 478.3,
P≤0.001, R2= 0.73; DBH: F
1,161= 177.04, P≤0.001, R2= 0.52). A
significant site effect was present in ANCOVAs that included log10
-transformed height, and Aitchison--transformed BD and height
(Fig. 4a and b). Log10-transformed height was a relatively strong predictor of biomass at both Río Hato (F1, 83= 176.7, P≤0.001,
R2= 0.68) and Soberania (F
1, 94= 238.2, P≤0.001, R2= 0.72). In
the case of Aitchison-transformed BD and height, the slopes of the covariate-biomass relationship were negative. Therefore, after subtracting the effect of size, increased relative investment in BD or height growth was associated with lower total tree biomass.
Variables other than BD and height were relatively weak predic-tors of total biomass. Regressions of Aitchison-transformed DBH and BD:height ratio versus biomass were non-significant, and returnedR2 values of less than 0.02 at both sites (Fig. 4c and e).
Non-significant regressions were also recorded for arcsine square root-transformed BD:height ratio versus biomass (Fig. 4e). This variable therefore had no detectable relationship with biomass across a range of species either as a function of size or as a function of relative resource partitioning. Finally, regressions of Aitchison-transformed LCR versus biomass returned slopes with opposite signs for Río Hato (y= 3.13–0.71×LCR,) and Sobera-nia (y= 3.95 + 1.091×LCR), although the slope coefficient for Río Hato was not significant (P= 0.074). The equivalent relationship of biomass with arcsine square root-transformed LCR was positive at both sites (Río Hato:F1, 83= 42.42,P≤0.001,R2= 34; Soberania:F1, 94= 37.53,P≤0.001,R2= 0.29;Fig. 4d).
4. Discussion
4.1. Biomass partitioning
The large differences in total biomass that were observed in this study can be attributed to the divergent regional climates and local characteristics of the sites where the trees were grown (Fig. 1). Factors that could have limited tree growth at Río Hato versus Soberania include an appreciably longer dry season (6.7 months at Río Hato versus 4.1 months at Soberania), rainless periods of up to three weeks at Río Hato during the rainy season (A. Park, per-sonal observation), and localized areas of degraded soils. The long dry season may have affected photosynthetic activity by increasing
Fig. 4.Comparison of relationships of simple mensuration variables (left hand graphs) with Aitchison-transformed mensuration variables (right hand graphs) at Río Hato (black circles, thin trend lines) and Soberania (open circles, bold trend lines). (A) Basal diameter, (B) Height, (C) DBH, (D) LCR, and (E) basal diameter: height ratio. Results of linear regression analyses are summarized inSupplemental Table S2. Note that not all tree species had a DBH value.
the duration of the leafless period for deciduous trees at Río Hato (Coyle and Coleman, 2005). Trees exposed to rainless peri-ods within the rainy season may also shut down photosynthesis to conserve water, and may even shed their leaves during these dry spells (Damour et al., 2008). Soils at Río Hato displayed localized evidence of sheet erosion, including patches of plinthite at the sur-face, erosion pedestals and gullying (A. Park, personal observation) that may have restricted water and nutrient availability and root growth.
Relatively few intraspecific differences in the relative partition-ing of biomass were observed between sites (Fig. 3), and species were as likely to favour greater partitioning of biomass to crown versus stem at Río Hato as at Soberania. In the absence of detailed physiological measurements, explanations for preferential relative partitioning to one compartment or another are necessarily spe-culative. For example,D. robinoides, a leguminous tree that sprouts multiple stems from close to ground level, may have experienced a relative advantage in nitrogen assimilation from the relatively N-poor soils of Río Hato. In other cases, differences in relative biomass partitioning between sites may have been the result of specific autecological factors or singular events.D. panamensis, for exam-ple, was often observed to be leafless at Río Hato, and may have had poor tolerance for extended dry periods. However, the rela-tively greater investment in branches by this species in Río Hato indicated, nevertheless, that the “scaffolding” for photosynthesis was well-developed.
Competition within and between plots is another factor that may have affected relative biomass partitioning. Competition may have been especially important at Soberania, where a number of tree species, includingA. mangium,D. robinoidesandG. sepiumhad achieved crown closure by their second year of growth. Under these conditions, relatively greater investment in trunks forD. robinoides
andG. sepiummay have been a result of the struggle for adequate light. For the majority of trees, however, we could not conclude that regional environment affected significantly either total biomass, or the relative partitioning of biomass to different tissues. Addition-ally, relatively small sample sizes for each species that included unequal representation at the two sites may have inflated the Type II error rates of our analyses.
4.2. Biometric traits as predictors of total tree biomass
Basal diameter and height were robust predictors of total biomass for the pooled site data of 18 species. This finding confirms that simple variables that are cheap to measure in the field can be used to predict the total biomass of a disparate collection of species in diverse regional environments. The association of Aitchison-transformed DB and height with lower total biomass (right hand panels ofFig. 4a and b) supports the existence of a strong onto-genetic size effect for these variables. Indeed, it appears that the greatest investment in both DB and height relative to other linear and ratio dimensions occurred among species with smaller total biomass at both sites. Given that basal area increases in proportion to diameter squared, we can speculate that smaller trees require relatively more structural support for their frequently top-heavy crowns.
The weak relationships of LCR and BD:height ratio with biomass in our study are not well reflected in the traits literature. Live crown ratio is reported to be a good indicator of both tree relative growth rate (York et al., 2006) and vigour (Ruel et al., 2000), and posi-tive relationships between LCR and tree growth rates have been reported (Scowcroft et al., 2007). It should be noted, however, that much of many detailed analyses of biomass variation with crown traits refer to coniferous trees, in which there is much less variation in crown form than among our heterogeneous collection of tropical hardwoods.
The biomass literature strongly supports the use of diameter to predict biomass. The diameter-biomass relationship is usually expressed as a power function, which is linearized by transforming both biomass and diameter using natural logarithms (Ketterings et al., 2001; Zianis and Mencuccini, 2004). The coefficient of deter-mination in the log10BD – log10biomass relationship for multiple
tree species in our study (0.73) was somewhat lower than reported in a meta-analysis of 13 other studies (∼0.95 to 0.99,Zianis and Mencuccini, 2004). The majority of biomass studies have, however, gathered data from only one site (Ketterings et al., 2001), or have been developed separately for each species being analyzed (Saha et al., 2004). Managers in the tropics may not have the luxury of developing species-specific allometric equations for mixed species restoration projects, and therefore, may need to sacrifice a degree of precision to achieve generality. Adding height as a second variable in the allometric equation may add relatively little to the proportion of variance explained, since height and diameter are themselves closely correlated (Ketterings et al., 2001). The addition of height to diameter in the model for our data added only 10% to the original coefficient of determination.
5. Conclusion
The Republic of Panama harbours a number of distinct regional environments in a small geographical space. Significant diffe-rences in total biomass and in biomass partitioning to different tis-sues were recorded in approximately one third of the tree species sampled in two sites representing dry and humid regional envi-ronments. In spite of these differences, basal diameter (BD) and height had similar relationships to biomass at both sites, which allowed common regression models to be constructed. Simple mea-surement, BD or height, can be reasonably successful at predicting biomass in a range of species. Thus a relatively simple metric might be used (at least for 1–3-year-old trees) as a robust predictor of biomass and potentially carbon storage in the tree species that were used. These relationships were largely ontogenetic effects of tree size, and similar regressions of BD and height versus biomass illustrated that relative investment into these variables declined as trees became larger. Relative partitioning of biomass to leaves, branches or trunks also varied between sites, but these differences did not consistently favour greater relative investment at one site or another, which indicates that individual autecological explanations need to be sought for the patterns observed. Future measurements on more mature trees would determine if the effects of site and species would change over time.
Acknowledgements
We are grateful to the management and technical staff of PRORENA for their invaluable assistance in the field, including Norma Cede ˜no and her team, Emilio Mariscal and his team and José Deago. We also want to thank Mark Wishnie and Daisy Dent for scientific advices at the time of field planning. Statisti-cal advices provide by Stéphane Daigle from Centre d’étude de la Fôret (Québec, Canada) were greatly appreciated. We are also grateful to Ing. Jaime Orozco of Materiales Orozco y Puertas Orozco in Chepo, Republic of Panama for the use of an industrial oven to dry our samples. The PRORENA project is jointly managed by the Smithsonian Tropical Research Institute in Panama and the Tropical Resources Institute at Yale University, and financed by The Frank Levinson Family Foundation at the Peninsula Community Foun-dation, the Grantham Foundation and the School of Forestry and Environmental Studies, Yale University. Funding to Sara Bastien-Henri was provided by NSERC discovery grant to C. Messier and a University of Winnipeg startup grant to A. Park.
Appendix A. Supplementary data
Supplementary data associated with this article can be found, in the online version, atdoi:10.1016/j.foreco.2010.04.035.
References
Aitchison, J., 1986. The Statistical Analysis of Compositional Data. Champan and Hall, New York.
Austin, A.T., Vitousek, P.M., 1998. Nutrient dynamics on a precipitation gradient in Hawai’i. Oecologia 113, 519–529.
Balandier, P., Sinoquet, H., Frak, E., Giuliani, R., Vandame, M., Descamps, S., Coll, L., Adam, B., Prevost, B., Curti, T., 2007. Six-year time course of light-use efficiency, carbon gain and growth of beech saplings (Fagus sylvatica) planted under a Scots pine (Pinus sylvestris) shelterwood. Tree Physiology 27, 1073–1082.
Butler, R.A., Laurance, W.F., 2008. New strategies for conserving tropical forests. Trends in Ecology and Evolution 23, 469–472.
Carpenter, F.L., Nichols, J.D., Pratt, R.T., Young, K.C., 2004. Methods of facilitating reforestation of tropical degraded land with the native timber treeTerminalia amazonia. Forest Ecology and Management 202, 281–291.
Coleman, J.S., McConnaughay, K.D.M., Ackerly, D.D., 1994. Interpreting phenotypic variation in plants. Trends in Ecology and Evolution 9, 187–191.
Condit, R., 1998. Ecological implications of changes in drought patterns: shifts in forest composition in Panama. Climatic Change 39, 413–427.
Coomes, D.A., Grubb, P.J., 1998. A comparison of 12 tree species of Amazonian caatinga using growth rates in gaps and understory, and allometric relationships. Functional Ecology 12, 426–435.
Coyle, D.R., Coleman, M.D., 2005. Forest production responses to irrigation and fertil-ization are not explained by shifts in allocation. Forest Ecology and Management 208, 137–152.
Craven, D., Braden, D., Ashton, M.S., Berlyn, G.P., Wishnie, M.H., Dent, D.H., 2007. Between and within-site comparisons of structural and physiological charac-teristics and foliar nutrient content of 14 tree species at a wet, fertile site and a dry, infertile site in Panama. Forest Ecology and Management 238, 335– 346.
Damour, G., Vandame, M., Urban, L., 2008. Long-term drought modifies the fun-damental relationships between light exposure, leaf nitrogen content and photosynthetic capacity in leaves of the lychee tree (Litchi chinensis). Journal of Plant Physiology 165, 1370–1378.
Delagrange, S, Messier, C., Lechowicz, M.J., Dizengremel, P., 2004. Physiological, mor-phological and allocational plasticity in understory deciduous trees: importance of plant size and light availability. Tree Physiology 24, 775–784.
Heras, J.D., Moya, D., López-Serrano, F., Condes, S., 2007. Reproduction of postfire
Pinus halepensisMill. stands six years after silvicultural treatments. Annals of Forest Science 64, 59–66.
Engelbrecht, B.M.J., Comita, L.S., Condit, R., Kursar, T.A., Tyree, M.T., Turner, B.L., Hubbell, S.P., 2007. Drought sensitivity shapes species distribution patterns in tropical forests. Nature 447, 80–82.
Ketterings, Q.M., Coe, R., Noordwijk, M.v., Ambagau, Y., Palm, C.A., 2001. Reduc-ing uncertainty in the use of allometric biomass equations for predictReduc-ing above-ground tree biomass in mixed secondary forests. Forest Ecology and Man-agement 146, 199–209.
King, D.A., 1991. Correlations between biomass allocation, relative growth rate and light environment in tropical forest saplings. Functional Ecology 5, 485–492.
King, D.A., 2003. Allocation of above-ground growth is related to light in temperate deciduous sapling. Functional Ecology 17, 482–488.
Lewis, S.L., Tanner, E.V.J., 2000. Effects of above- and belowground competition on growth and survival of rain forest tree seedlings. Ecology 81, 2525–2538. Lugo, A.E., 1997. The apparent paradox of reestablishing species richness on
degraded lands with tree monocultures. Forest Ecology and Management 99, 9–19.
McConnaughay, K.D.M., Coleman, J.S., 1999. Biomass allocation in plants: ontogeny or optimality? A test along three resources gradients. Ecology 80, 2581–2593. Menalled, F.D., Kelty, M.J., 2001. Crown structure and biomass allocation strategies
of three juvenile tropical tree species. Plant Ecology 152, 1–11.
Mulkey, S.S., Wright, S.J., 1996. Influence of seasonal drought on the carbon balance of tropical forest plants. In: Mulkey, S.S., Chazdon, R.L., Smith, A.P. (Eds.), Tropical Forest Plant Ecophysiology. Chapman & Hall, New York, pp. 187–216. Peres-Neto, P.R., Magnan, P., 2004. The influence of swimming demand on
phenotypic plasticity and morphological integration: a comparison of two poly-morphic charr species. Oecologia 140, 36–45.
Petit, B., Montagnini, F., 2006. Growth in pure and mixed plantations of tree species used in reforesting rural areas of the humid region of Costa Rica Central America. Forest Ecology and Management 233, 338–343.
Piotto, D., Víquez, E., Montagnini, F., Kanninen, M., 2004. Pure and mixed forest plantations with native species of the dry tropics of Costa Rica: a comparison of growth and productivity. Forest Ecology and Management 190, 359–372. PRORENA, 2005. Forest Science Program: Annual summary, November 2005. In: STRI
and Yale University School of Forestry and Environmental Studies, Panama City, Panama, p. 19.
Ruel, J.-C., Messier, C., Doucet, R., Claveau, Y., Comeau, P., 2000. Morphological indicators of growth response of coniferous advance regeneration to overstory removal in the boreal forest. Forestry Chronicle 76, 633–642.
Saha, J.P., Rossa, M.S., Kopturb, S., Snyderc, J.R., 2004. Estimating aboveground biomass of broadleaved woody plants in the understory of Florida Keys pine forests. Forest Ecology and Management 203, 319–329.
Santiago, L.S., Kitajima, K., Wright, S.J., Mulkey, S.S., 2004. Coordinated changes in photosynthesis, water relations and leaf nutritional traits of canopy trees along a precipitation gradient in lowland tropical forest. Oecologia 139, 495–502. Santiago, L.S., Mulkey, S.S., 2005. Leaf productivity along a precipitation gradient in
lowland Panama: patterns from leaf to ecosystem. Trees 19, 349–356. Scowcroft, P.G., Friday, J.B., Idol, T., Dudley, N., Haraguchi, J., Meason, D., 2007.
Growth response of Acacia koa trees to thinning, grass control, and phosphorus fertilization in a secondary forest in Hawai’i. Forest Ecology and Management 239, 69–80.
Snowdon, P., Raison, J., Keith, H., Ritson, P., Grierson, P., Adams, M., Montagu, K., Bi, H.-Q., Burrows, W., Eamus, D., 2002. Protocol for Sampling Tree and Stand Biomass. Australian Greenhouse Office, Canberra, Australia, p. 76.
Stier, S.C., Siebert, S.F., 2002. The Kyoto Protocol: an Opportunity for biodiversity restoration forestry. Conservation Biology 16, 575–576.
Wishnie, M.H., Dent, D.H., Mariscal, E., Deago, J., Cede ˜no, N., Iberra, D., Condit, R., Ash-ton, P.M.S., 2007. Initial performance and reforestation potential of 24 tropical tree species planted across a precipitation gradient in the Republic of Panama. Forest Ecology and Management 243, 39–49.
York, R.A., Battels, J.J., Heald, R.C., 2006. Release potential of giant sequoia follow-ing heavy suppression: 20-year results. Forest Ecology and Management 234, 136–142.
Zar, J.H., 1996. Biostatistical analysis. Prentice-Hall, Inc., Upper Saddle River, N.J. Zianis, D., Mencuccini, M., 2004. On simplifying allometric analyses of forest biomass.