C O R P O R A T I O N
Charles A. Goldman
Lindsay Butterfield
Diana Lavery
Trey Miller
Lindsay Daugherty
Trinidad Beleche
Bing Han
Prepared for
the Texas
Higher Education
Coordinating Board
Using Workforce
Information for
Degree
Program
Planning
in Texas
C O R P O R A T I O N
The research in this report was produced for the Texas Higher Education Coordinating Board by RAND
Education, a unit of the RAND Corporation. The RAND Corporation is a research organization that
develops solutions to public policy challenges to help make communities throughout the world safer and
more secure, healthier and more prosperous. RAND is nonprofit, nonpartisan, and committed to the public
interest. RAND’s publications do not necessarily reflect the opinions of its research clients and sponsors.
Support RAND—make a tax-deductible charitable contribution at www.rand.org/giving/contribute.html. RAND® is a registered trademark.
Cover Image: Fotolia/Rob
© Copyright 2015 RAND Corporation
This document and trademark(s) contained herein are protected by law. This representation of RAND intellectual property is provided for noncommercial use only. Unauthorized posting of RAND documents to a non-RAND website is prohibited. RAND documents are protected under copyright law. Permission is given to duplicate this document for personal use only, as long as it is unaltered and complete. Permission is required from RAND to reproduce, or reuse in another form, any of our research documents for commercial use. For information on reprint and linking permissions, please see the RAND permissions page (www.rand.org/pubs/permissions.html).
Design by KSA-Plus Communications, Inc.
RAND Offices
Santa Monica, CA ■ Washington, DC ■ Pittsburgh, PA ■ New Orleans, LA ■ Jackson, MS ■ Boston, MA Cambridge, UK ■ Brussels, BE ■ Canberra, AU
Using Workforce Information for
Degree Program
Planning
in Texas
Charles A. Goldman
Lindsay Butterfield
Diana Lavery
Trey Miller
Lindsay Daugherty
Trinidad Beleche
Bing Han
Preface
In May 2013, the Texas Legislature passed House Bill 1296, requiring the Texas Education
Agency to distribute information to public school students about higher education institutions
and workforce needs in the state. Specifically, the bill calls for comparisons on higher education
institutions in terms of tuition costs, student debt, retention and graduation rates, and employment
outcomes. The bill also requires disseminating the Texas Workforce Commission (TWC) projections
of future occupational demands and annual wages for the jobs in highest demand.
The bill further requires the Texas Higher Education Coordinating Board (THECB), in conjunction
with TWC, to prepare a report on Texas’s future workforce needs that would help inform decisions
to develop or expand postsecondary education programs. This portion of the bill is the motivation
for the present report.
Educators and policymakers in Texas and elsewhere have a wide variety of quantitative and
qualitative workforce information available for planning degree and certificate programs in colleges
and universities. To help guide use of such resources, The College for All Texans Foundation, which
works to further the objectives of THECB, asked RAND Education, a unit of the RAND Corporation,
to conduct this study. It examines the quantitative and qualitative sources of information on
workforce needs. It reviews common techniques for quantitative modeling using workforce data, as
well as how institutions and states may use these data to inform decisions about degree programs.
It also develops some data tools and recommends ways to use workforce information in degree
program planning.
Contents
Summary
_________________________________________________________________________________________
3
Acknowledgments
_______________________________________________________________________________
10
Abbreviations
___________________________________________________________________________________
11
1
Introduction
_________________________________________________________________________________
12
2
Approaches to Workforce Modeling and Data Sources
_________________________________________
14
3
Describing the Current Practices for Workforce Data Use
______________________________________
24
4
Modeling Statewide and Regional Supply and Demand
________________________________________
33
5
Main Findings, Recommendations, and Next Steps
____________________________________________
42
Appendix A. Workforce Modeling Approaches
____________________________________________________
45
Appendix B. Computation of Standard Errors
_____________________________________________________
50
References
______________________________________________________________________________________
51
Figures
Figure 2.1
Flow Model Structure
14
Figure 2.2
Stock Model Structure
15
Figure 2.3
THECB Regions and
WDAs
19
Figure 4.1
Flow Model with
Data Sources
37
Figure 4.2
Stock Model with
Data Sources
38
Tables
Table S.1
Supply and Demand
Growth Matrix Structure
7
Table 2.1
Degrees Held by Computer
Systems Analysts with a
Baccalaureate Degree in
Texas, 2010–11
17
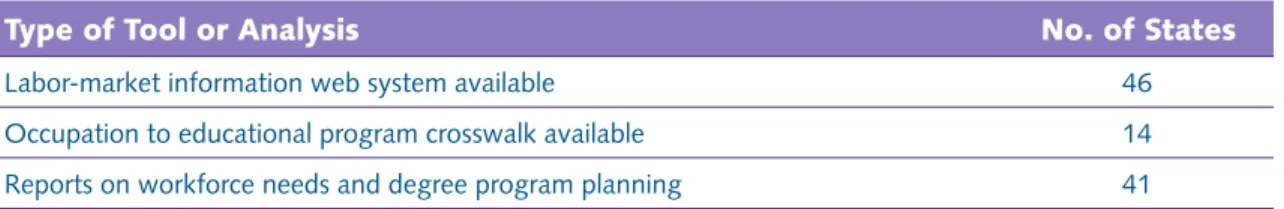
Table 3.1
Overview of States by Type of
Tool or Analysis
27
Table 4.1
Supply and Demand Growth
Matrix Structure
34
Table 4.2
Statewide Supply and Demand
Growth Matrix
40
Table A.1
Summary of Modeling
Summary
C O R P O R A T I O N
Using Workforce Information for
Degree Program
Planning
in Texas
Charles A. Goldman
Lindsay Butterfield
Diana Lavery
Trey Miller
Lindsay Daugherty
Trinidad Beleche
Bing Han
Prepared for the
Texas Higher Education
Coordinating Board
In May 2013, the Texas Legislature passed House Bill 1296, requiring a report on
Texas’s future workforce needs that would help inform decisions to develop or expand
postsecondary education programs. Educators and policymakers in Texas and elsewhere
have a wide variety of quantitative and qualitative workforce information available for
planning degree and certificate programs in colleges and universities. Such information
can serve at least three major purposes: (1) strategic review of program alignment at the
state or institutional level; (2) a broader strategic scan of occupations and fields of study
where new programs may be needed; and (3) institutional proposal development for the
opening and closing of programs, and the subsequent review of these proposals by the
state.
To guide the use of these data resources and to respond to the legislative requirement, the Texas Higher Education Coordinating Board (THECB) asked the RAND Corporation to:
■
■ describe current practices in using workforce information for degree program planning in Texas and elsewhere;
■
■ analyze options for using workforce information and recommend promising practices; ■
■ develop data tools, where feasible; and ■
■ apply these tools and describe findings.
This report is based on a literature review, interviews with state officials and institutional representatives, and quantitative analysis of workforce data.
Data Sources and Services
Data sources available for planning and modeling purposes include those on individuals, on jobs, and on insights from employers, as well as combinations of these. This project reviews the following commonly used data sources and services:
■
■ The American Community Survey (ACS), which allows detailed estimates of workers by occupation and region.
■
■ Bureau of Labor Statistics (BLS) and Texas Workforce Commission (TWC) data, which provide estimates of current employment and future demand by occupation and region.
■
■ THECB statistics on degree and certificates awarded by Texas higher education institutions, by field of study and degree/certificate level.
■
■ Commercial services that allow analysis of online job listings. These services can show trends in demand for occupations and can often provide data much more rapidly than the BLS and the TWC. Content analysis tools allow examination of the education and skill requirements for positions.
■
■ Statistical data capture only certain features of the labor market, so discussions with employers and other experts (e.g., professional leaders) play an essential role in further understanding workforce needs both in terms of quantity and the qualities or skills required to fill these needs.
To use workforce data for program planning, it is essential to link occupations to fields of study. The U.S. Department of Education provides a tool to match occupations to closely related fields of study, but it typically matches only a few fields to each occupation, which is especially limiting for bachelor’s and graduate programs, which can lead to preparation for multiple occupations.
Key Findings and Recommendations
All of the data sources in the previous section can contribute to understanding workforce needs and hence planning for higher education programs. But each data source has important limitations, so none of the sources should be used on its own. It is important to use data from a range of sources, including quantitative
data and conversations with the business community, before making decisions to open and close new degree and certificate programs or to change existing programs to align them with labor market needs. Workforce information should be used in Texas not only to manage new and ongoing degree programs, but also for periodic strategic planning at the state, regional, and institutional levels. In preparing proposals, Texas institutions would benefit from clear guidance on the sources of data to use and easier methods of accessing them. In particular, more systematic means of engaging employers would help both the state and institutions to align degree programs with workforce needs.
Approaches
In this report, we identify and describe a number of methods to analyze workforce data. Workforces can be analyzed using stock or flow concepts. Stocks represent the total quantity of workers or jobs at a point in time (past, present, or future). Flows represent changes over time (often annually).
Workforce information should
be used in Texas not only to
manage new and ongoing
degree programs, but also for
periodic strategic planning
at the state, regional, and
institutional levels.
A typical flow model compares the annual need for new workers, stemming from both occupational growth and replacement of workers who leave the occupation, with the annual production of degrees and certificates within the state or region. A typical stock model compares the current and projected stock of employed workers to the total and projected supply of workers in the same occupation. Both stock and flow models then must translate gaps in supply into demand for academic programs, in terms of degree level and field of study. The models must finally compare the current and projected capacity of postsecondary programs for these degree levels and fields of study to meet the occupational demands.
Flow models generally cannot represent important mobility in the labor market, where workers move geographically and from one occupation to another. While stock models incorporate these adjustments, until recently, it was infeasible to model stocks with detail in occupations, so these models were generally much less detailed than flow models. As we discuss on the following pages, a new data source allows us to overcome this limitation.
Much of the practical use of workforce data does not follow formal stock or flow models. Instead, users generally rely on specific indicators that are related to growth in demand or imbalances between supply and demand. Commonly used indicators are “hot jobs” or rapidly growing occupations, wage changes, or vacancy rates. All of these indicators may point to unmet needs in the workforce.
Current Practices in Using Workforce Data
At the state and regional level, there is a significant amount of data available. Workforce data are being used for planning and program development at the state, regional, and institutional levels in a variety of ways.
Institutional Planning
Institutions rely on public data sources, paid services, and interactions with employers and individuals to provide evidence of workforce demand. Institutional representatives report that, with a few exceptions (e.g., need for more current data and for data on emerging industries and occupations), available data are sufficient for their planning needs. However, our interviews and our review of the workforce evidence
submitted in postsecondary education program proposals suggests that the rigor of workforce analysis varies widely and that institutions may benefit from some additional guidance on the availability and use of workforce data. Institutions may also benefit from improved information on postsecondary programs across the state and their capacity to meet workforce needs.
Strategic Review and Priority Setting
THECB staff use workforce data to validate institutional data in program proposals and create biannual regional reports that provide workforce data to support regional and institutional planning, but they do not actively use workforce data to support strategic planning. Some regions provide high-quality, region-specific data and analysis, but there are generally no processes to systematically incorporate this evidence into higher education planning. Our interviews suggest that the data provided by the TWC is extremely helpful but that the state might also provide data on larger trends in the workforce. On a somewhat different note, some interviewees also suggest that the state should standardize degree program offerings more to meet employer needs consistently across the state. A review of other state practices indicates that it is common for states to simply provide workforce data. It is much less common for states to provide analytical reports that translate these data for higher education planning.
Institutions rely on public data
sources, paid services, and
interactions with employers and
individuals to provide evidence
of workforce demand.
Data Tools and Results
Flow modeling has been widely used for many years, and our analysis did not uncover any major practical improvements we could make in these techniques. Stock modeling, however, offers some new opportunities. While stock models have been restricted to quite general analysis because detailed data on employed workers were not available, the ACS generates data that can now be used to estimate historical (and future) supply of workers in each occupation group for the state as a whole and within each region. We develop a new matrix tool to compare these supply estimates to existing TWC estimates of demand.
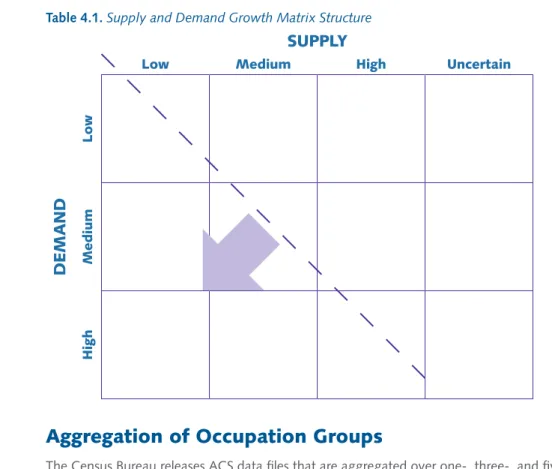
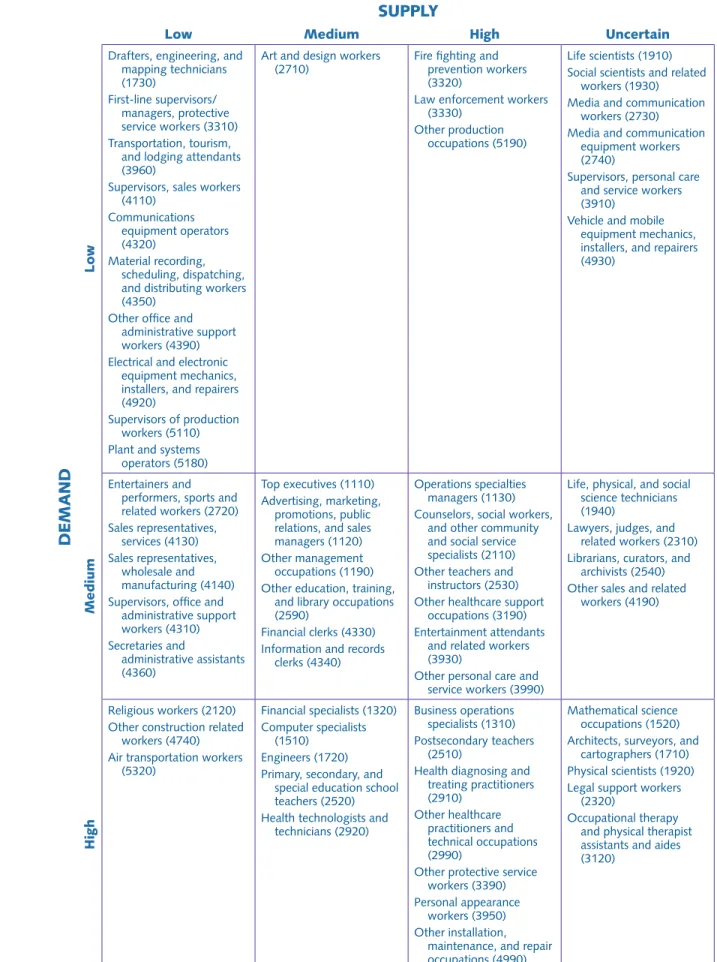
To implement this idea, we begin by selecting the occupations that have postsecondary needs and group them into somewhat larger occupational groups. Our basic approach is to compare the growth rates in existing TWC demand projections for these occupational groups to the growth rates of supply derived from available ACS data. Because it is infeasible to compare the demand and supply growth rates directly, we classify annual rates of growth in demand into equal-sized groups of high-, medium-, and low-growing occupation groups. We also classify the annual growth rates in supply into three equal-sized groups.
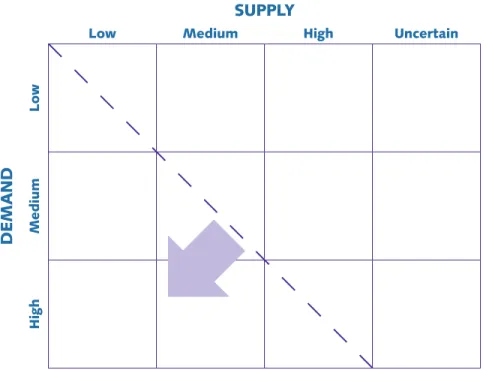
Because the estimates of supply growth are uncertain, we also classify some of the supply growth values as “uncertain” if the estimates are of low precision. We do not have information on precision for the demand-growth estimates, so we report them only as high, medium, or low. We compare these growth rates in a three-by-four matrix, as shown in Table S.1. We produce matrices at the state level and for each of the ten THECB regions.
Occupation groups that fall below the diagonal, such as those in the high-demand, low-supply cell, are good candidates to explore further to identify unmet workforce needs. The following groups are in the statewide matrix:
■
■ Religious workers ■
■ Other construction-related workers ■
■ Air transportation workers
The high-demand, medium-supply cell also sits below the diagonal and includes the following: ■ ■ Financial specialists ■ ■ Computer specialists ■ ■ Engineers ■
■ Primary, secondary, and special education school teachers ■
Table S.1. Supply and Demand Growth Matrix Structure
SUPPLY
Low Medium High Uncertain
D
EM
A
N
D
Low Me d ium Hi ghBecause of the uncertainty, it is also necessary to examine the high-demand, uncertain-supply cell, which includes the following:
■
■ Mathematical science occupations ■
■ Architects, surveyors, and cartographers ■
■ Physical scientists ■
■ Legal support workers ■
■ Occupational therapy and physical therapist assistants and aides
Supplementary files provide matrices for each of the 10 THECB regions in Texas to guide regional planning. We also prepare other tools using the ACS data that can be used to improve both stock and flow modeling. Specifically, these tools provide the following data for Texans working in each occupation:
■
■ Current distribution of education level ■
■ Fields of degree for bachelor’s degree holders ■
■ Median annual earnings
These tools work in conjunction with the supply and demand matrices to identify postsecondary programs appropriate to meet the needs shown in the matrix. These tools can help identify occupational groups and regions for further exploration. In these cases, it is essential to engage institutions, employers, and other knowledgeable observers to collect local and regional perspectives on workforce needs and the appropriate postsecondary programs to meet them.
Limitations of the Tools
As with all statistical measures of the labor market, the supply and demand matrices depend on a number of assumptions, which may cause the estimates of future supply and demand to differ from actual experience. As a result, it is essential to use these tools in conjunction with the perspectives of institutions, employers, and other experts.
Recommendations
Improve Planning Processes
Workforce data can be used to improve higher education planning at the state, regional, and institutional levels. Our assessment of the ways that data are currently used in Texas higher education planning suggests that more could be done to systematically integrate workforce analysis to improve planning. We provide several recommendations on ways that planning processes can better incorporate workforce data.
Use Workforce Data for Regular Strategic Planning. We recommend that the state and institutions shift some efforts toward proactive data use through regular strategic planning. By more systematically and regularly analyzing workforce data, the state and institutions may be able to identify unmet needs earlier and mobilize resources to meet those needs. For example, the THECB could develop a priority-setting process based on fields of study with critical statewide or regional shortages. The supply and demand matrices may be useful for setting priorities. But these tools must be complemented by discussions with industry representatives, and potentially additional sources of statistical data, to validate their indicators.
Provide Guidance to Institutions on Appropriate Data Use. Institutions may benefit from a website designed to provide access to a wide range of data resources, important information on these resources, and examples of promising practices in using workforce data for program planning. In some cases, the state may need to set requirements for using workforce data. For example, in the program-approval process, requiring institutions to provide data from a common set of resources may guard against selectively including only data that support the proposal. This approach will also allow the THECB to build expertise with specific data resources in order to validate the evidence provided in proposals.
Enhance Data Resources
While workforce analysis can provide important evidence for the planning process, none of the data sources we identified provide a complete picture of the workforce. Each has strengths and weaknesses. So it is important to consider data from a range of sources, including quantitative data and conversations with the business community, before making decisions to open and close new degree and certificate programs. We provide several recommendations on ways to enhance data resources for planning.
Develop Approaches to Systematically Engage Employers. Institutional representatives we interviewed, particularly those from community colleges, are regularly and systematically engaging employers and industry experts, but they suggest that a more routine and systematic approach is needed to foster input from employers efficiently. The state may want to explore tools that have been designed to elicit regular employer input (e.g., those developed by the Center for Employability Outcomes at Texas State Technical College) and determine whether these tools can inform program development across the state.
Identify Strategies to Explore Emerging Trends. Large-scale public data sources take time to update. Institutions worry that these sources cannot inform them about current trends, especially for applied programs that would link closely to local employers with
changing occupations or in emerging industries. Job posting data, available through commercial services, may provide the most efficient method of getting data on these emerging industries and occupations. Direct engagement with employers and tools to systematically solicit employer input may also be useful in identifying emerging trends.
Assess Existing Capacity. Several institutions cite difficulties in assessing the level of capacity at other institutions in their region
to address a particular workforce need. It might be worthwhile to collect information on program capacity periodically to simplify institutional planning and discourage duplicative efforts.
Provide Access to Major Data Resources. Vendor tools that could be useful to institutions and the state are used unevenly across institutions. In some cases, the cost of licenses to use these tools may prevent institutions from accessing them. The state should explore whether there are more cost-effective ways to achieve statewide access to these tools in an effort to ensure that institutions are using a common set of data resources.
The state should explore whether
there are more cost-effective ways
to achieve statewide access to data
tools in an effort to ensure that
institutions are using a common set
of data resources.
Acknowledgments
The authors would like to thank the commissioner and staff of the THECB for helpful guidance
throughout the research process, with particular acknowledgment to Gary Johnstone, Susan
Brown, David Gardner, Julie Eklund, Stacey Silverman, Rex Peebles, and Nina Wright. We also
thank Paul Turcotte, Ginger Gossman, and Jana Cossairt, who undertook essential analyses of
THECB data to support the project.
We appreciate the valuable assistance of Richard Froeschle and the staff of the TWC.
We also thank RAND colleagues Clifford Grammich and Erin-Elizabeth Johnson for helping us
communicate our findings in a clear and engaging way. We greatly appreciate the thoughtful
reviews provided by Cathy Stasz, Susan Gates, Jeff Strohl, and Anthony Carnevale.
We also thank the participants in our interviews. Although we generally agreed not to name them
or their institutions, we deeply appreciate their cooperation and the important information they
shared with our research team.
Abbreviations
ACSAmerican Community Survey
BLS
Bureau of Labor Statistics
C4EO
Center for Employability Outcomes
CIP
Classification of Instructional Programs
CPS
Current Population Survey
EMSI
Economic Modeling Specialists International
FOD
field of degree
FTSE
full-time student equivalent
JOLTS
Job Openings and Labor Turnover System
KSAs
knowledge, skills, and abilities
LMCI
Labor Market and Career Information
LMI
labor-market information
PUMA
Public Use Microdata Area
SOC
Standard Occupational Classification
SOCRATES
Standardized Occupational Components for Research and Analysis of Trends in
Employment System
STEM
science, technology, engineering, and mathematics
SWAP
Strategic Workforce Assessment Program
TAWB
Texas Association of Workforce Boards
TCNWS
Texas Center for Nursing Workforce Studies
TEPS
Training and Education Planning System
TRACER
Texas Rapid Access to Career and Economic Services
THECB
Texas Higher Education Coordinating Board
TWC
Texas Workforce Commission
WDA
Workforce Development Area
Introduction
1
Government, employers, and other key stakeholders have raised concerns that the current
pool of graduates are not meeting workforce needs and have emphasized a need for
greater alignment between workforce needs and education (ACICS, 2014; GAO, 2013;
NGA, 2014; TAWB, 2014). The 2014 federal Workforce Innovation and Opportunity
Act (WIOA) places renewed emphasis on education and training for workforce needs.
In particular, the WIOA requires states accepting its funds to streamline programs
and pathways for workforce education and training and to evaluate and adjust these
programs in response to measured outcomes. Others also recommend that we use
workforce data to a greater degree and encourage more partnerships with employers to
improve higher education planning (ACICS, 2014; NGA, 2014).
In an effort to improve the alignment between workforce needs and higher education in Texas, the Texas Legislature approved House Bill 1296 on May 20, 2013, requiring a report on Texas’s future workforce needs to inform decisions to develop or expand postsecondary education programs to meet these needs. In support of this requirement, the Texas Higher Education Coordinating Board (THECB) asked the RAND Corporation to conduct this study to:
■
■ describe current practices in using workforce information for degree program planning in Texas and elsewhere;
■
■ analyze options for using workforce information and recommend promising practices; ■
■ develop data tools where feasible; and ■
■ apply these tools and describe findings.
Educators and policymakers have available a wide variety of quantitative and qualitative workforce information for planning degree and certificate programs in colleges and universities. The use of workforce data to identify unmet workforce needs—where the demand for individuals by employers is greater than the supply of qualified workers—can help states, regions, and institutions ensure that new degree programs are being created in areas with high levels of unmet workforce need. They also can help in decisions to close programs that are not needed. The data can be used in at least three ways: (1) strategic review of program alignment at the state or institutional level; (2) a broader strategic scan of occupations and fields of study1
where new programs may be needed; and (3) institutional proposal development for the opening and closing of programs and the subsequent review of these proposals by the state. In this report, we document current use of workforce data in Texas and the nation and suggest improvements to existing state and institutional practices for using such data.
There are a number of challenges to using workforce analysis for degree- and certificate-program decisions. Each data source used to estimate workforce demand provides a different snapshot of the workforce, and each has substantial limitations. Efforts to map occupations and industries onto specific degree types are challenging
1 In this report, we use “field of study” in the general sense of academic fields, not to denote the Texas-specific Field of Study Curriculum, which specifies common courses that fulfill lower-division requirements.
because most occupations have individuals with a range of educational credentials, making the linkages complex and constantly changing. In this report, we document the range of challenges that stakeholders should be aware of when using workforce analysis for higher education planning. We also introduce a new tool that can address some of the limitations of existing data sources and may be able to support statewide strategic planning.
Chapter 2 describes the commonly used approaches and data sources for estimating workforce needs and linking those needs to degree programs, and describes the benefits and limitations of various approaches and data sources. Chapter 3 examines how these data are currently being used by institutions and states to inform decisions about degree programs. Chapter 4 presents a new data tool that was created to address limitations of other data sources and may be useful in strategic planning and program development. Chapter 5 concludes the report with recommendations on ways that workforce information, including the new tool that is presented, can be used to better inform degree program planning. Appendix A provides some additional review of approaches to quantitative modeling in the literature, and Appendix B explains the standard error computations used in the tool development.
In this chapter, we review data sources and technical considerations relevant to
measuring workforce needs. We begin by exploring three common techniques: (1)
modeling workforce needs in terms of flows; (2) modeling needs in terms of stocks; and
(3) using specific indicators rather than models. We then discuss standard classification
systems for educational programs, occupations, and Texas geography, which are used
in many data sources. Following the discussion of major data sources, we discuss some
issues in matching occupations to fields of study and explore two commercial services
that try to address these issues and make the data sources easier to use.
Appendix A provides some additional review of the literature in workforce modeling. Here, we offer a streamlined overview of the most relevant points.
Approaches to Modeling Workforce Needs
Identifying Gaps between Demand and Supply: Stock and Flow Models
Workforce needs are often identified by comparing measures of demand for workers to measures of the supply of workers. This analysis can be done using stock modeling (i.e., comparing the total supply and demand of workers or jobs) or through flow modeling (i.e., comparing new supply of workers or jobs to new demand for them).
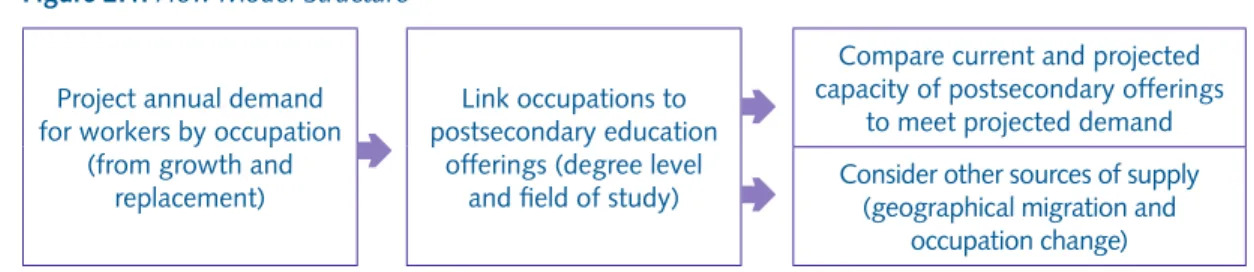
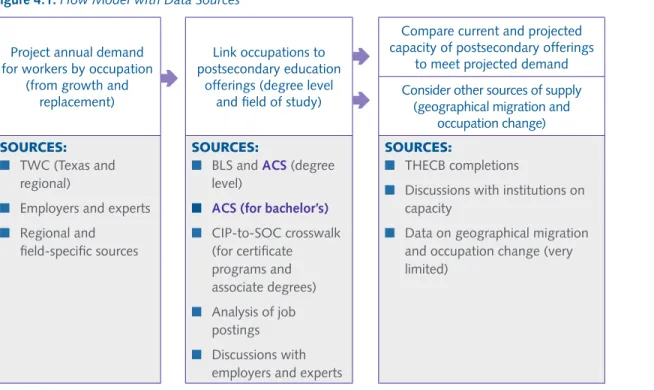
Figure 2.1 shows the structure of a typical flow model. These models compare the annual requirement for occupational growth and replacement with the annual production of degrees and certificates within the state or region. The model starts with projections of the demand for workers and then translates this demand into academic programs, in terms of degree level and field of study. The model then compares the current and projected capacity of postsecondary programs for these degree levels and fields of study to meet the occupational demands.
Figure 2.1. Flow Model Structure
Project annual demand for workers by occupation
(from growth and replacement)
4
Link occupations to postsecondary education
offerings (degree level and field of study)
4
4
Compare current and projected capacity of postsecondary offerings
to meet projected demand Consider other sources of supply
(geographical migration and occupation change)
These models can be very detailed in terms of occupations and fields of study, but they face a major challenge: They typically use data that focus on sources of workers within a state or region, while newly credentialed workers may come from elsewhere. Put another way, there are many sources of new credentials for the Texas
Approaches to
Workforce Modeling
and Data Sources
workforce beyond those produced by Texas colleges. An accurate comparison requires modeling in- and out-migration, entry and exit from the labor force, and movement among the presently employed from one occupation to another (given that a degree may qualify a worker for more than one occupation, and a single occupation may draw workers from multiple fields of study). This is particularly problematic when modeling flows of credentials at the regional level, as graduates are likely to move across regions for study, work, or other reasons. Although we explored ways to extend flow models to take account of geographic mobility and
movement from one occupation to another, we were unable to identify any broadly applicable techniques that could be used in Texas for this purpose. As a result, flow models necessarily represent only part of the supply that may be available to meet employer demands, limiting their accuracy in many circumstances.
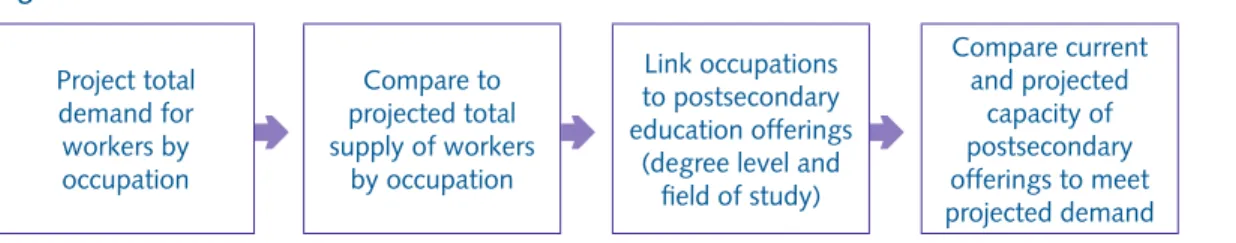
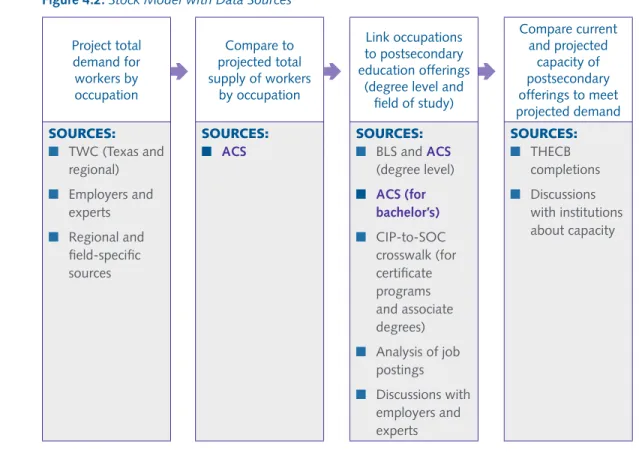
The other major modeling approach is based on stocks. Figure 2.2 shows the structure of a typical stock model, which compares the current and projected stock of employed workers to the total supply of workers in the same occupation. As with the flow model, the model then must translate gaps in supply into demand for academic programs, in terms of degree level and field of study. The model then compares the current and projected capacity of postsecondary programs for these degree levels and fields of study to meet the occupational demands.
Figure 2.2. Stock Model Structure
Project total demand for workers by occupation
4
Compare to projected total supply of workers by occupation4
Link occupations to postsecondary education offerings(degree level and field of study)
4
Compare current and projected capacity of postsecondary offerings to meet projected demandBecause stock models capture all sources of demand and supply in making comparisons, they have a major advantage over flow models, which are forced to ignore many potential sources of supply. There is no need in stock models to isolate in- and out-migration at the state or regional level or the entry to and exit from the labor force, which are all likely to respond to simple measures of gaps identified by flow models. Until recently, however, it was infeasible to model stocks with detail in occupations, so these models were generally much less detailed than flow models. As we discuss later in this report, a new data source allows us to overcome this limitation.
Using Indicators of Workforce Need
Much of the practical use of workforce data does not follow formal stock or flow models. Instead, users generally rely on specific indicators that are related to growth in demand or imbalances between supply and demand. For example, many states and institutions focus on “hot jobs,” or rapidly growing occupations, to identify areas of potential need, with the assumption that there is more likely to be unmet need when demand is growing rapidly. Others may look at wage changes over time, as economic theory suggests that in a labor market responding to changes in prices, a shortage should push relative compensation up as the market adjusts (Mortenson, 1986; Rogerson, Shimer, and Wright, 2005). Stakeholders may also look to job vacancy rates and the time it takes to fill a position, in addition to indicators such as unemployment, employment, and job vacancies.
Because stock models capture all
sources of demand and supply in
making comparisons, they have a
major advantage over flow models,
which are forced to ignore many
potential sources of supply.
Qualitative Analysis of Employer and Expert Perceptions
As we will describe in greater detail in the following section, there are substantial challenges to using quantitative workforce modeling, including limitations to data sources. Qualitative data from employers and industry experts are important for providing an alternate look at the workforce. These conversations may help the state and institutions prioritize fields for deeper quantitative analysis.
Depending on the purpose, there are different individuals from whom to collect qualitative information. For example, human-resource managers, high-level leadership, and industry experts may be better positioned to provide information on local employment and trends in demand, while first-line supervisors and employees in the positions can better speak to skill needs for occupations.
Challenges with Workforce Modeling
Matching Workforce Needs to Degrees
Using workforce data for higher education planning requires a way to link workforce needs to degrees. In the examples of stock and flow modeling in the previous section, both modeling strategies require occupations to be linked to degrees to determine how workforce needs translate into needs for higher education, although the matching takes place at different points in the process. Similarly, if indicators of workforce need or qualitative data from employers are used to identify workforce shortages, there must be a way to translate these workforce needs into higher education demands.
There are substantial challenges to face in translating workforce need to degree needs. In some professional occupations, such as nursing, the degree-holders-to-jobs match is straightforward: To work as a nurse, an individual must hold a nursing degree, and most individuals who graduate from nursing programs are likely to go into nursing or one of a few nursing-related occupations. While registered nurses in Texas are not required to hold a bachelor’s degree, about 55 percent of them do. Of the registered nurses with bachelor’s degrees, 81 percent hold those degrees in nursing and 19 percent hold a bachelor’s degree in another field (2010–11 data from the U.S. Census Bureau, 2014).
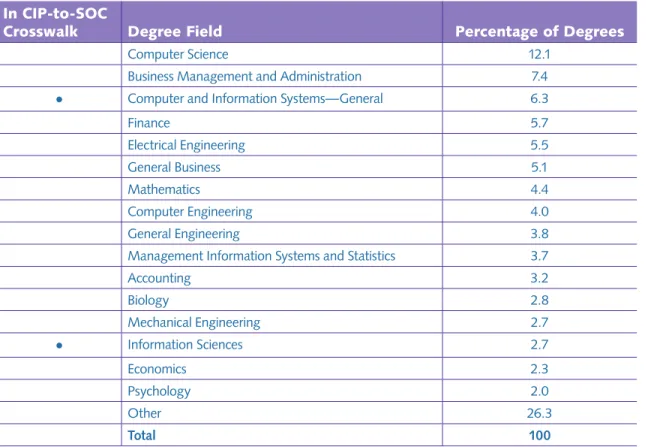
In other occupations, such as those involving computer and information technology, the pathways are much more varied. Many individuals enter these occupations without any postsecondary education. Others have certificates, associate degrees, or baccalaureate degrees. The field of study for degrees feeding into computer and information technology-related occupations varies widely. Table 2.1 shows the most common baccalaureate degree fields among computer systems analysts in Texas. Clearly, many types of degrees feed into this occupation. It is challenging, therefore, to identify whether existing programs are meeting the workforce needs, because existing programs may represent a wide range of fields.
There are substantial challenges
to face in translating workforce
need to degree needs.
Table 2.1. Degrees Held by Computer Systems Analysts with a Baccalaureate Degree in Texas, 2010–11
In CIP-to-SOC
Crosswalk
Degree Field
Percentage of Degrees
Computer Science 12.1 Business Management and Administration 7.4
•
Computer and Information Systems—General 6.3Finance 5.7 Electrical Engineering 5.5 General Business 5.1 Mathematics 4.4 Computer Engineering 4.0 General Engineering 3.8 Management Information Systems and Statistics 3.7
Accounting 3.2 Biology 2.8 Mechanical Engineering 2.7
•
Information Sciences 2.7 Economics 2.3 Psychology 2.0 Other 26.3 Total 100SOURCE: Data from the U.S. Census Bureau, 2014.
The federal government has provided a crosswalk that is commonly used in workforce modeling. This crosswalk relies on two government classification systems, the Standard Occupational Classification (SOC) and the Classification of Instructional Programs (CIP).
The SOC is a taxonomy system to group workers into occupation categories and is used by many federal statistical agencies, such as the Census Bureau and the Bureau of Labor Statistics (BLS). SOCs are six-digit codes in which the first two digits are recognized as the “major” occupational group, the first four digits are recognized as the “minor” occupational group, and the full six-digit code is the “detailed” occupation. For example, agricultural engineering workers, whose SOC code is 172020, work within the “Architecture and Engineering Occupations” major group, whose two-digit code is 17, and are “Engineers” whose minor-group code is 1720. The complete list of SOCs is reviewed and updated frequently to stay current as new jobs emerge and as other jobs become obsolete. In 2010, there were 23 major groups, 97 minor groups, and 860 detailed occupations (BLS, “Standard Occupational Classification,” n.d.).
The CIP is a national classification system developed by the National Center for Education Statistics to classify all postsecondary fields of study including those leading to degrees and non-degree certificates. National CIP codes are grouped by subject fields (e.g., accounting, computer science, humanities), not by level of instruction (e.g., associate, bachelor’s, master’s, doctorate). Similar to the SOC system, the CIP codes are structured in a hierarchy in which the first two digits are general groups, the first four digits are more specific groups, and the six-digit CIP is the detailed field. The list of CIPs is also updated periodically to reflect changes in postsecondary programs (National Center for Education Statistics, “CIP 2010,” n.d.).
The federal government’s CIP-to-SOC crosswalk is limited in that it accounts only for degrees and occupations that are clearly and closely linked and may not accurately represent the true distribution of educational
listed in Table 2.1 are linked with the computer systems analyst occupation in the CIP-to-SOC crosswalk. These two instructional programs produced only 9 percent of computer systems analysts with a baccalaureate degree. Limiting the pool of supply to degrees identified in the crosswalk is likely to underestimate significantly the true number of individuals equipped to meet occupational workforce needs. Another challenge is that fields of study may be linked to multiple occupations, so it is unclear how many graduates in a field might choose one occupation over others to which the degree is linked. For example, we cannot assume that all information-sciences graduates will become computer system analysts.
The CIP-to-SOC crosswalk is commonly thought to be more accurate for certificates and associate programs, where linkages are often tighter compared to those for bachelor’s and graduate programs.
Defining the Populations of Interest
To conduct workforce analysis, one must first determine what population to examine. This will vary by the purpose of the analysis. As noted previously, we are focusing on workforce analysis at the occupational level, but state and regional workforce analysis could also be conducted at the industry or the degree level (e.g., comparing how the demand for workers with B.A. degrees compares to supply). Some workforce analysts argue that the analysis should be done at an even lower level, where degrees are broken into the knowledge, skills, and abilities (KSAs) that a graduate from the field should have, and matched to the KSAs that
employers desire for particular jobs. However, the public data are not amenable to KSA-level analysis, so these approaches require substantial additional data collection to supplement what is publicly available.
For occupational analysis, one must determine how occupations will be grouped; that is, what level of SOC codes to use. Institutions may target specific occupations for analysis based on conversations with employers about particular areas of need, while the state may want to analyze all occupations to ensure that the greatest areas of need are identified. We may be interested in the most detailed (narrow) occupational groups, as these correspond with how employers may think about occupations. Degree programs also may map more directly onto detailed occupations and may therefore be useful in developing new degree programs. However, there are several challenges with using six-digit SOC codes. Public datasets that do not include the full population and instead rely on a sample of individuals may not have enough data to reliably estimate demand or supply for smaller occupations. Some federal agencies use a grouping called the “broad” occupational group, in which rarer occupations are grouped together, but still at a level finer than the minor groups. Common occupations are still represented at the most detailed (six-digit) level when using these broad occupational groups.
The use of SOC codes, which are intended to remain stable classifications of occupations, may not capture changes that are occurring to occupations. Newly emerging occupations may not be captured by any SOC code, at least until the next periodic revision of the codes, and some occupations may be shifting so that the appropriate classification is a hybrid of several SOC codes.
The federal government’s
CIP-to-SOC crosswalk is limited in
that it accounts only for degrees
and occupations that are clearly
and closely linked and may
not accurately represent the
true distribution of educational
credentials among workers in a
particular occupation.
Defining Regions
Another challenge in workforce analysis is to define the region of interest. If regions are defined to be too small, there may be insufficient data from sampled surveys to generate estimates for them. Analyses of small regions also may not account for persons commuting or moving to and from such regions. If regions are defined to be too large, the analysis may incorrectly assume that individuals are willing and able to work anywhere within the region, when that may not be true. In addition, the analysis cannot be used to examine regional variation in supply and demand that is any finer than the defined regions. The appropriate scope of analysis may differ by occupation or degree type. For example, individuals with associate degrees and certificates may be less likely to move than individuals with bachelor degrees or graduate degrees, so larger regions might be appropriate when considering new bachelor’s or graduate degree programs.
The Texas legislature has specified 28 official Workforce Development Areas (WDAs), which contain one or more whole counties. Collectively, these 28 WDAs cover the entire state. The WDAs are used to organize local workforce development boards and to process and report all workforce statistics in the state. The THECB has aggregated these 28 WDAs into 10 larger regions for higher education planning. Figure 2.1 shows the names and boundaries of the 10 THECB regions, along with lighter lines indicating the boundaries of the 28 WDAs that are combined.
Regardless of how regions are defined, there are likely to be challenges in fully capturing demand and supply within them. For example, state-level analysis may not include the many individuals who commute to work in Texas from Louisiana and Oklahoma in measures of supply, and the jobs in Louisiana and Oklahoma to which Texas residents commute will not be included in analysis of demand.
Data Sources
Data sources available for planning and modeling purposes include those on individuals, on jobs, and on insights from employers, as well as combinations of these. In this section, we review the major national and Texas-specific data sources most commonly used in measuring workforce supply and demand, as well as linking workforce needs to educational needs. In a Ray Marshall Center project funded by the Texas Workforce Investment Council, Mikelson et al. (2014) also provide a recent and thorough overview of data sources and tools for measuring workforce supply and demand.
Figure 2.3. THECB Regions and WDAs
High Plains THECB Regions WDAs Northwest West TX South TX Upper
Rio Grande Gulf
Coast Southeast Upper East Metroplex Central TX
American Community Survey (ACS)
The ACS is the largest survey—other than the decennial census—that the Census Bureau administers (U.S. Census Bureau, 2014). It was launched in 2005 to provide detailed annual data on a sample of the entire U.S. population, replacing the long form of the decennial census, which formerly provided such data but only once every 10 years. It asks approximately 1 percent of the population each year about their demographic characteristics, their household and family status, and their education and work, among other topics. It allows the examination of several important variables over both state and sub-state regions, but, of course, it is limited to the variables included on the ACS questionnaire. Thus, it is necessary to use ACS data in conjunction with other sources to measure a labor market situation.
Bureau of Labor Statistics (BLS) Data
The BLS is the authoritative source for SOC definitions and provides guidance for harmonizing SOC lists from different time points. While the SOC codes are essential descriptors for workforce data and they are updated periodically to reflect new and obsolete occupations, the list of SOC codes necessarily lags behind the emergence of new occupations in the economy.
Along with the SOC system, the BLS maintains a data file of the “typical” education required for entry into each detailed occupation that is estimated based on ACS data, data from a survey conducted by the Department of Labor, and interviews with employers and training experts. There are limitations to the usefulness of these education-level designations, as they do not reflect the full distribution of degree levels held by individuals in particular occupations, nor depict all employer needs. As Summers and Morisi (2012) note, if we assume these preferred education levels to accurately portray what is needed for occupations, it would lead to the conclusion that only a third of Americans require any college education, which is widely believed to be a significant underestimate.
The BLS coordinates a nationwide system of occupational-demand projections, largely implemented by the states. We discuss the Texas data on the following page. Based on these data, BLS produces a number of reports and data products providing the outlook for jobs by occupation or occupational group. Some BLS reports, such as those in Job Openings and Labor Turnover System (JOLTS), are reported only at the industry level and cannot be used for occupational analysis.
Current Population Survey (CPS)
The CPS is a national survey sponsored jointly by the U.S. Census Bureau and the BLS to gather data on the employment and unemployment, hours of work, earnings, and other labor-force characteristics (U.S. Census Bureau, 2012). For those interested in long-term historical trends, the CPS can provide occupation data back to the late 1960s, unlike the ACS which started in 2005. But the CPS sample is small compared to the ACS and is primarily intended to provide national estimates, not state or regional estimates within Texas.
Texas Workforce Commission (TWC) Data
The TWC is the state agency whose responsibilities include workforce development. Using methods coordinated by the BLS, the TWC—like similar agencies in other states—produces labor market projections over a 10-year period by detailed occupation for the state as a whole and for each of the 28 WDAs. Its occupational projections are for number of job positions, not workers. The current projections cover the period between 2012 and 2022. These projections are updated every few years to a new 10-year span.
These projections are based on large-scale surveys of business enterprises to establish a matrix of the
frequency of occupations in each industry. The projections start with forecasts of growth by industry and then apply this industry-occupation matrix to translate the growth of industries into growth of occupations. The TWC Labor Market and Career Information (LMCI) department provides a number of tools for accessing labor market information. Three widely used tools are Texas Rapid Access to Career and Economic Services (TRACER), Standardized Occupational Components for Research and Analysis of Trends in Employment System (SOCRATES), and Strategic Workforce Assessment Program (SWAP). Among other features, TRACER offers a web interface where users can access and download current employment and projected demand by occupation and WDA (and other geographical units), as well as average wages. SOCRATES offers a great deal of information for individual occupations. Through its web interface, users can generate a customized occupation profile including the same workforce and wage data as TRACER, as well as education levels typically required (from BLS), linked fields of study (from the CIP-to-SOC crosswalk), KSAs, and common industries employing the occupation. The common industry list allows users to search for individual employer contact information within those industries in any WDA, providing a helpful tool for institutions seeking to engage employers.
The TWC’s SWAP is a tool designed to assist policymakers or employers to identify the necessary skills and training programs related to any industry cluster or sector. Users can select an industry and specific occupation to access a list of the detailed work activities that are required. For each detailed work activity, the tool identifies the level of education needed to prepare for that activity and the CIP codes for the programs that are likely to provide the KSAs required to perform a particular work activity. The tool also provides a means of comparing the needs for graduates from a particular education program to the production of graduates in that field and region, a form of flow analysis.
THECB Data
The THECB produces statistics on degree and certificates awarded by Texas higher education institutions (also called completions), organized by CIP code for fields of study and degree/certificate level. While the data can depict the supply of new graduates, they do not report the total capacity of existing programs—which is the key measure for planning any new degree program.
Job Listings
Thanks to widespread posting of job listings on websites, a number of tools are available to analyze the frequency and content of job listings. Frequency counts can show trends in demand for occupations and can often provide data much more rapidly than larger scale statistical projects developed by BLS, TWC, and other agencies. Content analysis tools allow examination of the education and skill requirements for positions. This can significantly supplement the information available from government data sources, such as the BLS typical education at entry level.
There are also limitations with job-listing data. A significant portion of jobs are never listed through the sites and services used for job-posting analysis. In addition, many job listings may not include specific data on the educational credentials required, so other approaches may still be needed to link occupations to degrees. Analysis of the data must account for duplicate listings of the same position, and there may be some employers that list positions to accumulate resumes while not actually having an open position. While the data are likely to be more timely than the datasets collected by federal and state agencies, they also are less likely
to provide a fully representative picture of workforce needs. In general, job postings data have fewer validity checks and may thus be of less certain quality compared to more traditional labor market sources.
Discussions with Employers and Experts
As mentioned previously, statistical data capture only certain features of the labor market, so discussions with employers and other experts such as professional bodies play an essential role in providing context to statistical data and improving understanding of workforce needs. Discussions with employers and industry experts can provide a more nuanced picture of workforce needs and can help to ensure that degree programs are designed so that graduates can move directly into the workforce. In particular, it is important to elicit from employers detailed information on the skills needed and standards of preparation expected of graduates. Yet it can be
challenging to systematically engage employers and collect high-quality data across a range of occupations. Employers may be narrowly focused on their direct needs and may not be able to provide the higher-level picture of the entire workforce in a region and occupation that are available in quantitative data.
The Texas State Technical College’s Center for Employability Outcomes (C4EO) is exploring more systematic ways to collect employer input. It aims to provide colleges with online tools that increase efficiency in gathering and summarizing employer perspectives, reduce the efforts that colleges must devote to engaging employers, and streamline the process for employers to avoid duplicative engagement efforts. For example, C4EO provides a Skills Validation tool, which uses online surveys of individuals in particular occupations to assess the criticality, frequency, and proficiency level required for each skill. Respondents can also submit new skills and edit proposed skills. These tools can be used by higher education institutions to determine whether degree and certificate program curricula are aligned with workforce needs. They may be useful in identifying evolution in occupations and emerging trends in skill needs by the workforce.
Commercial Services for Using Workforce Data
Public agencies such as BLS and TWC make their data available in various formats and provide tools to enable public access to data. But, as we describe further in Chapter 3, institutions and states frequently use commercial services to access and manipulate these public data, as well as non-public data available only through these means. The two services mentioned most frequently in our interviews are Economic Modeling Specialists International (EMSI) and Burning Glass; both attempt to link occupations and degrees to facilitate the use of workforce data. We spoke to representatives of both companies and reviewed the tools they offered.
EMSI
EMSI offers a popular tool to access and manipulate workforce data. EMSI’s Analyst tool builds on the publicly available data from the BLS, the TWC, and other state workforce commissions. These data include projected job openings, earnings, education levels, and other measures by occupation. EMSI’s system allows users to specify any geographic region for analysis, to see estimates of these measures for that region, and to compare estimates with the state or nation as a whole. To support this flexible geographic analysis, EMSI distributes data that is reported at larger regions such as WDAs into any smaller sub-region using population ratios to
Statistical data capture only certain
features of the labor market, so
discussions with employers and other
experts such as professional bodies
play an essential role in providing
context to statistical data and improving
understanding of workforce needs.
allocate the number of jobs. This is a decidedly approximate approach, especially at very small geographic levels such as individual ZIP codes, so users of the data should be cautious in how they use them.
EMSI has extended the CIP-to-SOC crosswalk with additional linkages based on empirical analysis to provide users with more useful links between occupations and fields of study. However, challenges remain in directly linking occupations to degree fields as is done in the EMSI tool. EMSI has also recently added frequency analysis of online job postings that allows users to explore trends in the number of positions posted by occupation and region. As noted previously, there are some important limitations to using job-postings data to measure unmet workforce need.
Burning Glass
Burning Glass also markets a popular tool for analyzing workforce data. The heart of the Burning Glass data is frequency and content analysis of millions of online job postings. The tools allow users to see changes in the rate of job postings by occupation and region. Users also can view the education levels, fields of study, and specific skills and competencies demanded by entry-level positions in each occupation. Our caution on the limitations of job postings data also holds true for the use of Burning Glass.
Summary
In this chapter, we detailed a range of modeling techniques, described some challenges with workforce modeling, and summarized the data sources that are used to estimate workforce needs. In the next chapter, we describe the ways in which these modeling techniques and data sources are currently being used for state, regional, and institutional planning. By describing the current landscape for data use, we can identify areas where the data tools and processes may be improved.
There is a range of ways that workforce data are being used to inform higher education
planning at the state, regional, and institutional levels. To create a new workforce
modeling tool for higher education planning, we must first understand what is currently
being done in Texas and elsewhere, including formal modeling of workforce shortages
and informal use of indicators. By examining current practices, we can identify potential
areas of improvement, ensure that a tool is designed to meet the needs of stakeholders,
and develop recommendations to facilitate use of the tool. In this chapter, we look at
the use of workforce data for state- or regional-level strategic review, as well as for
institutional program planning.
Methodology
State and Regional Use of Workforce Data
We used two different methods to assess the use of workforce data for strategic planning at the state and regional level. First, we spoke with key Texas state policymakers, including staff at the THECB and the TWC. Our interviews with THECB staff helped us to determine how they use workforce data to verify the information provided in program proposals, how workforce need figures in the approval process, and what other efforts THECB undertakes that use workforce data for planning. TWC staff participated in several meetings with the research team to discuss the state’s workforce data collection and analysis of state workforce needs. We also reviewed literature developed by TWC staff to assist in the research process. In addition to examining use of workforce data in Texas, we wanted to look to other states to document the range of practices in using workforce data for higher education planning. We aimed to describe common practices and to identify promising practices that could be adopted in Texas. To determine the workforce data landscape in other states, we first examined the labor market data systems available at the state level using web searches and state agency websites, and we reviewed any recent reports on workforce needs by state agencies across the country. We reviewed modeling methods and use of workforce data for program planning. Following this broad search, we synthesized the information from each state to analyze how workforce data was used to inform decisions made in the labor market. Next, we used this information to understand how state agencies, higher education institutions, and workforce institutions used the available data. This literature review helped us determine how states use workforce data to inform planning of higher education programs.
Institutional Use of Workforce Data
To identify how institutions identify unmet workforce need and use workforce data for program planning, we first reviewed in detail the program proposals submitted over several years for both public two-year and four-year colleges in Texas. These proposals included programs leading to bachelor’s degrees, master’s degrees,
Describing the
Current Practices for
Workforce Data Use
and doctoral degrees. We analyzed these proposals to determine how these institutions identify workforce need in their region as well as in the state. We found common themes in workforce data use from these program proposals.
In addition to analyzing program proposals, we selected a convenience sample of institutions across the state and conducted interviews to ensure a deeper understanding of the types of data institutions are using, the processes by which they are used, the purposes for which they are used, and what additional needs institutions may have to support more effective use of workforce data. We selected institutions based on work and contacts from an earlier project (Daugherty et al., 2014) for the THECB on unmet workforce needs in five occupations, supplementing these selections with recommendations from THECB staff. We interviewed eight individuals across seven institutions, including heads of institutions and other senior institutional leaders. The institutions chosen for interviews were one technical college, three community colleges, and three regional universities.
Limitations
There are several limitations in our methods. Our review of state systems and practices outside Texas is based almost entirely on web searches and examinations of state agency websites, so we may not have captured every aspect of how other states provide and use workforce information. Our analysis of program proposals is limited to those that met the criteria for THECB review, generally meaning that they were either doctoral programs or other program where startup costs exceeded $2 million. Given that they are all successful proposals, we cannot make conclusions about the relationship between the quality of workforce data and program approval. Finally, we interview a limited sample of Texas institutional representatives so we are not able to capture the entire range of practices at all state higher education institutions.
Findings on State and Regional Workforce Data Use for Planning
Use of Workforce Data in Texas
The state of Texas, and in particular the TWC, provides a wide range of workforce data that can be used for strategic planning; we described these data in detail in Chapter 2. The TWC TRACER and SOCRATES tools in particular are viewed as valuable tools for accessing data on the workforce for higher education planning purposes. As described in Chapter 2, these tools provide data on the growth in various occupations and industries and project the current stock of jobs and the flow of new
jobs that are expected. The tools provide data at both the state and regional levels.
Across the state, the Texas Association of Workforce Boards (TAWB) provides economic and workforce data and research for the 28 local Texas workforce boards. The goals of the TAWB are to provide information on the workforce that can help align higher education with workforce needs and to facilitate communication among the Texas business community, educational providers, and state and federal officials (TAWB, 2014). These workforce boards rely on indicators and qualitative discussions with employers to identify areas of need within particular regions and across the state.
The THECB incorporates workforce data into higher education planning in several ways. First, it provides a Regional Plan every two years. The Regional Plan focuses on the 10 higher education regions across the state. Within these regions, the THECB provides analysis on a variety of regional data on supply of and demand for individuals. The detailed analysis of workforce need by occupation or industry relies primarily on demand data