Effect of Pressure and UV Intensity
on the Rheological Cure Profile and
Dimensional Change of Developing
Networks
Rheology is defined as the study of the flow and deformation of fluids. Based on the need to quickly and accurately set and control processing conditions, optimize product performance, and/ or ensure product acceptance, accu-rate rheological measurements have become essential in characterizing materials within analytical laborato-ries. Utilizing rheological measure-ments on new materials, process con-ditions can be determined and final product properties and performance can be predicted.
Rheological properties of systems that undergo a curing process present a challenging and intriguing problem to measure accurately. Zhang et al.1 explain that this is due to several fac-tors, including the kinetics of the reac-tions, the building of the structure, and heat transfer considerations. The kinet-ics of the systems can be a significant effect due to the time scale at which these systems undergo the curing pro-cess. The development of structure or the evolution of a networked system, which in turn can lead to shrinkage or expansion and/or other changes in the physical appearance of the sample, can present several difficulties in mea-suring the rheological properties accu-rately. The ability to measure and fully understand these phenomena becomes a requirement within the industry to accurately characterize and/or process these materials.
Through an accurate measure of the rheological properties of these systems, both design and optimization of the processes that use these systems can be done. This design and optimization lead to flow models that allow a user who knows the rheological properties of the systems to predict the final
prop-erties of their product. As an example, Gendron and Champagne2 described how different blowing agents formed very different structures within poly-mer systems. They described how some of these could act as plasticizing agents, which greatly affect the rheo-logical properties of these materials. The development of network systems has been discussed previously by many authors, including Colo et al.3 and Herh et al.,4 who described the effect of the development of these networks during both thermal curing and curing via ultraviolet (UV) radiation. Spe-cifically studied were 1) the effect of shrinkage; and 2) how rheometers can be used to probe the thermal transi-tions, including the final cure time and the shrinkage, or change in shape dur-ing UV radiation. This paper expands the study by Colo et al.3 by adding the effects of pressure to the thermal cur-ing discussion. The additional vari-able of pressure can greatly affect the curing process, both with respect to time and changes in physical appear-ance. In addition, the effect of varying the UV dose using a new-style light-emitting diode (LED) source with pro-grammable intensity is included in the UV curing discussion.
Samples
A low-density polyethylene (LPDE) resin, in pellet form, compounded with both blowing and curing (cross-linking) agents was evaluated. For this thermally activated system, a pat-ented Sealed Cell (REOLOGICA Instruments, Lund, Sweden) is used to apply overpressure up to 90 psia. This system not only cures, but also under-goes structural changes during the cur-ing process due to the presence of the
blowing agent. The sample studied develops a network that greatly alters its rheological properties. For the UV section, a clear and colorless, low-vis-cosity fiber-optic coating with the pho-toinitiator centered on a wavelength Figure 1 Instrumentation: a) NOVA rheometer, b) ETC-3 environmental cell with Joule-Thomson Effect, and c) Sealed Cell with parallel plate tool.
a
b
of 405 nm was evaluated. For this sys-tem, a narrow-bandwidth LED source having a wavelength of 405 nm ±10% with a programmable intensity from 1 to 100 mW/cm2 was used.
Instruments
A REOLOGICA Instruments NOVA rotational rheometer was used to measure the real-time rheo-logical properties. Figure 1 shows the NOVA rheometer and accessories used in the thermal curing experi-ments, while Figure 2 shows the rhe-ometer for the UV curing experi-ments. Figure 1b shows the ETC-3 Joule-Thomson Effect temperature cell used for the atmospheric pres-sure experiments. Figure 1c shows the Sealed Cell with the parallel plate geometry used to perform the thermal curing experiments under vacuum and varying overpressure levels. Fig-ure 2a shows the NOVA rheometer equipped for UV measurements using
a Honle (Marlboro, MA) broad-band UV source and accompanying water light guide used in the previous investigation by Colo et al.3 Figure 2b shows a Digital Light Lab (Knox-ville, TN) narrow- bandwidth LED source attached to the rheometer directly beneath the test sample (no light guide is required). The intensity level and exposure profile can be set through the software, and the actual dose is monitored at the LED head and adjusted in real time to match the preprogrammed values. A propri-etary “Fast Oscillation” data acqui-sition algorithm was used to collect data at rates in excess of 500 points per second.
Thermal curing
For the thermal curing, the NOVA rheometer was utilized with two dif-ferent environmental cells: the ETC-3 Joule-Thomson Effect cell based on the resistive heating and the cooling produced by the rapid expansion of air to allow for temperatures down to –20 °C, and the Sealed Cell for overpres-sure meaoverpres-surements. The Sealed Cell also uses Joule-Thomson Effect heat-ing/cooling. The Sealed Cell allows for measurements from vacuum to more than 100-psia overpressures without the use of bearings and/or magnetic coupling to the drive motor. This is accomplished by the use of an air-bear-ing seal around the upper tool, where the upper tool is directly fastened to the drive motor. This patented design supports both cup and bob and parallel plate measuring systems.
To standardize the thermal cure testing, all the experiments performed employed a 25-mm parallel plate measuring sys-tem. Also, the initial gap for all the experiments was set to 1.000 mm. Contained within the LDPE pellets are both a blowing agent that initi-ates at approximately 120 °C, and a curing agent that initiates at 170 °C. For all experiments using the ETC-3 system, the LDPE pellets were placed on the lower plate, which had equil-ibrated at a temperature of 100 °C. The sample was then allowed to come to temperature before the upper plate was lowered to a distance of 1.100
mm above the lower plate under a controlled loading of 10 N. At this point, the excess sample was trimmed from the parallel plate geometry, and the geometry was brought to a gap of 1.000 mm. The normal force was allowed to dissipate to a value below 2 N, and then a final equilibrium of 60 sec was observed before the experi-ment initiated. For all the experiexperi-ments utilizing the Sealed Cell, samples were first prepared using the ETC-3 pro-cedure noted above, and then the molded samples after trimming were transferred at room temperature to the Sealed Cell for the measurement. For all experiments presented, the temperature was ramped from 100 to 180 °C while the rheological proper-ties were measured in a small ampli-tude oscillatory shear (SAOS) mode. The test conditions for this SAOS experiment were a frequency of 1 Hz and a stress of 100 Pa. This stress was chosen to be within the linear vis-coelastic (LVE) region of the sample. The LVE is analogous to the linear portion of a stress/strain curve, and is the region of deformation where the sample can fully recover without per-manent set. Through RheoExplorer’s “Expert Condition” software setting (REOLOGICA Instruments), the instrument was allowed to change the gap (autotension) once the nor-mal force of the sample had reached a value of 3 N. After this point, the gap was altered to keep the normal force at a value of 0.2 N. During the foam-ing process, the sample expands in volume, thus exerting a normal force on the system. The rheometer actively opens the gap to maintain a low nor-mal force value, and the gap achieved is thus a measure of the volume of the expanded foamed sample.
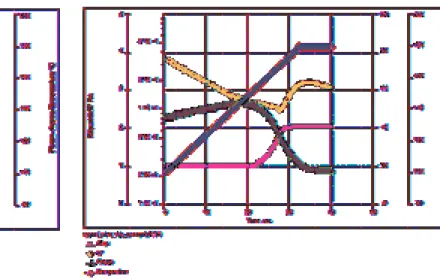
To set a baseline for the effect of vac-uum and overpressure on the cure pro-file, two experiments were performed on the ETC-3 open cell. The first of these experiments was performed at a ramping rate of 5 °C/min. The rheo-logical properties of interest in this set of experiments are 1) the gap (i.e., height of the sample), 2) the elastic modulus (G′), 3) the temperature showing the rate at which the sample was heated as well as the temperature Figure 2 Instrumentation: a)
STRESSTECH rheometer (REOLOGICA Instruments) showing setup of a broadband UV source, and b) narrow-bandwidth LED UV source mounted directly beneath the sample on the NOVA rheometer.
a
at the onset of expansion and curing, and 4) the phase angle. Figure 3 shows the results from this experiment. It is important to note that the phase angle starts to decrease toward a value of 0° at a time of 11 min, correspond-ing to a temperature of 150 °C. At this point, the sample is becoming a more solid-like structured material due to the inclusion of void spaces within its structure (note this is above the blow-ing agent’s initiation temperature of 120 °C) and once the sample reaches a temperature of 180 °C, the expan-sion slows and finally stops. This slow-ing of the expansion is due to the ini-tialization of the cross-linking agent curing the sample.
To show whether or not the tempera-ture ramp is sufficiently slow to cap-ture the true curing characteristics, a second experiment with the ETC-3 was performed at a reduced heating rate of 2.5 °C/min. This second exper-iment is shown in Figure 4. These results show that the gap rises to a value of 2.085 mm, which is greater than the final gap of 1.950 mm in the previous experiment. Since the system was given more time between the onset of the blowing agent and the onset of the curing agent, it allowed the material to expand more, and confirmed in the previous experiment that the blowing agent was not fully uti-lized. However, the effect is small, indicating that the temperature
ramp used was slow enough for the processes involved.
Next, to investigate the effect of vac-uum and overpressure, five different experiments were performed using the Sealed Cell. The first was at an overpressure of 21 psia. This condi-tion was chosen to emulate the ETC-3 experiment with the Sealed Cell. The 21-psia overpressure was used to lubricate the air-bearing of the Sealed Cell. This was followed by experi-ments at 40, 65, and 90 psia. All of these experiments are summarized in
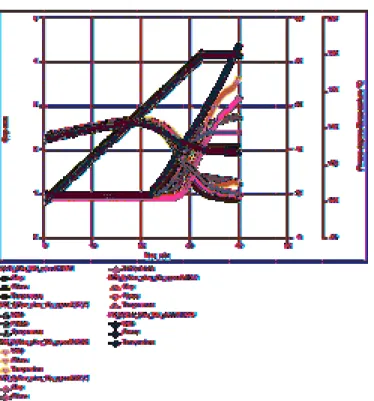
Figure 5. The variable of interest is the final gap, which is higher in all the Sealed Cell experiments than those of the open cell. The difference at 21 psia is due to the expansion of the sample being restricted in the hori-zontal direction to 27.5 mm in the Sealed Cell where the expansion had to occur in a more vertical direction.
Table 1 summarizes the temperature at the onset of the autotension feature and the final height of the sample for all experiments conducted.
From Table 1, the results from the ETC-3 and the Sealed Cell at low pressure (21 psia) are similar, with the Sealed Cell being slightly higher due to the horizontal restriction. In the Sealed Cell, the onset tempera-ture varies directly with the overpres-sure. As the overpressure increases, the boiling point of the blowing agent increases, thus increasing the temper-ature for the onset of the expansion. Initially, it may seem surprising that the final volume rises with over pressure. Expanding against an overpressure should ostensibly lead to lower final volume. However, based on this being a temperature ramp experiment and, more importantly, the blowing agent’s increased effectiveness with increased temperature, along with a decrease in the sample’s viscosity, enhance the expansion process. However, the final volume was not coincident with over-pressure. This is due to the competing effect of the curing reaction and the blowing agent, and which is the con-trolling resistance under different cure Figure 3 Blowing and curing profile in an open cell at a frequency of
1 Hz, stress of 100 Pa, and heating rate of 5.0 °C/min. Figure 4 1 Hz, stress of 100 Pa, and heating rate of 2.5 °C/min.Blowing and curing profile in an open cell at a frequency of
Table 1 Expansion results summary of the LDPE sample
Open cell Open cell 21 psia 40 psia 65 psia 90 psia 7 psia
Ramp rate 5 2.5 2.5 2.5 2.5 2.5 2.5 (°C/min) Temperature 160.1 154.4 156.7 160.7 165.6 168.0 153.6 of onset (°C) Final height 1.950 2.085 2.398 2.771 3.603 3.175 4.370 (mm)
conditions. The curing agent initiates at fixed temperature, and the reac-tion is not dependent on overpressure. Since the blowing agent initiates at a higher temperature due to overpres-sure, the sample has less time to expand before the cure process takes control of the rheology.
Under a vacuum of 7 psia, the material is able to expand well beyond the pres-surized systems. Also, from the phase angle, we can see that the material does not become as solid-like as the pressurized experiments. This could also lead to the ability of the sample to expand to a greater final height. As shown in Figure 5, the 7-psia experi-ment does not reach a constant gap with respect to time. This is believed to be due to the pressure affecting the cross-linking mechanism. This has been documented in the literature by Andrews et al.5
UV radiation curing
The effect of different intensities of UV radiation on the cure profile was investigated. A UV active material with the photoinitiator centered on a
wavelength of 405 nm was tested at a constant gap and temperature to study the effect of intensity. For this study, intensities of 1, 5, 10, 25, 50, and 100 mW/cm2 were investigated. For all experiments shown, the UV source was activated 4 sec into the experi-ment so that a “no-exposure” baseline could be obtained. The sample was clear and colorless so that it would not hinder the transmittance of the UV light through the sample.
For all experiments, the sample was placed on the lower plate at room temperature and the gap was set to 0.300 mm. As with the thermal curing experiments, the “Expert Condition” setting within the RheoExplorer soft-ware package was used to control the gap during the experiment. The auto-tension feature was turned on once the phase angle of the sample reached a value below 45°. A phase angle of 45° was selected because the sample does not undergo consolidation until the gel point is reached. If the shrinkage is not accounted for in real time during the experiment, unwanted stresses can be built up in the sample, and delami-nation from the plates may occur.
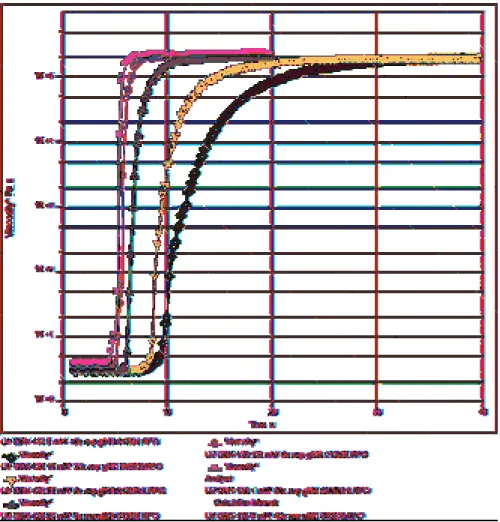
The cure profiles are shown in Figure 6. The first observation is the signifi-cant difference between the intensity of 1 mW/cm2 and all the other intensi-ties. For the intensity of 1 mW/cm2, the material was exposed for over 20 sec before any noticeable curing had taken place. Also, the time to full-cure for the 1-mW/cm2 experiment is approximately 100 sec. This is sig-nificantly longer than all other inves-tigated parameters. The results show that a UV intensity of 1 mW/cm2 is not reasonable for this system.
To further analyze the results from the higher intensities, the data are replot-ted on a shorter time scale in Figure 7 to distinguish differences. Figure 7 shows that, as the intensity of the LED UV source is increased, the time of the initiation of the curing process decreases, as well as the time to a full cured state. There is little difference between the curing profiles for the intensities of 50 and 100 mW/cm2, and thus it can be concluded that the maximum intensity required to fully cure this material is 50 mW/cm.2 Any value that is greater does not produce a beneficial effect.
Figure 5 Blowing and curing profile in the Sealed Cell at various pressures (open cell, 21 psia, 40 psia, 65 psia, 90 psia, and 7 psia) at a frequency of 1 Hz, stress of 100 Pa, and heating rate of 2.5 °C/min.
Figure 6 Curing profile with a 405-nm LED UV source at various intensities.
To further illustrate the effect of the intensity of the radiation on the curing time of this material, Figure 8 plots the time for the curing specimen to reach a viscosity of 180,000 Pa*s versus the intensity of the ultraviolet radiation used. From Figure 8 it can be seen that there is a significant difference with small changes in the intensity
at the low range, with the time to reach a viscosity of 180,000 Pa*s approaching infinity as the intensity goes to zero. Similarly, it is seen that above an inten-sity of 50 mW/cm2 no signifi-cant gain is seen in the time to a viscosity of 180,000 Pa*s.
Conclusion
Significant differences in both the amount of expansion and the onset of the blowing agent as well as the function of the curing agent were seen between the ETC-3 (open cell) and the experi-ments conducted under overpressure and vacuum in the Sealed Cell. Considerable differences in cure profile were also observed for a fiber-optic coating sample exposed to UV radiation from a programmable LED
source. An intensity of 1 mW/cm2 showed poor cure characteristics when compared to intensities of 5 mW/cm2 and higher. Also, there was no significant difference between 50 and 100 mW/cm2, suggesting that 50 mW/cm2 is the intensity of saturation for this material.
Both results show that the NOVA rheometer with the ETC-3, patented Sealed Cell, and UV cell with pro-grammable UV source can easily and routinely measure the rheology and cure profile of materials under atmo-spheric, overpressure, and vacuum conditions. Further work performing UV curing under pressure is planned.
References
1. Zhang, X.D.; Giles, D.W.; Barocas, V.H.; Yasunaga, K.; Macosko, C.W. Measurement of foam modulus via a vane rheometer. J. Rheology Jul/Aug
1998, 42, 871.
2. Gendron, R.; Champagne, M.F. Effect of physical foaming agents on the vis-cosity of various polyolefin resins. J. Cellular Plastics Mar 2004, 40, 131. 3. Colo, S.M.; Herh, P.K.W.; Klein, F.;
Hedman, K. Fast oscillation rheologi-cal data analysis for real-time cure profiling and shrinkage determination of developing network systems. Am. Lab.News2004, 36(13), 14.
4. Herh, P.K.W.; Colo, S.M.; Enns, J.; Roye, N.; Hedman, K. Rheology of developing network systems: new techniques, capabilities, and instru-ments. Am. Lab.News2001, 33(13), 34.
5. Andrews, T.; Hampton, R.N.; Smed-berg, A.; Wald, D.; Waschk, V.; Weis-senberg, W. The role of degassing in XLPE power cable manufacture. IEEE Electrical Insulation Mag. Nov/Dec
2006, 22(6), 5.
Dr. Tatum and Dr. Dao are with REOLOGICA Instruments, 231 Cross-wicks Rd., Bordentown, NJ 08505, U.S.A.; tel.: 609-298-2522; fax: 609-298-2795; e-mail: [email protected]; www.reologicainstruments.com. Mr. Roye is with REOLOGICA Instruments, Val-ley Village, CA, U.S.A. Dr. Hedman is with REOLOGICA Instruments, Lund, Sweden. Figure 7 Curing profile with a 405-nm LED UV source at various intensities (same as Figure
6 with expanded time scale).
Figure 8 Time to reach a viscosity of 180,000 (Pa*s) as a function of intensity (mW).