Validation of the new HelioClim-3 version 4 real-time
and short-term forecast service using 14 BSRN stations
Claire Thomas, Laurent Saboret, Etienne Wey, Philippe Blanc, Lucien Wald
To cite this version:
Claire Thomas, Laurent Saboret, Etienne Wey, Philippe Blanc, Lucien Wald.
Validation
of the new HelioClim-3 version 4 real-time and short-term forecast service using 14 BSRN
stations. Advances in Science and Research, Copernicus Publications, 2016, 13, pp.129-136.
<
10.5194/asr-13-129-2016
>
.
<
hal-01349689
>
HAL Id: hal-01349689
https://hal-mines-paristech.archives-ouvertes.fr/hal-01349689
Submitted on 28 Jul 2016
HAL
is a multi-disciplinary open access
archive for the deposit and dissemination of
sci-entific research documents, whether they are
pub-lished or not.
The documents may come from
teaching and research institutions in France or
abroad, or from public or private research centers.
L’archive ouverte pluridisciplinaire
HAL
, est
destin´
ee au d´
epˆ
ot et `
a la diffusion de documents
scientifiques de niveau recherche, publi´
es ou non,
´
emanant des ´
etablissements d’enseignement et de
recherche fran¸
cais ou ´
etrangers, des laboratoires
publics ou priv´
es.
European
Conf
erence
on
Applications
of
Meteorology
(ECAM)
1Transvalor S.A., Mougins, France
2MINES ParisTech, PSL Research University, Sophia Antipolis, France
Correspondence to:Claire Thomas ([email protected])
Received: 15 January 2016 – Revised: 24 May 2016 – Accepted: 27 May 2016 – Published: 27 July 2016
Abstract. Meteosat Second Generation (MSG) satellite images acquired every 15 min during daytime are cur-rently processed by the Heliosat-2 method every night to generate the HelioClim-3 (HC3) database of the surface solar irradiation for the day before. A new service is proposed based on version 4 of HC3 (HC3v4) that offers real-time and forecasted irradiation for horizons up to a few hours. The service is based on a local persistence of the clear-sky index. Its results were compared to coincident high quality 15 min global irradiations measured in fourteen stations belonging to the Baseline Surface Radiation Network (BSRN). For forecasts for a temporal horizon of 15 min ahead, the relative bias and root mean square error (RMSE) range respectively from 0 to 2 %, and 20 to 23 % for most stations. The correlation coefficient ranges from 0.94 to 0.95. These performances are similar to HC3v4 for the same stations. Expectedly, the quality of the forecasts degrades as the temporal horizon increases. For 1 h ahead forecasts of 15 min irradiation, the relative bias, root mean square error (RMSE) and correlation coefficient range respectively from−3 to 1 %, 30 to 37 %, and 0.90 to 0.91.
1 Introduction
The knowledge of the solar potential of a site or an area is essential for many applications; for instance, this ensures a good return on investment for the photovoltaic and con-centrated solar power plants, but this is also important for other domains of application, such as agriculture, health... Satellite-derived surface solar irradiation (SSI) databases, such as HelioClim-3 (HC3), have already demonstrated their ability to supplement ground station measurements by pro-viding a long-term archive of irradiation values over a large area and on a regular grid (Lefèvre et al., 2014).
The SoDa Service (www.soda-pro.com) is a one-stop ac-cess to many different resources and Web services related to solar energy (Gschwind et al., 2006). The SoDa Service is populated by different SSI databases, such as the succes-sive versions of HC3. The two most advanced versions of HC3 are version 4 (HC3v4) and version 5 (HC3v5), which differ by the clear sky model exploited to derive SSI (Qu et al., 2014). The latest version HC3v5 is exploiting the Mc-Clear model (Lefèvre et al., 2013), and is the most advanced
and most accurate version (Eissa et al., 2015; Thomas et al., 2016a, b).
Needs were expressed by users for a real-time and forecast capability for horizons up to a few hours. Though McClear itself may be used in forecasting mode (Lefèvre et al., 2013), its inputs as used in HC3v5 are only available with a delay of 2 days, which makes impossible so far the creation of a real-time and short-term forecast service based on HC3v5. The current HC3v4 service did not have such a built-in capability either. Meteosat Second Generation (MSG) satellite images acquired every 15 min during daytime via the EumetCast sys-tem are processed by the Heliosat-2 method (Rigollier et al., 2004) every following night to generate the HC3 database. All valid images of the day are necessary to perform the method as temporal interpolation may occur to eliminate ef-fects of gaps due to missing images.
A service having real-time and forecast capability for hori-zons up to a few hours would help in managing photovoltaic plants and intelligent buildings, and would potentially in-crease their return on investment. This paper presents such a service based on HC3v4. The technical challenge was
130 C. Thomas et al.: Validation of the new HelioClim-3 version 4
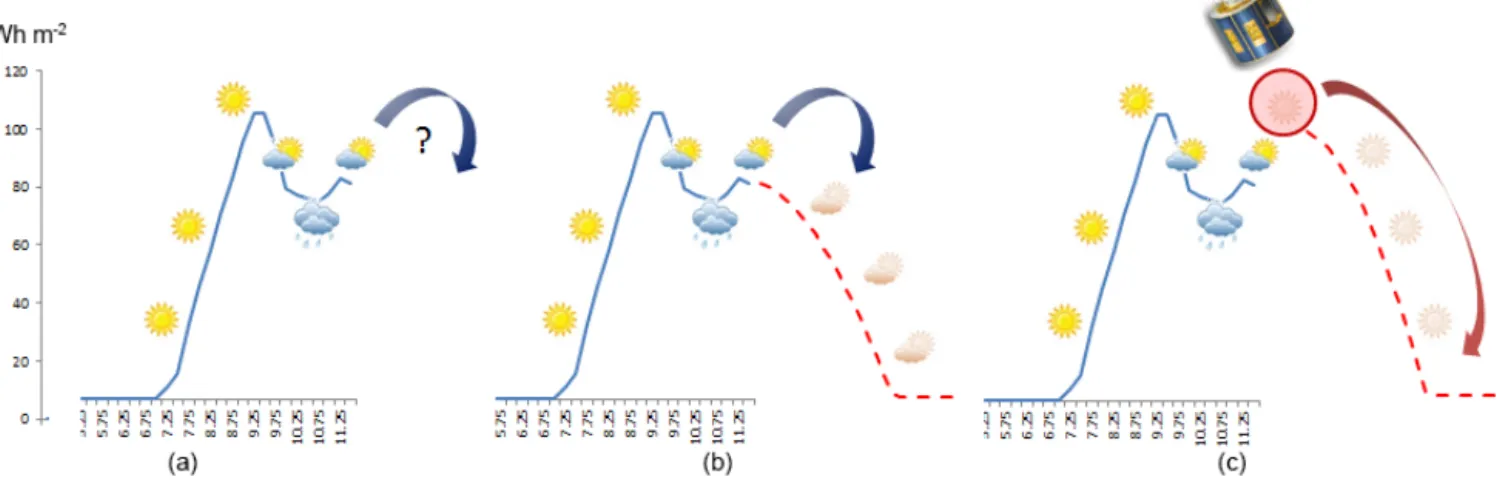
Figure 1.Illustration of the principle of the HC3v4 real-time and short-term forecast method.
twofold: on the one hand, the method should be fast enough to enable the processing of large areas in real time, i.e. in a few minutes after the image acquisition. On the other hand, its outputs should be such as they can be directly ingested in the own processes of the customers. The paper describes the method developed to provide HC3v4 real time and short-term forecasts irradiations until the end of the current day. A procedure in two successive steps was adopted for the valida-tion of the service. It has been first tested by fifteen users for about one month in April 2015 with the aim of assessing the fitness-for-use. Then, a scientific assessment of the perfor-mances of this new service was carried out by a back testing approach or hindcasting. In this approach, images for a past period were input to the method and the outputs were com-pared to coincident high quality measurements of the global irradiation received on a horizontal surface (GHI) performed at fourteen stations belonging to the Baseline Surface Radia-tion Network (BSRN).
2 The HC3v4 real-time and short-term forecast service
The HC3 database stores 15 min GHI values estimated from MSG imagery since the first MSG satellite has been oper-ational in February 2004. HC3v4 exploits the ESRA clear-sky model (Rigollier et al., 2000) with the climatological database of the Linke turbidity factor of Remund et al. (2003) as input. This database is composed of one value per day over one year and on a grid every 5’ of arc angle both in latitude and longitude. 5’ of arc angle represents approximately 9 km along a longitude. As there is no update of this Linke turbid-ity factor, HC3v4 may fail in correctly predicting the actual atmospheric content and possible changes in SSI due to local effects such as maritime inputs, volcanoes, fires, evolution of the water vapour content, pollution...
The HC3v4 archive is available on the MSG area, from February 2004 up to day-1. The Heliosat-2 method is
ap-plied only for solar elevation angles above 12◦. Since 2015, a new service has been developed, called HC3v4 real-time and short-term forecast service. It is abbreviated inHC3v4 forecastin the following. Its principle is the persistence of the clear-sky index Kc, defined as the ratio of the GHI to the GHI in clear-sky conditions, i.e. cloud-free conditions. Figure 1 illustrates this principle by giving an example of 15 min slots available until 11:25 a.m. (Fig. 1a) for a given dayd. The last slot available indicates half cloudy half sunny weather; the main assumption of the persistence states that the same type of weather will be available until the end of the current day, modulated by the sun position (Fig. 1b), i.e.
Kcwill be the same as the past instant. Then, a new MSG im-age is acquired, and the weather is nicer than planned 15 min ago. The forecast is consequently adjusted (Fig. 1c). Every 15 min, the service provides the data until the end of the day, with estimates based on all the slots available until the cur-rent instant, and forecasts based on local persistence after-wards. Each received MSG image is processed with the same method Heliosat-2 and same inputs than for HC3v4 but in real time and with a limitation of 1◦for the solar elevation
angle instead of 12◦.
3 Validation against measurements from fourteen BSRN stations
3.1 Brief overview of the stations and quality control
The short-term forecasts provided by the service are com-pared to the observations of several BSRN stations for dif-ferent temporal horizons. BSRN is a collection of measure-ments of GHI, diffuse irradiations on horizontal surface, and direct irradiations over a normal plane (DNI) of high quality suitable for validation (König-Langlo et al., 2014; Ohmura et al., 1998; Roesch et al., 2011a, b). Measurements are ac-quired every 1 min. Figure 2 and Table 1 give the locations and the main characteristics of the fourteen BSRN stations
Sao Martinho da Serra Brazil −29.443 −53.823 489 2006-01-01 to 2012-12-31 De Aar South Africa −30.667 23.993 1287 2004-02-01 to 2005-12-31
Figure 2.Locations of the fourteen BSRN stations.
used for the quality assessment of the data, located in the MSG coverage. The last column of Table 1 gives the periods of data used in this evaluation.
Prior to the comparison at different summarizations, a thorough quality check procedure has been applied onto the 1 min BSRN data as recommended by WMO (1981). The major steps can be summarized as follows:
– Set night, sunrise and sunset values, i.e. when the solar elevation angle is less than 1◦, to zero,
– Discard values beyond “extremely rare limits” and “physical possible limits”,
– Perform the consistency checks when the three radiation components are available.
Then, a temporal aggregation was performed to generate the values at the different summarizations. This procedure is of utmost importance since it directly impacts the validation re-sults. Our approach was as follows:
– Fill the 1 min gaps by interpolating the irradiation val-ues taking into account the sun position at each instant. Then generate the 15 min irradiation from the 1 min BSRN measurements if at least 85 % of the slots were available before interpolation. Compute the quantities summarizing the deviation at 15 min,
– Generate the hourly, daily and monthly irradiation by summing up the 15 min irradiation if at least respec-tively 75, 65 and 50 % of the slots are available. No tem-poral interpolation is applied, leading to partial sums. Compute the quantities summarizing the deviation at the hourly, daily and monthly time steps.
3.2 Protocol of evaluation
This section describes the protocol for the comparison of the short-term forecasts to coincident high quality irradiations measured in the fourteen stations.
Estimates were set to “Not a Number” (NaN) when the measurements were missing, and reciprocally. In this way, the data sets contain the same number of data with coinci-dence in time. Then, both the estimates and the observations were aggregated to generate the data at the different summa-rizations for comparison.
Among all the statistical quantities that can be computed to assess the deviation between two datasets, we selected the
132 C. Thomas et al.: Validation of the new HelioClim-3 version 4
Figure 3.Daily profiles of 15 min GHI values of the measurements (black line), the 15 min ahead forecasts (blue line) and 1 h ahead forecast (green line) at Carpentras for 27 March 2007.
bias, and the bias relative to the mean of the observation in percent, also named relative bias, and the root mean square error (RMSE), and relative RMSE in percent, and the corre-lation coefficient (correl. coeff.). These quantities were com-puted for the GHI, and for:
– different time steps: 15 min, and partial hourly, daily and monthly time steps,
– different temporal horizons: 15, 30 min, 1, 2, 4, and 6 h. For the sake of conciseness, all results are not provided here. The Tables A1 and A2 relative to the statistics for the 15 min GHI, for temporal horizons of 15 min and 1 h have been placed in Appendix. All the other figures are visible at: http://www.soda-pro.com/soda-products/ by selecting the “HC3 time series in real time” service.
3.3 Interpretation of the validation results
The validation results are summarized in the Table 2. It presents the range of the relative bias, relative RMSE and correlation coefficient for the fourteen stations. The “Av” col-umn is the range of the most often found values. The new method based on the persistence ofKcexhibits satisfactory results for temporal horizons of 15 min and 1 h.
The quality of the 15 min irradiation forecasted 15 min ahead is comparable to that obtained for the archived HC3v4 data (Eissa et al., 2015; Thomas et al., 2016a, b). As a conse-quence, the assumption of persistence of the current weather for the next instant of acquisition is plausible.
For 1 h ahead, the bias does not evolve much, and thus no trend of errors is introduced by the method. The RMSE increases which means a higher spreading of the data, and
Figure 4.Daily profiles of 15 min GHI of the measurements (black line), the 15 min ahead forecast (blue line) and 1 h ahead forecast (green line) at Carpentras for 14 May 2004.
thus an increased difficulty of the method predicting the cor-rect weather when increasing the temporal horizon. This is confirmed by slightly lower correlation coefficients. Expect-edly, this tendency keeps growing with the increasing tempo-ral horizons.
Figure 3 supports this last remark. It exhibits the 15 min GHI values for 27 March 2007 at Carpentras. The black, blue and green lines correspond respectively to the in-situ mea-surements, the forecasts 15 min ahead and those 1 h ahead. The weather for this day is clear at the beginning and end of the day, with a cloudy event occurring at mid-day. The blue line is most often very close to the black line, demonstrating the accuracy of the 15 min ahead forecast in this case. The green line is in full agreement with the black line at the be-ginning and the end of the day, i.e. when the sky is clear and the persistence assumption is true. Otherwise, the green line has the same shape than the black one but with a time-lag of 1 h. This observation is fully consistent with the persis-tence assumption. The difference between the blue and green lines demonstrates the increasing difficulty of the method in correctly assessing the radiation when the temporal horizon increases.
Figure 4 exhibits the same type of plots but for a perfectly clear sky day, on 14 May 2004. The persistence assump-tion is clearly valid in this case. Consequently the method faces no difficulty in estimating the next slot based on the previous one whatever the temporal horizon. That is why the three lines are almost superimposed, except for the first 1 h ahead forecasts which should wait for the first estimated hourly irradiation to provide the next one, creating this step at 05:00 UT on the green line.
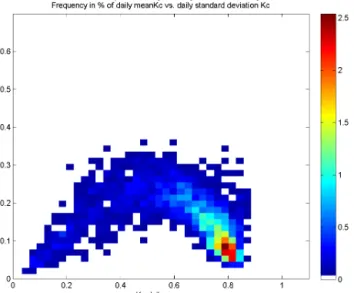
Figure 5.2-D histogram of the daily mean ofKcon the horizontal axis and the daily standard deviation ofKcon the vertical axis for Carpentras. The frequency in percent is coded in colour with the scale given on the right.
Figures 3 and 4 demonstrate that the method has more dif-ficulty in forecasting SSI in cloudy situations. This point co-incides with the greatest RMSE obtained for Brazilian sites located in tropical areas (between 20–23 Wh m−2for 15 min horizon, and 25–27 Wh m−2for 1 h horizon). In particular, Brasilia experiences numerous storms with heavy rain falls during the rainy season, from April to October, i.e. for more than half of the year. RMSE are also greater for cloudy sites in Europe than for the other European sites. Nevertheless, we should also point out that the relative error is high for the northern stations because the mean of the irradiation is very low.
Figures 5 and 6 illustrate the link between the performance of the method and the temporal variability of the radiation. Figure 5 exhibits a 2-D histogram of the daily mean ofKc
on the horizontal axis and the daily standard deviation ofKc
on the vertical axis for Carpentras. The frequency in percent is coded in colour with the scale given on the right. Red and brown small squares close to a mean value ofKcof 0.8 means that there is a large frequency of clear-sky conditions. On the opposite, there are few overcast situations with Kcless than 0.2. One notes the arch shape of this 2-D histogram.
Ex-Figure 6.2-D histogram of the daily mean ofKcon the horizontal axis and the daily standard deviation ofKcon the vertical axis for Brasilia. The frequency in percent is coded in colour with the scale given on the right.
pectedly, the left part exhibits small variability: for a given
Kcduring an overcast day (Kc≤0.2), the range of observed standard deviation is small: between 0.05 and 0.2. This range cannot be large because the hourly irradiation, henceKc, is small in these conditions. The right part exhibits highKcwith fairly low variability of the standard deviation ofKcduring each day. Actually, the intra-day variability ofKcfor Car-pentras is usually low for clear-sky conditions. This means that quite often a highKcmeans an entire cloud-free day at Carpentras.
Figure 6 exhibits the same graph but for Brasilia. One ob-serves a similar shape but the values are more spread. For anyKc, there is a large scattering of the observed standard deviations. There are more cases of mid-values ofKcthan in Carpentras. There is also a very large spread of the stan-dard deviations for highKcwhich means that there are many days where the cloud-free conditions prevail but with appear-ance of clouds. This alternation of cloud/no-cloud situations makes an accurate forecast more difficult than in the case of Carpentras.
A final remark on these validation results is that, despite good RMSE and correlation coefficient, the method tends to
134 C. Thomas et al.: Validation of the new HelioClim-3 version 4
underestimate the values for Sede Boqer. It appears that the satellite-derived databases have some problems to capture the actual content of the atmosphere in clear sky conditions for this specific location and this explains this observation.
4 Conclusions and perspectives
A new service has been presented to provide satellite-based irradiation values in real time, i.e. following the MSG im-age acquisition, and short-term forecasts until the end of the current day. The results of the validation demonstrated that though very simple from a scientific point of view, this method is adequate and reliable enough to build a sustainable value-added service based on this service.
A pre-operational version of the service was tested by 15 users for approx. one month in April 2015. They assessed the benefits of this new service in their daily work. The over-all conclusion from this users’ survey was very positive. The feedback and returns on experience of the different testers enabled the refinement of the service, which is fully opera-tional since July 2015. In particular, the whole SoDa infras-tructure has been duplicated to ensure more robust service to users. So far, five customers have purchased this service and are satisfied with the supplied data. Among them, three were testers during the test period.
5 Data availability
– BSRN Baseline Surface Radiation Network Data Sets: König-Langlo, G., Bücker, A., Richter, F., and Sieger, R., doi:10.1594/PANGAEA.833428.
– Meteosat images: available at www.eumetsat.eu.
– HelioClim-3 and forecasts: available in CSV format for the stations listed in this article by request to Claire Thomas.
Carpentras 164 106 94.4 1.1 (1 %) 17.2 (18 %) 0.969 Cener 57 978 87.8 2.1 (2 %) 21.3 (24 %) 0.951 Sede Boqer 128 436 133.3 −8.8 (−7 %) 20.3 (15 %) 0.971 Tamanrasset 162 628 133.0 0.9 (1 %) 23.6 (18 %) 0.958 Brasilia 87 218 115.1 5.5 (5 %) 38.5 (33 %) 0.879 Sao Martinho da Serra 99 160 105.2 −0.3 (0 %) 26.7 (25 %) 0.942 De Aar 14 635 129.3 0.0 (0 %) 21.2 (16 %) 0.962
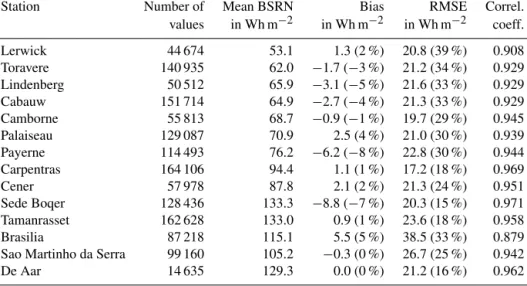
Table A2.Validation results for the 15 min GHI for a temporal horizon of 1 h. In parentheses, relative values.
Station Number of Mean BSRN Bias RMSE correl. values in Wh m−2 in Wh m−2 in Wh m−2 coeff. Lerwick 43 609 54.2 1.1 (2 %) 25.5 (47 %) 0.860 Toravere 136 252 63.9 −1.8 (−3 %) 25.5 (40 %) 0.897 Lindenberg 48 436 68.4 −3.1 (−5 %) 27.5 (40 %) 0.884 Cabauw 145 843 67.2 −2.9 (−4 %) 27.5 (41 %) 0.879 Camborne 53 778 71.0 −1.1 (−2 %) 26.1 (37 %) 0.902 Palaiseau 124 002 73.5 2.7 (4 %) 27.7 (38 %) 0.892 Payerne 109 266 79.4 −6.3 (−8 %) 28.7 (36 %) 0.905 Carpentras 156 704 98.4 1.0 (1 %) 23.5 (24 %) 0.940 Cener 55 275 91.6 1.6 (2 %) 27.1 (30 %) 0.918 Sede Boqer 120 994 140.7 −10.3 (−7 %) 25.0 (18 %) 0.950 Tamanrasset 152 803 140.7 0.9 (1 %) 28.6 (20 %) 0.932 Brasilia 82 044 121.4 6.2 (5 %) 43.1 (36 %) 0.838 Sao Martinho da Serra 94 284 110.1 −0.4 (0 %) 33.0 (30 %) 0.908 De Aar 14 075 133.9 −0.3 (0 %) 27.2 (20 %) 0.934
136 C. Thomas et al.: Validation of the new HelioClim-3 version 4
Acknowledgements. The research leading to these results has been partly undertaken within the Task #46 of the Solar Heating and Cooling Implementing Agreement of the International Energy Agency. It has received funding from the French Agency ADEME, research grant no. 1105C0028. The authors thank all ground station operators of the BSRN network for their valuable measurements and the Alfred-Wegener Institute for hosting the BSRN website. Edited by: S.-E. Gryning
Reviewed by: P. Lauret and one anonymous referee
References
Eissa, Y., Korany, M., Aoun, Y., Boraiy, M., Abdel Wahab, M., Al-faro, S., Blanc, P., El-Metwally, M., Ghedira, H., and Wald, L.: Validation of the surface downwelling solar irradiance estimates of the HelioClim-3 database in Egypt,Remote Sensing, 7, 9269– 9291, 2015, doi:10.3390/rs70709269, 2015.
Gschwind, B., Ménard, L., Albuisson, M., and Wald, L.: Converting a successful research project into a sustainable service: the case of the SoDa Web service, Environ. Modell. Softw., 21, 1555– 1561, 2006.
König-Langlo, G., Bücker, A., Richter, F., and Sieger, R.: BSRN snapshot 2014-06 in two ZIP archives (5.63 GB), doi:10.1594/PANGAEA.833428, 2014.
Lefèvre, M., Oumbe, A., Blanc, P., Espinar, B., Gschwind, B., Qu, Z., Wald, L., Schroedter-Homscheidt, M., Hoyer-Klick, C., Arola, A., Benedetti, A., Kaiser, J. W., and Morcrette, J.-J.: Mc-Clear: a new model estimating downwelling solar radiation at ground level in clear-sky conditions, Atmos. Meas. Tech., 6, 2403–2418, doi:10.5194/amt-6-2403-2013, 2013.
Lefèvre, M., Blanc, P., Espinar, B., Gschwind, B., Ménard, L., Ranchin, T., Wald, L., Saboret, L., Thomas, C., and Wey, E.: The HelioClim-1 database of daily solar radiation at Earth sur-face: an example of the benefits of GEOSS Data-CORE, IEEE J. Sel. Topics Appl. Earth Observ. in Remote Sens., 7, 1745–1753, doi:10.1109/JSTARS.2013.2283791, 2014.
Ohmura, A., Gilgen, H., Hegner, H., Mueller, G., Wild, M., Dut-ton, E. G., Forgan, B., Froelich, C., Philipona, R., Heimo, A., Koenig-Langlo, G., McArthur, B., Pinker, R., Whitlock, C. H., and Dehne, K.: Baseline Surface Radiation Network (BSRN/WCRP): New precision radiometry for climate research, B. Am. Meteorol. Soc., 79, 2115–2136, 1998.
Qu, Z., Gschwind, B., Lefevre, M., and Wald, L.: Improving HelioClim-3 estimates of surface solar irradiance using the Mc-Clear clear-sky model and recent advances in atmosphere com-position, Atmos. Meas. Tech., 7, 3927–3933, doi:10.5194/amt-7-3927-2014, 2014.
Remund, J., Wald, L., Lefèvre, M., Ranchin, T., and Page, J.: World-wide Linke turbidity information, Proceedings of ISES Solar World Congress, Göteborg, Sweden, 16–19 June 2003.
Rigollier, C., Bauer, O., and Wald, L.: On the clear sky model of the 4th European Solar Radiation Atlas with respect to the Heliosat method, Sol. Energ., 68, 33–48, 2000.
Rigollier, C., Lefèvre, M., and Wald, L.: The method Heliosat-2 for deriving shortwave solar radiation from satellite images, Sol. Energ., 77, 159–169, 2004.
Roesch, A., Wild, M., Ohmura, A., Dutton, E. G., Long, C. N., and Zhang, T.: Assessment of BSRN radiation records for the com-putation of monthly means, Atmos. Meas. Tech., 4, 339–354, doi:10.5194/amt-4-339-2011, 2011a.
Roesch, A., Wild, M., Ohmura, A., Dutton, E. G., Long, C. N., and Zhang, T.: Corrigendum to “Assessment of BSRN radia-tion records for the computaradia-tion of monthly means” published in Atmos. Meas. Tech., 4, 339–354, 2011, Atmos. Meas. Tech., 4, 973–973, doi:10.5194/amt-4-973-2011, 2011b.
Thomas, C., Wey, E., Blanc, P., Wald, L., and Lefèvre, M.: Val-idation of HelioClim-3 version 4, HelioClim-3 version 5 and MACC-RAD using 14 BSRN stations, SHC 2015, Istanbul, Turkey, 2–4 December 2015, Energy Procedia, in press, 2016a. Thomas, C., Wey, E., Blanc, P., and Wald, L.: Validation of three
satellite-derived databases of surface solar radiation using mea-surements performed at 42 stations in Brazil, Adv. Sci. Res., 13, 81–86, doi:10.5194/asr-13-81-2016, 2016b.
WMO: Technical Note No. 172, WMO-No. 554, World Meteoro-logical Organization, Geneva, Switzerland, 121–123, 1981.