ISSN: 2089-3272, DOI: 10.11591/ijeei.v5i1.248 59
Music Recommendation System with User-based and
Item-based Collaborative Filtering Technique
M. Sunitha*, T. AdilakshmiDepartment of CSE, Vasavi College of Engineering Ibrahimbagh, Hyderabad-31, India e-mail: [email protected]
Abstract
Internet and E-commerce are the generators of abundant of data, causing information Overloading. The problem of information overloading is addressed by Recommendation Systems (RS). RS can provide suggestions about a new product, movie or music etc. This paper is about Music Recommendation System, which will recommend songs to users based on their past history i.e. taste. In this paper we proposed a collaborative filtering technique based on users and items. First user-item rating matrix is used to form user clusters and item clusters. Next these clusters are used to find the most similar user cluster or most similar item cluster to a target user. Finally songs are recommended from the most similar user and item clusters. The proposed algorithm is implemented on the benchmark dataset Last.fm. Results show that the performance of proposed method is better than the most popular baseline method.
Keywords: Recommendation system; Collaborative filtering; similarity measures
1. Introduction
With the start of E-Commerce and Internet Era, information started flowing like a flood. Recommendation systems (RS) are the tools to address information overloading problem. Recommendation system consists of two types of entities users and items. Users can be customers in an online store and items can be products. There is wide variety of applications exists for RS such as movie recommendation system, books recommendation system, music recommendation system etc. This research work discuss about music recommendation system. In music recommendation system users are listeners and items are songs listened.
Music is omnipresent. Millions of songs are present at a click away from everyone. With the number of songs, bands, and artists coming up, music listeners are overwhelmed by choices. Users want to find the songs that satisfy their music taste. This gives birth to Music recommendation systems. Many services like Pandora, Spotify, and Last.fm [1] have come up in order to provide recommendations to users. Netflix conducted a challenge called Million song dataset challenge to come up with a recommendation system with good performance on Last.fm [1][6][7] dataset. The Choice for music depends on taste, trust and liking towards some specific artist. It is very difficult to quantify all these factors for a machine or software. Hence, it has been a very difficult experience for these service providers to find the music really interesting and satisfying the taste of a person. Every music recommendations system works on a given set of assumptions in order to provide effective recommendations.
Two standard recommendation systems exist in literature are Collaborative filtering (CF) and Content based [4][8]. CF depends on the behavior of other users in order to provide recommendations whereas Content based systems uses content of the item for recommendations.
The rest of the paper is organized as follows. Section 2 explains Related work. Section 3 discusses about the proposed algorithm. Section 4 showcases the results obtained for the proposed algorithm and Section 5 describes conclusion and future directions of research.
2. Related Work
2.1. User-Item Rating Matrix
Collaborative Filtering technique is based on the data structure known as User-Item rating matrix. In this data structure each user’s rating for each item is stored. If a user Ui listen an item Ij for Sij number of times then Sij is placed in the cell corresponding to user Ui and item Ij[2][5]. The user-item matrix for m users and n items is shown in Table 1.
Table 1. User-Item Matrix Item /User I1 I2 … … In U1 S11 S12 … … S1n Ur2 S21 S22 … … S2n … … … … … … … … … … Um Sm1 Sm2 … … Smn
2.2. Collaborative Filtering (CF) Technique
CF is the most common method used in recommendation systems. Basic idea of CF is if users agree in the past i.e. if they have same taste in the past they will agree in future also. CF can be categorized into the following two types
2.2.1. User-Based CF
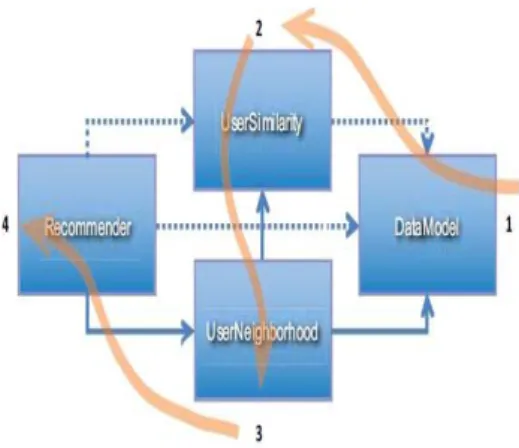
In the user- based collaborative filtering approach, we use user ratings for each item to infer interests and make recommendations. The bottom line of this approach is to find all the nearest neighbors of the current target user and try to recommend items that the target user would like as shown in the Figure 1.
Figure 1. User-based CF with nearest neighbors
2.2.2. Item-Based CF
Item based collaborative filtering approach is based on item-profiles instead of user profiles. It forms a profile for each item by considering the users who rated that item[3][5][6]. The similarity measures considered are Euclidean distance, Tanimoto coefficient and Log likelihood similarity.
For any item given, it’s similarity is computed with the other items already present in the user profile to decide whether to recommend that item or. This type of approach is useful when new items are being added to the system too often.
3. Proposed Algorithm
This section describes normalization techniques, similarity measures and user-based and item-based methods to form user clusters and item clusters which will be used in recommendations.
3.1. Similarity Measures
Similarity measures are used to find the nearest neighbors of a given target user. The following are some of the similarity measures studied in literature. Similarity measures can be classified based on the kind of data.
Simple matching Coefficient (SMC) and Jaccard Coefficient (JC) are used for symmetric and asymmetric binary data respectively as defined below
Euclidean Distance(ED) measure is the most common and shows how close the two users or items are to each other, which is given by the sum of square of the difference of the individual elements of the vectors representing the users or items.
The mathematical formula is given as shown below The distance from p to q is given by
( ) ( ) √( ) ( ) ( ) √∑( )
where d(p,q) refers to the Euclidean distance between two users or items p, q represented as n dimensional vectors where n is the number of items.
3.2. Normalization Techniques
Normalization is a standardization technique generally performed in Data mining. It is used to transform data or normalize the data to give equal importance to all attributes. The most commonly used normalization technique is Length normalization (LN) and Root mean square normalization (RMSN).
Length normalized vectors for each user is obtained by dividing the rating of each user for each item with the sum of his/her ratings for all items. The mathematical formula to find length normalized vectors is given in equation 1. The purpose of length normalization is to bring all users on to the same scale irrespective of the number of items rated.
LN(Ui,Ij) = ∑ ∑
where Rij is the rating of Ui for the item Ij, N is the number of items and M is the number of users.
RMSN is a generic normalization technique. The denominator is the square-root of the sums of the square of the all the elements of the vector, while the numerator has the frequency of the user ‘i’ for item ‘j’. Mathematically RMSN is expressed as equation given below.
2 1
( , )
i i n i iC
RMSN t d
C
where RMSN is the Root Mean Square Normalization vector, Ij is the item and useri is a user , Rij is the rating of useri for the Ij.
3.3. Proposed Approach
This paper proposes a method to perform music recommendation. The method used in this research work is model based collaborative filtering. A model is built by using user-based CF and item-based CF. The model is then used to provide recommendations for test user.
3.3.1. Pre-Processing Of Data
Initially pre-processing is performed on user-item rating matrix. First binarization is performed on user-item matrix as shown in Table 2.
Bij= { 1 if Rij > 0 0 if Rij = 0 }
where Rij is the rating of a user Ui for an item Ij Second step in pre-processing is normalization.
Table 2. Binary user-item rating matrix Item1 Item2 Item3 Item4
User1 0 0 1 0 User2 1 0 0 1 User3 1 1 0 1 User4 1 0 0 0 User5 0 1 1 0 User6 0 1 1 0 User7 1 0 0 1 User8 1 0 0 0 User9 1 0 0 1 User10 1 0 0 0
Length normalization and Root Mean Square Normalization is used to normalize binary user-item rating matrix. The Table 3 shows the user-item matrix with length normalization and Table 4 shows user-item matrix with RMSN normalization.
Table 3. Length normalized user-item rating matrix Item1 Item2 Item3 Item4
User1 0 0 1 0 User2 0.5 0 0 0.5 User3 0.33 0.33 0 0.33 User4 1 0 0 0 User5 0 0.5 0.5 0 User6 0 0.5 0.5 0 User7 0.5 0 0 0.5 User8 1 0 0 0 User9 0.5 0 0 0.5 User10 1 0 0 0
Table 4. RMSN normalized user-item rating matrix Item1 Item2 Item3 Item4
User1 0 0 0 0 User2 0.707 0 0 0.707 User3 0.408 0.408 0 0.408 User4 0 0 0 0 User5 0 0.707 0.707 0 User6 0 0.707 0.707 0 User7 0.707 0 0 0.707 User8 0 0 0 0 User9 0.447 0.447 0.447 0.447 User10 1 0 0 0 3.3.2 Model Building
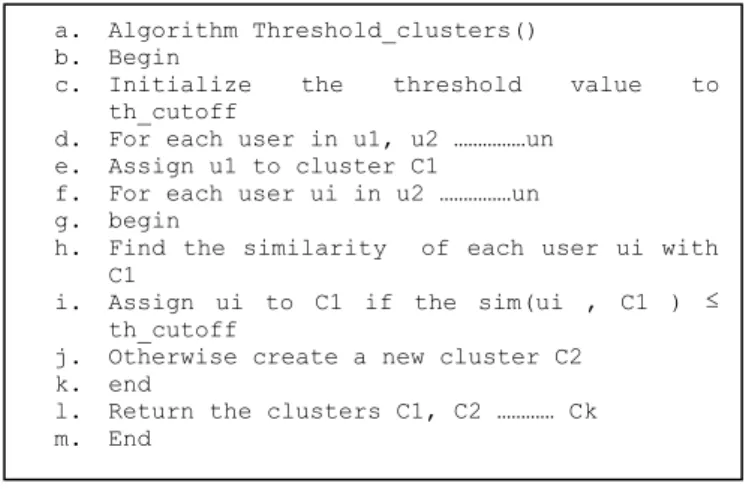
The data taken as input to build the model is user-item rating matrix. Each row is considered as a user vector and each column is considered as an item vector. Hierarchical threshold based clustering algorithm is used to build user or item model. User model is formed by using the pseudocode Figure 2 and item model is formed by using the pseudocode Figure 3.
Test data is given as input to the user model and item model to provide recommendations based on user clusters and item clusters respectively. The algorithm used for recommendation is shown in Figure 4.
Figure 2. Pseudocode for user-based model
Figure 3. Pseudocode for item-based model
Figure 4. Pseudocode for recommendation from user and item model
4. Results
Experimental analysis is performed on benchmark data set obtained from Last.fm1. Last.fm is a website which allows users to listen music online. The data considered for this work is the listening history of 50 Last,fm users from 2006 to 2009. For conducting experiment we
a. Algorithm Threshold_clusters() b. Begin
c. Initialize the threshold value to th_cutoff
d. For each user in u1, u2 ………un e. Assign u1 to cluster C1
f. For each user ui in u2 ………un g. begin
h. Find the similarity of each user ui with C1
i. Assign ui to C1 if the sim(ui , C1 ) ≤ th_cutoff
j. Otherwise create a new cluster C2 k. end
l. Return the clusters C1, C2 ………… Ck m. End
a. Algorithm Threshold_Itemclusters() b. Begin
c. Initialize the threshold value to th_cutoff
d. For each item in i1, i2 ………in e. Assign i1 to cluster C1
f. For each user ii in i2 ………in g. begin
h. Find the similarity of each item ii with C1
i. Assign i1 to C1 if the sim(ii , C1 ) ≤ th_cutoff
j. Otherwise create a new cluster C2 k. end
l. Return the clusters C1, C2 ………… Ck m. End
a. Algorithm Recommendation_itemclusters() b. Begin
c. For each test_user in u1 , u2,….uk
d. Find the similarity with each item-cluster e. Find the cluster with highest similarity f. Recommend the items of the mapped
item-cluster g. End
considered 1 year data (2008). The number of records are 2,20,338. Sample record is shown in Figure 5.
.
Figure 5. sample log records of Last.fm users
Each record consists of the following fields.
User id (User_000004) – Since the data is captured anonymously, we assigned each user, a user-id of the format user_000004.
Date–Time (2009-04-09T12:49:50Z) – Time of activity is recorded
AlbumId(078a9376-3c04-4280-b7d720e158f345d) – A unique identifier is Attributed to each Album.
Album name (Frightened Rabbit) – An album to which that song belongs to.
Trackid(5ca13249-26da-47bd-bba7-80c2efebe9cd) – A unique identifier is attributed to each track / song.
Track name (Old Old Fashioned) – The songs which the user listened to. 4.1. Evaluation Measures
Precision, Recall and F-measure are used to evaluate the performance of the proposed method. The measures are defined as shown below
( ) ( ) 4.2. Experimental results
The experiment is repeated for threshold values varying from 0.05 to 0.5 for different normalization techniques (Length normalization, Root Mean Square normalization) and similarity measures (Euclidean, Cosine). The results are shown below. From the experiments we can show that the proposed music recommendation system works well compared to the baseline method. The results are shown for various threshold values with only user clusters, only item clusters and both with user and item clusters.
Table 5. Items Clusters with cosine similarity Threshold precision recall f-score
0.1 0.084 0.053 0.054 0.2 0.084 0.053 0.054 0.3 0.084 0.053 0.054 0.4 0.084 0.053 0.054 0.5 0.085 0.054 0.054 0.6 0.126 0.073 0.078 0.7 0.169 0.027 0.044 0.8 0.029 0.006 0.010 User_000004 2009-03-28T09:55:23Z dc21d171-7204-4759-9fd0-77d031aeb40c Frightened Rabbit 8b3c111a-b8a4-4823-9e0c-58043ed1af24 Old Old Fashioned
User_000004 2009-03-28T09:50:02Z 2aca01cc-256e-4a0d-b337-2be263ef9302 All Girl Summer Fun Band 722bd5fd-1b27-4ec1-ba21-3e7dc3c514b0 Cut Your Hair
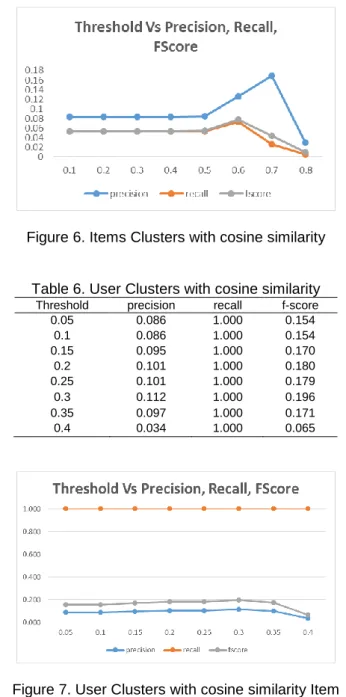
Figure 6. Items Clusters with cosine similarity
Table 6. User Clusters with cosine similarity Threshold precision recall f-score
0.05 0.086 1.000 0.154 0.1 0.086 1.000 0.154 0.15 0.095 1.000 0.170 0.2 0.101 1.000 0.180 0.25 0.101 1.000 0.179 0.3 0.112 1.000 0.196 0.35 0.097 1.000 0.171 0.4 0.034 1.000 0.065
Figure 7. User Clusters with cosine similarity Item
Table 7. Item clusters with Euclidean distance Threshold precision recall f-score
0.6 0.500 0.003 0.006 0.62 0.500 0.003 0.006 0.64 0.086 0.357 0.128 0.66 0.079 0.690 0.136 0.68 0.082 0.855 0.145 0.7 0.084 0.942 0.150 0.72 0.085 0.973 0.151 0.74 0.085 0.995 0.153
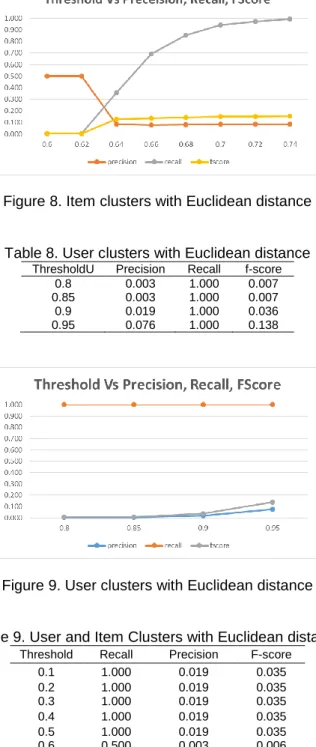
Figure 8. Item clusters with Euclidean distance
Table 8. User clusters with Euclidean distance ThresholdU Precision Recall f-score
0.8 0.003 1.000 0.007 0.85 0.003 1.000 0.007 0.9 0.019 1.000 0.036 0.95 0.076 1.000 0.138
Figure 9. User clusters with Euclidean distance
Table 9. User and Item Clusters with Euclidean distance Threshold Recall Precision F-score
0.1 1.000 0.019 0.035 0.2 1.000 0.019 0.035 0.3 1.000 0.019 0.035 0.4 1.000 0.019 0.035 0.5 1.000 0.019 0.035 0.6 0.500 0.003 0.006 0.62 0.500 0.003 0.006 0.63 0.333 0.003 0.005 0.64 0.086 0.357 0.128 0.66 0.086 0.357 0.128 0.7 0.084 0.942 0.150 0.9 0.086 1.000 0.154
Figure 10. User and Item Clusters with Euclidean distance
Table 10. User and Item Clusters with cosine similarity Threshold Precision Recall Fscore
0.1 0.086 1.000 0.154 0.2 0.074 0.655 0.122 0.3 0.078 0.484 0.111 0.4 0.086 0.143 0.059 0.5 0.085 0.054 0.054 0.7 0.169 0.027 0.044 0.72 0.169 0.027 0.044 0.73 0.032 0.004 0.007 0.8 0.029 0.006 0.010
Figure 11. User and Item Clusters with cosine similarity
5. Conclusion and Future Scope
This paper addresses the problem of music recommendation by using CF model based approach with users and items. We conducted experiments by using user based and item based CF model with user clusters and item clusters on last.fm bench mark data set. The results of proposed method is compared with baseline (popular) method. Results obtained shows that the performance of proposed method for RS improves over baseline method. This work can be enhanced by addressing the long tail problem and cold-start problem
References
[1] Last. FM – A popular music web portal http://www.last.fm
[2] M Sunitha Reddy, T Adilakshmi. User Based Collaborative Filtering For Music Recommendation System. International Journal of Innovative Research and Development. 2013; 2(12): 185-190. [3] Balázs Hidasi, Domonkos Tikk. Context-aware item-to-item recommendation within the factorization
framework. CaRR’13. Rome, Italy. 2013.
[4] Markus Zanker, Dietmar Jannach. Introduction to Recommender Systems. Tutorial at ACM Symposium on Applied Computing 2010. Sierre, Switzerland. 2010.
[5] SongJie Gong. A Collaborative Filtering Recommendation Algorithm Based on User Clustering and Item Clustering. Journal Of Software. 2010; 5(7).
[6] NetflixPrize, http://www.netflixprize.com/, 2012.
[7] Brian McFee, Thierry Bertin-Mahieux, Daniel P.W. Ellis, Gert R.G. Lanckriet. The Million Song Dataset Challenge. WWW 2012 Companion. Lyon, France. 2012.
[8] Adomavicius G, Tuzhilin A. Toward the Next Generation of Recommender Systems:A Survey of the State-of-the-Art and Possible Extensions. IEEE Transactionson Knowledge and Data Engineering.