Prediction of Movie Rating Using Item-Based
Collaborative Filtering Method
Pa Pa Win
1, Thu Zar Htet
2& Seint Wint Thu
31
University of Computer Studies (Meiktila), Faculty of Information Science
2,3University of Computer Studies (Meiktila), Faculty of Information Science
Abstract:
Recommender systems employ prediction algorithms to provide users with items that match their interests. One of the most famous recommender systems is a collaborative filtering (CF) method. The system is designed to evaluate the recommender system using Neighborhood-based collaborative filtering (CF) methods. The evaluation using MovieLens offline datasets is implemented using the timestamp values of user ratings of movies to improve the accuracy. This system generates the prediction accuracies of item-based approach of Neighborhood-based collaborative filtering method. Item-Based collaborative filtering recommends similar items. And then the accuracy of the algorithm is calculated using Mean Absolute Error (MAE). The results of MAE are better in item-based CF method.
Keywords
Collaborative filtering, Neighborhood-based CF, MovieLens, MAE
1.
Introduction
Recommender systems employ prediction algorithms to provide users with items that match their interests. Recommender systems use the opinions of a community of users to help individuals in that community more effectively identify content of interest from a potentially overwhelming set of choices.
The Collaborative Filtering (CF) approach to recommender systems relies only on information about the behavior of users in the past. It is a method of making automatic predictions (filtering) about the interests of a user by collecting preferences or taste information from many users (collaborating). CF techniques use a database of preferences for items by users to predict additional topics or products a new user might like.
The two general groups of collaborative filtering methods are
1. neighborhood method or memory-based method,
and
2. model-based method.
In neighborhood-based collaborative filtering the user-item ratings stored in the system are directly used to predict ratings for new items. This can be done as item-based recommendation.
The model-based approaches use these ratings to learn a predictive model. The general idea is to model the user-item interactions with factors representing latent characteristics of the users and items in the system, like the preference class of users and the category class of items. This model is then trained using the available data, and later used to predict ratings of users for new items.
In a typical Collaborative Filtering (CF) scenario, the user profiles are represented in a U × I user-item matrix R. U is a list of U users and I is a list of I items . S is the set of possible value for a rating (e.g. S = [1, 5] or S = {like, dislike}). Each user, ui, has a list of items, I, which the user has rated, or about which their preferences have been inferred through their behaviors. Each element ri,j = r indicates that user i rated item j by r, where r S if the item has been rated, and ri,j = 0 means that the rating is unknown.
Two of the most important problems associated with recommender systems are the best item and top-N recommendation problems. The first problem consists in finding, for a particular user u, the new item i ∈ I \ Iu for which u is most likely to be interested in. When ratings are available, this task is most often defined as a regression or (multi-class) classification problem where the goal is to learn a function f : U ×I →S that predicts the rating f (u, i) of a user u for a new item i. This function is then used to recommend to the active user ua an item i∗ for which the estimated rating has the highest value:
2.
Recommendation System
The Internet, with hundreds of millions of pages worldwide, has become the greatest source of information that has ever existed. Information retrieval systems are essential tools to guide users to the information they are seeking. Specifically, users demand personalized search systems, not just limited to retrieving the most relevant items, but also more adequate for their particular tastes or interests. This is the aim of recommender systems. They use information about users, user profiles, to predict the utility or relevance of a particular item, thus providing personalized recommendations.
Until now, recommender systems have been used basically in two tasks. Recommender systems have been used, to recommend a list of items to the user. In this case, often called the find good items task, the system chooses the items that it considers the most relevant. Actually, recommender systems can also be used for other tasks, such as find all good items, recommended sequence, just browsing or find credible recommender [5], although these have not yet attracted much interest among researchers.
2.1 Collaborative Filtering
The technique of collaborative filtering, that recommends items based on the opinions of other users, is very popular, especially in e-commerce, given its good results. In recent years, numerous algorithms based on different ideas and concepts have been developed to address this problem. Unfortunately, works that compare these techniques are scarce, making it difficult to select the best algorithm (or algorithms) in a given situation. The Collaborative Filtering (CF) approach to recommender systems relies only on information about the behavior of users in the past. It is a method of making automatic predictions (filtering) about the interests of a user by collecting preferences or taste information from many users (collaborating). CF techniques use a database of preferences for items by users to predict additional topics or products a new user might like.
Following [3], collaborative filtering methods can be grouped in the two general classes of neighborhood and model-based methods.
Typically, the workflow of a collaborative filtering system is:
1. A user expresses his or her preferences by rating items (e.g. books, movies or CDs) of the system. These ratings can be viewed as an approximate representation of the user's interest in the corresponding domain.
2. The system matches this user’s ratings against other users’ and finds the people with most “similar” tastes.
3. With similar users, the system recommends items that the similar users have rated highly but not yet being rated by this user (presumably the absence of rating is often considered as the unfamiliarity of an item)
Collaborative Filtering (CF) algorithms are widely used in a lot of recommender systems.
2.2
Methodology of Collaborative Filtering
Item-based collaborative filtering (users who bought x also bought y), proceeds in an item-centric manner:
Build an item-item matrix determining relationships between pairs of items
Infer the tastes of the current user by examining the matrix and matching that user's data
2.3 Neighborhood- based CF Techniques
In neighborhood-based (memory-based [2] or heuristic-based) collaborative filtering [2, 3, 7], the user-item ratings stored in the system are directly used to predict ratings for new items. This can be done as item-based recommendation.
The neighborhood-based CF algorithm, a prevalent memory-based CF algorithm, uses the following steps:
1. calculate the similarity or weight, wi,,j, which reflects distance, correlation, or weight, between two users or two items, i and j; and
2. produce a prediction for the active user by taking the weighted average of all the ratings of the user or item on a certain item or user, or using a simple weighted average [2].
When the task is to generate a top-N recommendation, the top-N recommendation algorithms firstly identify the k most similar users or items (nearest neighbors) after computing the similarities, and then aggregate the neighbors to get the top-N most frequent items as the recommendation.
numerous and include Bayesian Clustering, Latent Semantic Analysis, Latent Dirichlet Allocation, Maximum Entropy, Boltzmann Machines, Support Vector Machines, and Singular Value Decomposition.
2.4 Item-Based
Collaborative Filtering
Item-based collaborative filtering was first described in the literature by Sarwar et al. [1] and Karypis [4], although a version of it seems to have been used by Amazon.com at this time. While user-based methods rely on the opinion of like-minded users to predict a rating, item-based approaches [3, 7] look at ratings given to similar items. Item-based collaborative filtering approaches predict the rating of a user u for an item i based on the ratings of u for items similar to i. In such approaches, two items are similar if several users of the system have rated these items in a similar fashion.
2.4.1 Pearson correlation for Item Similarity Computation
Pearson correlation has also been proposed for item–item recommendation, but does not seem to work as well as cosine similarity. The Pearson Correlation (PC) similarity , between two items i and j
(2.1)
2.4.2 Weighted Sum For Item-based Prediction
While user-based methods rely on the opinion of like-minded users to predict a rating, item-based approaches look at ratings given to similar items. This method computes the perdition on an item i for a user u by computing the sum of the ratings given by the user on the items similar to i. The predicted rating of u for i is obtained as a weighted average of the ratings given by u to the items of Nu(i):
(2.2) where the summations are over all other rated items j
∈ N for user u, is the weight between items i and j, is the rating for user u on item j.
Basically, this approach tries to capture how the active user rates the similar items. The weighted sum is scaled by the sum of the similarity terms to make sure the prediction is within the predefined range.
Equation (2.2) as it stands suffers from the deficiency. The deficiency comes to light when it is possible for similarity scores to be negative and ratings are constrained to be nonnegative: some of
the ratings averaged together to compute the prediction may be negative after weightings. While this will not affect the relative ordering of items by predicted value, it will bias the predicted values so they no longer map back to the user rating domain. This can be corrected either by threshold similarities so only items with nonnegative similarities are considered or by averaging distance from the baseline predictor:
(2.3)
The baseline prediction for user u and item i is defined by . The simplest baseline is to predict the average rating overall ratings in the system: = μ (where μ is the overall average rating). This can be enhanced somewhat by predicting the average rating by that user or for that item: = or = . Equation (2.4) is applied with predicting the average rating for the item.
(2.4)
2.5 Item-based Recommendation
When choosing between the implementation of an item-based neighborhood recommender system, five criteria should be considered:
Accuracy Efficiency Stability Justifiability Serendipity
2.6 Evaluation the Accuracy of a CF
Algorithm
The quality of a recommender system can be decided on the result of evaluation. To evaluate CF algorithms, there is needed to use metrics according to the types of CF application. Instead of classification error, the most widely used evaluation metric for prediction performance of CF is Mean Absolute Error (MAE). Algorithm prediction performance is measured with different metrics. The type of metrics used depends on the purpose of the algorithm and the goal of the measurement. Herlocker et al. [2004] identify three types of metrics to measure the quality of an algorithm.
1. Prediction accuracy such as Mean Absolute
Error (MAE) and its variations
2. Classification accuracy such as precision,
recall, F1-measure, and ROC sensitivity
3. Rank accuracy such as Pearson’s
normalized distance-based performance metric (NDPM).
2.6.1 Prediction Accuracy
Typically, the ratings R are divided into a training set used to learn a function f : U ×I →R that predicts the rating f (u, i) of a user u for a new item i, and a test set used to evaluate the prediction accuracy.
Accuracy is commonly used to evaluate the performance of the recommendation method. The prediction accuracy measures the difference between the rating the system predicts and the real rating. The most popular of this kind of metric is the mean absolute error (MAE). Other related metrics, such as mean squared error (MSE), root mean squared error (RMSE) or normalized mean absolute error, are also used.
Mean Absolute Error (MAE)
The mean absolute error is a metric to measure the difference, as absolute value, between the prediction of the algorithm and the real rating.
MAE computes the average of the absolute difference between the predictions and true ratings. The lower the MAE, the better the accuracy is. In general MAE can range from 0 to infinity, where infinity is the maximum error depending on the rating scale of the measured application. Computing the Mean Absolute Error is accomplished with the following formula:
, (2.5) where n is the total number of ratings over all users,
is the predicted rating for user on item j and is the actual rating. The lower the MAE, the better the prediction is.
Different recommender systems use different numerical rating scales. Normalized mean absolute error (NMAE) normalizes MAE to express errors as percentage of full scale:
, (2.6) where and the upper and lower bounds of the rating.
3.
Implementation
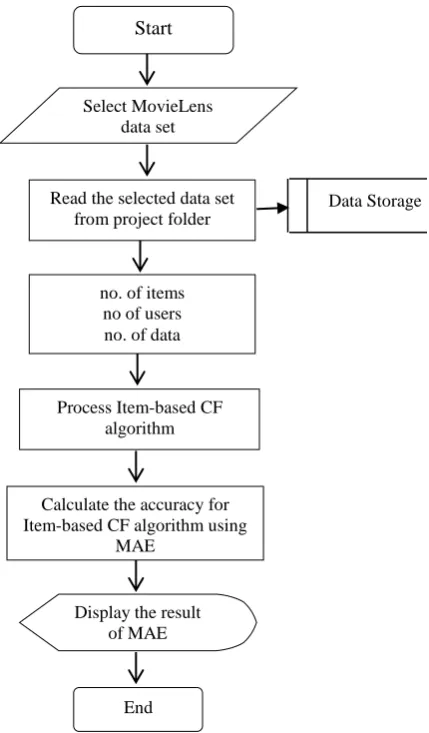
The main objective of this system is to predict the accuracy of item-based approach of Neighborhood-based collaborative filtering method using MovieLens offline datasets. The prediction accuracy is calculated using MAE (Mean Absolute Error).
Firstly the user chooses one of MovieLens rating data sets. The system reads the selected MovieLens
rating data in the project. After reading file, the number of users and movies are obtained for it. The system will process the calculating the prediction accuracy.
In this system, the Pearson correlation methods are applied to calculate similarity between items. Weighted sum methods are used to predict rating for a new item for a user.
Figure 3.1 System Overview
3.1 Data Sets
The Movielens datasets collected by the Group Lens Research Project at the University of Minnesota are used for evaluation of the recommender systems are differently sized.
Table 3.1 Sample Data Set
No.
Data set's name
Number of Users
Number of Movies
Ratings
Data Storage Start
Select MovieLens data set
Read the selected data set from project folder
no. of items no of users no. of data
Process Item-based CF algorithm
Calculate the accuracy for Item-based CF algorithm using
MAE
Display the result of MAE
1 ml- latest-small
706 8,570 100,023 2
ml-100k 943 1,682 100,000 3
ml-20m 138,493 27,278 20,000,263 The ratings in ml-latest-small and ml-20m data sets are user-provided star ratings, from 0.5 to 5 stars; the ml-100k data set has a granularity of 1-star, while others have 0.5 star granularities. These three data sets are with time stamped user ratings of movies. Sample of the data in rating file show in Table 3.2.
Table 3.2 Sample Data in Rating File
user_id movie_id Rating Timestamp
196 242 3 8.81E+08
186 302 3 8.92E+08
22 377 1 8.79E+08
244 51 2 8.81E+08
166 346 1 8.86E+08
298 474 4 8.84E+08
115 265 2 8.81E+08
3.1.1 Data Pre-Processing
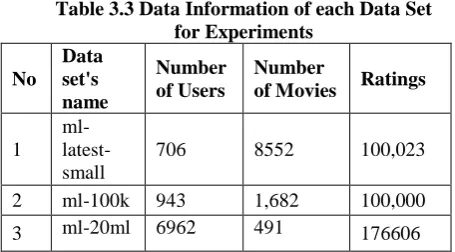
Some data pre-processing is required in the data set named ml-20m. The ratings in this data set have about twenty millions. There is a problem to run the whole these data set because of out of run memory. So that 176606 ratings from about twenty millions ratings are used in this system.
Although there are 8,570 movies in the ml-latest-small data set, only 8552 movies have been rated. Table 3.3 shows the information of each data set for experiments.
Table 3.3 Data Information of each Data Set for Experiments
No
Data set's name
Number of Users
Number
of Movies Ratings
1 ml- latest-small
706 8552 100,023
2 ml-100k 943 1,682 100,000
3 ml-20ml 6962 491 176606
3.2
Experiments for Evaluation of the System
In machine learning, the basic structure for offline evaluation is based on the train-test setup common. So in this system, one-third of ratings of the whole data set are considered to test data to evaluate accuracy. The system takes the prediction items as one–third of movies that each user has rated. The results of the experiments for the three data sets are discussed below.
Firstly, the ml-latest small data set is used to evaluate the accuracy of the system. When analyzing the result of predicted rating of each movie for a user, the two states are found as described below.
Item-based CF, the predicted rating for a movie is zero because the average rating is zero having no user who has rated on the predicted movie. Table 3.4 describe those states of the user (User ID = 16) among 706 users by applying the item-based CF respectively.
Table 3.4 Rating Information for User ID = 16 produced by the Item-based CF
No Movie
-ID
Origin al Rating
Predic ting Rating
Avera ge Rating
No of Items
1 782 1 0 0 12
2 804 5 2.975 3.5 12
3 832 4 4.367 4.375 17 4 1047 3 3.891 3.75 17
5 1354 3 3.55 4 17
6 1444 1 0 0 15
In item-based CF, the average rating for movie (Movie ID = 782 and 1444) is zero because of having no user who has rated on the predicted movie. So that the predicted rating of the user (User ID = 16) for those movies is only as a weighted average of ratings given by that user to the items. Although there are items rated by user (User ID = 16), a weighted average is also zero. This may be caused if there is no user who has rated the same items while calculating similarities between items. It can be clearly seen in Table 3.4.
The MAE result of the user based CF on that ml-latest small data set is 0.08 whereas the MAE result of the item based CF is 0.12. The number of users is less than the number of items in that data set.
4.
Conclusion
using MovieLens offline datasets is implemented using the timestamp values of user ratings of movies to improve the accuracy.
Neighborhood-based CF computes similarity between users or items, and then uses the weighted sum of ratings or simple weighted average to make predictions based on the similarity values. Pearson correlation similarities are used similarity calculations, which are usually conducted between co-rated items by a certain user or both users that have co-rated a certain item. When computing the prediction for a user on a certain item, all neighbor users or items are considered item-based CF method. Neighborhood-based CF algorithm is easy to implement.
Accuracy is used to evaluate the performance of the recommendation method. Among the two popular measures of accuracy, Mean Absolute Error (MAE) and Root Mean Squared Error (RMSE), MAE is used in order to evaluate the prediction performance of the developed recommender system. According to the experimental results using MAE, if number of users exceeds number of items, the item-based CF provide more accurate recommendation
5.
Acknowledgements
I would like to express my special thanks to all
my teachers who gave me their time and guidance,
and all my friends who helped in the task of developing this paper. Finally, I would like especially to thank my parents for their continuous support and encouragement throughout my whole life.
6. References
[1] B. M. Sarwar, G. Karypis, J. A. Konstan, and J. Riedl,
“Item-based collaborative filtering recommendation algorithms,” in Proceedings of the 10th International Conference on World Wide Web (WWW’01), pp. 285– 295, May 2001.
[2] Delgado, J., Ishii, N, “Memory-based weighted majority prediction for recommender systems,” in Proc. of the ACM SIGIR’99 Workshop on Recommender Systems (1999).
[3] Deshpande, M. and Karypis, G, “Item-based top-N recommendation algorithms,” in ACM Transaction on Information Systems 22(1), 143–177 (2004).
[4] G. Karypis, “Evaluation of item-based top-N recommendation algorithms,” in ACM CIKM ’01, pp. 247– 254, ACM, 2001.
[5] J. L. Herlocker, J. A. Konstan, L. G. Terveen, and J. T. Riedl, “Evaluating collaborative filtering recommender systems,” in ACM Transactions on Information Systems, vol. 22, no. 1, pp. 5–53, 2004. View at Publisher · View at Google Scholar · View at Scopus.
[6] Last.fm: Music recommendation service (2009).
http://www.last.fm
[7] U. Shardanand and P. Maes, “Social information filtering: Algorithms for automating “word of mouth”,” in ACM CHI ’95, pp. 210–217, ACM Press/Addison-Wesley Publishing Co., 1995.
[8] Tak´acs, G., Pil´aszy, I., N´emeth, B., Tikk, D,
“Scalable collaborative filtering approaches for large recommender systems,” in Journal of Machine Learning Research (Special Topic on Mining and Learning with Graphs and Relations) 10, 623–656 (2009).
[9] U. Shardanand and P. Maes, “Social information filtering: Algorithms for automating “word of mouth”,” in ACM CHI ’95, pp. 210–217, ACM Press/Addison-Wesley Publishing Co., 1995.