DETERMINING THE OPTIMAL TECHNIQUE FOR EARLY DETECTION OF BROKEN ROTOR BARS IN MEDIUM VOLTAGE SQUIRREL CAGE INDUCTION MOTORS DURING OPERATION
Lourenco Mafika Thusi
A research report submitted to the Faculty of Engineering and Built Environment, University of Witwatersrand, Johannesburg, in partial fulfilment of the requirements for the degree of Master of Science in Engineering.
DECLARATION
I declare that this research report is my own, unaided work, except where otherwise acknowledged. It is being submitted as a partial fulfilment for the degree of Master of Science in the University of Witwatersrand, Johannesburg. It has not previously been submitted for any degree or examination in any other university.
……… L.M. Thusi
ABSTRACT
Electric motors play a pivotal role in various industrial plant processes for electrical to mechanical energy conversion. As a result their reliability and availability is of utmost importance to industries. The reliability and availability of plant electric motors can be achieved by early detection of any developing fault by performing condition monitoring and preventative maintenance on motors. An important motor failure mode, which has been quite challenging to detect, is cracking and subsequent breaking of rotor bars in induction motors.
The existing condition monitoring techniques are incapable of positively detecting a cracked or single bar problem during operating conditions. Bars have broken, lifting out of the rotor slots and damaging all stator coils, consequently forcing the removal of the motor during plant operation and a complete rewind of the stator. This research is being conducted to ascertain, from existing conventional techniques, an optimal technique for the detection of a cracked rotor bar or a completely broken single rotor bar in induction motors under operating conditions. Furthermore, it explores non-conventional techniques, which can assist in detection of broken rotor bars.
The report starts by presenting the literature on stator current and axial vibration analysis which are conventional rotor bat detection techniques. Thereafter, the Maxwell 2D simulation results which indicate stator current broken rotor bar detection frequencies are discussed, followed by the experimental measurement results and discussions. The conclusion drawn from the experimental results is that the stator current analysis is, presently, the optimal technique to detect a single broken rotor bar during a medium voltage induction motor operation. The axial vibration analysis is recommended as a secondary monitoring technique to solidify the stator current diagnosis. The shaft voltage analysis is introduced as a non-conventional technique and the shaft voltage results are discussed.
DEDICATION
ACKNOWLEDGEMENTS
The author would like to thank the following for their guidance, assistance and patience during the course of this research work:
• Professor W.A. Cronje, my supervisor for his assistance and guidance over the duration of this research project.
• Mohamed Ahmed, Eskom CED Electric Machines Consultant for initiating the project to me and together with Associate Professor A. Meyer for assistance, guidance and advise in performing this research project.
• Daniel de Cahna and Kahesh Dhuness, Fellow Postgraduates from University of Witwatersrand and University of Johannesburg respectively, for their assistance in experimental and simulation parts of the project and willingness to give up their time to help me when necessary.
• Eskom - ERID and Eskom - Generation - Arnot Power Station respectively, for their financial assistance in making this project possible and for providing the motors for experimental work on the project.
• Marthinusen & Coutts (M&C) Management and Test Bay personnel, CMM Consultants (Pty) Ltd and Westward Electric Co. (Pty) Ltd for their patience and for assisting in performing the tests and part taking in the investigations.
• Lastly, my family, my wife and friends for helping me through difficult patches and for giving me moral support.
CONTENTS Page DECLARATION……….….. (i) ABSTRACT……….……. (ii) ACKNOWLEDGEMENTS……….…. (iv) CONTENTS……….……. (v)
LIST OF FIGURES……….……. (ix)
LIST OF TABLES……….……… (xii)
LIST OF SYMBOLS………....…. (xiii)
1. INTRODUCTION 1
1.1 Broken Rotor Bar Failure Mechanisms……… 3
1.2 Structure of the Research Project ……… 4
2. BACKGROUND ON DETECTION OF BROKEN ROTOR BARS 6 2.1 The Interbar Currents Phenomenon ..………. 6
2.2 Factors Influencing Detection of Broken Rotor Bars ……… 7
2.3 Axial Vibration Monitoring……….. 9
2.4 Thermal Consideration due to Interbar Currents ……….. 9
2.5 Other Research Work and Case Studies ………... 10
3. BROKEN ROTOR BAR DETECTION TECHNIQUES 13
3.1 Interbar Currents ……… 13
3.2 Axial Vibration Monitoring.………..……….. 15
3.3 Stator Current Monitoring.………. 18
3.4 Flux Monitoring….……….. 21
3.5 The Effects of Load..………..……… 22
4. MAXWELL 2D SIMULATION OF A BROKEN ROTOR BAR 24 4.1 Induction Motor Simulation Parameters ……… 24
4.1.2 Materials Setup………. 27
4.1.3 Boundary and Sources Setup………. 28
4.1.4 Setup Solution……… 29
4.1.5 Solution Options……… 30
4.1.6 Motion Setup……….. 30
4.1.7 Signal Processing……….. 31
4.2 Induction Motor Simulation Results ……… 31
4.3 Induction Motor Simulation Conclusion……….. 34
5. EXPERIMENTAL VALIDATION TESTING DETAILS AND METHODS 35
5.1 Experimental Test Details ………... 35
5.2 Experiment Measuring Instruments ……….. 37
5.2.1 Current Transducer………... 37
5.2.2 Vibration Sensors……… 39
5.2.3 Speed Sensor: Tachometer………. 40
5.3 Data Acquisition and Processing ………... 41
5.3.1 dSpace: DS1104 R&D Controller Board……… 41
5.3.2 Signal Processing……….. 43
5.3.3 Selection of FFT parameters……… 46
6. INDUSTRIAL EXPERIMENTAL RESULTS AND DISCUSSION 48 6.1 Experiment Results Introduction ………. 48
6.2 Stator Current Analysis ………. 48
6.2.1 Motor A Stator Current Analysis……… 50
6.2.2 Motor B Stator Current Analysis……… 57
6.3 Axial Vibration Analysis..………. 60
6.3.1 Motor A Axial Vibration Analysis……… 60
6.3.2 Motor B Axial Vibration Analysis……… 65
6.4 Other detection technique: Shaft Voltage Analysis…..………….. 68
6.4.2 Motor B Shaft Voltage Analysis………. 75
6.5 The Effects of Load..………. 76
6.5.1 Motor A Load Effects Comparison………. 76
6.6 Experiment Results Summary……… 78
6.7 Experiment Results Conclusion ……… 79
7. CONCLUSION AND RECOMMENDATIONS 80
7.1 Research Report Summary……….. 80
7.2 Research Report Conclusion……… 81
7.3 Recommended Future Work………. 82
APPENDIX A: MAXWELL 2D: INDUCTION MOTOR SIMULATION 84
A.1 General Procedure for creating and solving a 2D Model……….. 84
APPENDIX B: DS1104 R&D CONTROLLER BOARD SPECIFICATIONS 88 APPENDIX C: DATA PROCESSING MATLAB CODES 90 C.1 The Matlab FFT Function used for data processing [47]……… 90
C.2 Measured Signal Processing……….. 91
APPENDIX D: ADDITIONAL THEORETICAL AND INDUSTRIAL MEASUREMENTS RESULTS 93 D.1 Stator Current Analysis……… 93
D.2 Axial Vibrations Analysis………. 96
APPENDIX E: ADDITIONAL BROKEN ROTOR BAR DETECTION INSTRUMENTS 98 E.1 CSMeter……… 98
E.2 CSI 2130 Machinery Health Analyser……….. 101
E.3 Current Clamps……… 102
APPENDIX F: CMM CONSULTANTS EXPERIMENT REPORT 105 APPENDIX G: IRIS POWER EXPERIMENT REPORT 117
LIST OF FIGURES
Page
3.1 Kerszenbaum and Landy’s model of the broken bar region... 14
3.2 Production of axial force model by Muller………..…... 16
4.1 The geometric model of the simulated induction motor………. 26
4.2 Maxwell 2D model materials description……….. 27
4.3 Maxwell 2D simulation mesh……….. 30
4.4 Simulated stator current at the 5th harmonic………... 31
4.5 Simulated stator current at the 17th harmonic………..….. 32
4.6 Normalised simulated stator current results……… 33
5.1(a) Half broken rotor bar………... 36
5.1(b) One fully broken rotor bar………... 36
5.2 LEM-flex RR3030 AC current probe………. 38
5.3 Connection of accelerometers for vibration measurements………. 39
5.4 Digital Tachometer RM-1501 for speed measurement………. 40
5.5 An overview of the architecture and functional units of the DS1104 41 5.6 dSpace Control Desk setup for experimental work……… 42
5.7 Summarised signal processing process ………. 45
6.1 Motor A stator current at the1st harmonic (50 Hz)……….. 50
6.2 Motor A stator current at the 3rd harmonic (150 Hz)……….. 51
6.3 Motor A stator current at the 5th harmonic (250 Hz)……….. 51
6.4 Motor A stator current at the 7th harmonic (350 Hz)……….. 52
6.5 Motor A stator current at the 9th harmonic (450 Hz)……….. 52
6.6 Motor A stator current at the 11th harmonic (550 Hz)……… 53
6.7 Motor A stator current at the 23rd harmonic (1150 Hz)………. 53
6.8 Motor A stator current at the 25th harmonic (1250 Hz)……….. 54
6.9 Motor A stator current at the 43rd harmonic (2250 Hz)……….. 54
6.10 Normalised stator current for Motor A at different harmonics….….. 55
6.11 Motor B stator current at the 1st harmonic (50 Hz)……….. 57
6.12 Motor B stator current at the 5th harmonic (250 Hz)…….………….. 57
6.14 Motor B stator current at 23rd harmonic (1150 Hz)…….………. 58
6.15 Motor B stator current at 25th harmonic (1250 Hz)………. 59
6.16 Motor A 1st group of axial vibrations fault frequencies……….. 61
6.17 Motor A 2nd group of axial vibrations fault frequencies………. 61
6.18 Motor A 3rd group of axial vibrations fault frequencies……….. 62
6.19 Motor A 4th group of axial vibrations fault frequencies………….…. 62
6.20 Motor A 5th group of axial vibrations fault frequencies……….. 63
6.21 Motor A 6th group of axial vibrations fault frequencies……….. 63
6.22 Motor A 7th group of axial vibrations fault frequencies……….. 64
6.23 Motor A 8th group of axial vibrations fault frequencies……….. 64
6.24 Motor A 9th group of axial vibrations fault frequencies……….. 65
6.25 Motor B 4th group of axial vibrations fault frequencies……….. 66
6.26 Motor B 5th group of axial vibrations fault frequencies……….. 67
6.27 Motor A shaft voltage at 50 Hz (1st harmonic)………. 69
6.28 Motor A shaft voltage at 150 Hz (3rd harmonic)……….. 69
6.29 Motor A shaft voltage at 250 Hz (5th harmonic)……….. 70
6.30 Motor A shaft voltage at 350 Hz (7th harmonic)……….……. 70
6.31 Motor A shaft voltage at 450 Hz (9th harmonic)……….. 71
6.32 Motor A shaft voltage at 1050 Hz (21st harmonic)……….. 71
6.33 Motor A shaft voltage at 1350 Hz (27th harmonic)……….. 72
6.34 Motor A shaft voltage at 1950 Hz (39th harmonic)……….. 72
6.35 Motor A shaft voltage at 2250 Hz (45th harmonic)……….. 73
6.36 Motor A shaft voltage at 2850 Hz (57th harmonic)……….. 73
6.37 Normalised shaft voltage for Motor A at different frequencies……. 74
6.38 Motor B shaft voltage at 150 Hz (3rd harmonic)………..…. 75
6.39 Motor B shaft voltage at 450 Hz (9th harmonic) ……….. 75
6.40 (a) and (b): Stator current at different motor loads……….. 76
6.41 (a) and (b): Stator current for Motor A at different loads………. 77
6.42 (a) and (b): Axial vibrations at different motor loads……… 77
A.1 XY and RZ geometric model planes………. 85
A.2 Flow diagram of creating and solving a Maxwell 2D Model………. 87
E.1 CSMeter……… 99
E.2 CSI2130 Machine Health Analyser……….. 101
E.3 Current Clamps……… 102
LIST OF TABLES
Page
3.1 Axial vibration frequencies due to broken rotor bars when interbar currents
are present by Muller……… 17
4.1 Arnot Power Station ID Fan Induction Motor Dimensions…………. 25
4.2 Material Set-up of the Simulated Motor………..…………...….. 28
4.3 Comparison of theoretical and simulated stator currents for s = 0.004 ……… 32
5.1 Arnot Power Station ID Fan Induction Motor Specifications used for experimental measurements………. 36
5.2 LEM-flex RR3030 Specifications……….. 38
5.3 Digital Tachometer RM-1501 Specifications……… 40
6.1 Theoretical calculation of stator current fault frequencies for s = 0.004 ……… 49
6.2 Stator current rotor bar fault frequencies as in [40]……… 50
6.3 Stator current for Motor A at 65 % ……… 56
6.4 Motor A theoretical results of axial vibrations by Muller [26]……… 60
6.5 Shaft voltage rotor bar detection frequencies….……… 68
B.1 The data sheet of the DS1104 R&D Controller Board……….. 88
D.1 Theoretical Stator Current for 65% Load at s = 0.0047……… 94
D.2 Theoretical Stator Current for 70% Load at s = 0.0053……… 95
D.3 Theoretical Axial Vibration at 65% Load with s = 0.0047……..….. 96
LIST OF SYMBOLS
Arnot Arnot Power Station is one of the Eskom: Generation: Power
Station built in 1956 and situated in Middelburg, Mpumalanga.
B flux density along a conductor
EMF electromagnetic field
EPRI Electric Power Research Institute
ESKOM a major Electric Power Utility Corporation in South Africa f supply frequency ≈ fundamental frequency ≈ line frequency fsb frequencies of sidebands due to broken rotor bars
flsb lower sideband frequency
fusb upper sideband frequency
fb pole pass frequency
fslip slip frequency
Ib(x) bar current distribution along the length bar Ic total interbar current flowing into the core
In current in a healthy bar
It total current flowing in the broken bar and two adjacent bars k 1,2,3…n
l length of the core
Majuba Majuba Power Station is one of the Eskom: Generation: Power
Station built during 2003 and situated in Volksrust, Mpumalanga. MCSA Motor Current Signature Analysis
MMF magnetomotive force
n estimate of the number of broken bars
N average dB difference between the upper and lower sidebands and
the supply component.
OEM Original Equipment Manufacturer
p pole-pairs
qb interbar current harmonic in electrical measure
s slip frequency
R number of rotor slots
VA(x) differential voltage drops along healthy bar VB(x) differential voltage drops along broken bar
X axial position along the rotor core from healthy side
Zb bar impedance
CHAPTER 1 INTRODUCTION
Electric motors play a pivotal role in various industrial plant processes for electrical to mechanical energy conversion. Industrial medium voltage electric motor applications mainly include driving pumps, conveyors, fans, mills and compressors. The induction motor is the most commonly used motor type of its strength, reliability, relatively high efficiency and lower maintenance demand. An induction motor comprises of two essential components, a stator and a rotor. This research focuses on the rotor component of an induction motor. The rotor is composed of thin-slotted, highly permeable steel laminations that are pressed onto a shaft. There are two types of rotors: a squirrel cage rotor and a wound rotor but this research focuses on a squirrel cage rotor because of its construction. The squirrel cage rotor has conductors in the form of bars in the rotor slots and the bars are shorted together at each end of the rotor by an end ring to which the conductors are attached.
In an induction motor, the rotor rotates at a speed lower than the synchronous speed of the revolving field. The difference between the rotor speed and the synchronous speed is called the slip speed. The slip speed is commonly expressed in terms of slip, which is a ratio of the slip speed to the synchronous speed. The slip plays an important role in the diagnosis of faults in an induction motor, as it will be indicated in the analysis of results in this research.
Each motor is designed for a specific lifespan. Any failure during the stipulated lifespan has high financial implications in terms of loss of production and the cost of repairs. In an industry like Eskom, from which this research was initiated, medium voltage induction motors are mostly used in power generating stations and form the core of generating plant processes. Failure of some motors,
namely induced draught fan, forced draught fan and boiler feed pump motors lead to loss of power generation. Other motors, which are mill, primary air fan and ash pump motors operate on a redundant basis where one motor is on standby during normal operation but failure of more than one motor in the same generating unit can lead to loss of power generation. With Eskom presently, especially during winter seasons, experiencing high demand resulting in power shortages, generating plants reliability and availability is of utmost importance. Reliability and availability of plant electric motors can be achieved by early detection of any developing fault by performing condition monitoring and preventative maintenance on motors. An important motor failure mode, which has been quite challenging to detect, is cracking and subsequently breaking of rotor bars in induction motors. Haji and Toliyat [10] state that broken rotor bar and end ring faults (rotor failures) account for 5-10% of the induction motor failures.
The existing condition monitoring techniques are unable to positively detect a cracked or single bar problem during operating conditions and bars have broken, subsequently lifting out of the rotor slots and damaging all stator coils. This forces the removal of the motor during plant operation and a complete rewind of the stator.
This research was conducted to ascertain from existing conventional techniques, an optimal technique for the detection of a cracked rotor bar or a completely broken single rotor bar in induction motors under operating conditions. Furthermore, it explores non-conventional techniques and highlights broken rotor bar condition monitoring guidelines which can assist in performing measurements in industries.
In addition, this research addresses the following questions raised in [1]:
• Can the technique detect a cracked and one broken rotor bar on-line and immediately or periodic non-intrusive assessments are required?
1.1 Rotor Bar Failure Mechanisms
The frequent starting of a motor places the heaviest stress on the rotor bars because bars are carrying the highest current since the rotor is running at much lower than synchronous speed. The high currents cause heating and expansion of the bars relative to the rotor itself, and differences in electrical resistance of the individual bars result in uneven heating and uneven expansion. This leads to cracking of the joints where bars are joined to the short ring. This rotor bar failure phenomenon is called cyclic thermal stressing. Also, when the rotor is heated, the endring expands at a faster rate than the rotor core, creating additional stressing of the joint [27].
In addition the causes of bar cracks or breaks can be attributed to following reasons as indicated by Müller and Landy [26 - 27]:
• Bars in the region between the core and endring are exposed to large accelerating and decelerating forces. These centrifugal forces place excessive stress on the bars in the unsupported region – causing fatigue in the joint between the bar and the endring.
• When the motor is started, the current migrates to the top of the bar due to skin effect. This current migration creates temperature gradient over the depth of the bar because the top of the bar heats faster than the bottom of the bar. This uneven expansion stresses the joints at the endrings, and can cause the bar to separate from the endring.
• Manufacturing defects are a cause of broken rotor bars. Poor brazing of the bat onto the endring results in a weak joint. A weak joint along with the heating of the bar and large centrifugal forces can result in a cracked bar. A further cause of broken rotor bars due to manufacturing defects is loose rotor
bars. Rotor bars that are loose in the rotor core also place excessive stress on the endring joint.
1.2 Structure of the Research Report
Chapter 2 highlights previous researches conducted on detection of broken rotor bars which has assisted in better understanding of the existence of interbar currents and axial forces, factors influencing early detection of broken rotor bars and development of broken rotor bar detection techniques.
Chapter 3 discusses the literature and analysis of different broken rotor bar detection techniques. These detection phenomena originated from the researches presented in Chapter 2. The broken rotor bars identifying frequencies in each technique are presented.
Chapter 4 presents modelling of a broken rotor bar simulation using Maxwell 2D. The simulation was performed to investigate the induction motor stator current that is how the sidebands change in a single broken bar rotor with respect to a healthy rotor.
Chapter 5 discusses the experimental work conducted to validate the literature and practical implementation of the techniques. This chapter explains the measuring process and the set up of the equipment used in the experimental work, capturing and analysis of data.
Chapter 6 presents the experimental results from the industrial tests performed on the research with discussions of measurements taken. Finally, Chapter 7 presents the conclusion and recommendations on the effective technique on detection of broken rotor bars during operation.
The author hopes that the research report recommendations assist in early detection of a cracked and a single broken rotor bar on-line during operation without intrusion to the motor.
CHAPTER 2
BACKGROUND ON DETECTION OF BROKEN ROTOR BARS
A lot of research work and case studies have been performed and are still being performed on detection of broken rotor bars but the main problems seem to be analysis of the measurements and correct diagnosis especially for a cracked and one broken rotor bar. It is important to note that most techniques seem to detect broken rotor bars when many of the rotor bars have already broken, this is not effective as the damage is quite severe at that stage.
2.1 The Interbar Currents Phenomenon
Kerszenbaum [14, 15, 16] together with Landy introduced the concept that in an induction motor with rotor bars not insulated to the rotor core, interbar currents exist when there is a broken rotor bar. In the research, the following assumptions were made:
• The laminar currents flow only between the broken bar and the two immediately adjacent bars. (This assumption is valid when the endring impedance represents only a small part of the total secondary impedance, as is usually the case with large machines).
• The voltages induced in the three bars (broken bar and adjacent bars) are equal in magnitude and are in phase with one another. (This is valid when the number of rotor slots per pole is relatively high).
• The interbar impedance is mostly resistive at the frequencies dealt with. (This fact was verified by measurement).
• The end ring impedance between the bars is negligible.
• The portion of the bars between the end ring and the core is disregarded. Kerszenbaum developed a term which describes the distribution of currents in an induction motor having a broken bar and experimentally showed that the
magnitude of the current flowing into the broken bar and the magnitude of the interbar currents varies with the slip. The theory was later expanded by Muller [26] who derived an equation for the interbar current density entering the rotor core. The derivation of the equations is discussed in details in Chapter 3.
2.2 Factor Influencing the Detection of Broken Rotor Bars
The early detection of broken rotor bars is mainly affected by the rotor and stator geometrical nonuniformities or asymmetries. Kliman et.al. [19] named these asymmetries as rotor quality, cage misalignment, variation of cage conductivity, bearing misalignment and magnetic orientation of the laminations. These asymmetries may create airgap disturbances which, as far as its fundamental field is concerned, cannot be distinguished from the broken bar effects. By investigating the airgap flux Kliman et. al. [19] showed that the magnitude of the line frequency sidebands due to asymmetries might be comparable to or larger than those due to broken rotor bar in the same motor. But the magnitudes of the asymmetry components decay much more rapidly in higher harmonics, than those of broken rotor bar.
Walliser [40] under the supervision of Landy undertook a research to investigate factors influencing detection of broken rotor bars. Walliser revisited the work done by Kliman et. al. [19] by showing the influences of the stator winding layout, the presence of other rotor asymmetries, the rotor inertia, and lastly the presence of interbar currents.
As it is not possible to measure the rotor bar current during operation, the fault measurements are taken from the stator winding. The fields produced by the fault will result in a flux linking with the stator windings, which will induce an EMF and consequently current in the stator winding. The layout of the stator windings will cancel the response to certain harmonic components that would normally exist in the airgap of the machine due to the fault. The magnitudes of the
harmonics that are able to induce currents in the stator are also modified by the stator structure.
Walliser [40] stated that due to short chording in the stator winding, which is done to reduce harmonic effects, the EMF the fault harmonics can induce in the stator can be reduce by a factor, known as the chording factor. Also the distribution of coils in one phase of the stator winding will result in the EMF, the fault harmonics can induce, requiring to be multiplied by a factor, called the distribution factor. Lastly, the other factor is the harmonic differential leakage coefficient. This is due to the fact that each harmonic voltage induced into the stator by the fault field, produces in turn its own set of harmonics. These harmonics act as an extra reactance to the induced current, and will thus reduce its magnitude.
The influence of the presence of interbar was demonstrated in [40] by testing an induction motor with a healthy cage, one broken uninsulated bar (interbar currents flow) and insulated bar (no interbar currents). Theoretically and experimentally, it was shown that interbar currents reduce the magnetic imbalance brought by a broken rotor bar and consequently the sidebands produced in the stator current spectrum. This then makes early detection of broken rotor bars more difficult especially if monitoring sidebands around the fundamental as sidebands may be reduced to levels due to other factors.
Kliman et. al. [19] then later Walliser [40] after further examination of the above mentioned factors recommended monitoring higher harmonic amplitudes asymmetries in the spectrum in conjunction with the sidebands around the fundamental, for correct diagnosis or early detection of broken rotor bar in a motor.
Another factor influencing the early detection broken rotor bars is the lack knowledge, by condition monitoring personnel on industrial plants, where
induction motors are being operated, on detection of broken rotor bars. The following questions were raised in Eskom [1]:
(i) What techniques and equipment exist to detect broken rotor bars on-line? (ii) How to perform the rotor bar detection techniques i.e. where to measure
to get optimum results?
(iii) What indicates a broken bar on any techniques’ spectrum? (iv) How often to perform broken rotor bar condition monitoring?
These questions prompted and are the basis of this research. The research tries to bridge the gap between researched detection techniques and utilization of these techniques in industrial plants. The author hopes all the research questions are answered and the gap will be bridge by this research.
2.3 Axial Vibration Monitoring
After realising that Kerszenbaum [15] and Hop [11] could not explain the origin of the axial vibrations that existed in a motor with broken rotor bars, Muller [26] under the supervision of Landy undertook a research to identify the origin of the axial forces. Mullers’ research showed that interbar currents in the rotor do in fact produce an axial force at specific frequencies. The theory was verified by experimental measurements on several different motors and with this consolidated the technique of measuring these frequencies in the axial vibration as a reliable method to detect broken rotor bars.
The expressions for these axial vibration frequencies are discussed in Chapter 3.
2.4 Thermal Consideration due to Interbar Currents
One of the major factors which cause rotor bar failures is thermal stress but before Zachas [42] very little research work had been done to examine the effects or existence of heating in a motor with a broken rotor bar especially when
interbar currents are present. Zachas investigated the relationship between interbar currents and the thermal effects that might occur as a result of these currents.
Zachas derived calculations and developed models to predict the temperature distribution for various conditions a motor will be subjected to. Through experiments, a good correlation between heating and interbar currents was achieved and a conclusion was made. The conclusion drawn was that the heating follows the same distribution as the interbar currents and is concentrated at the unhealthy side of the broken rotor bar.
2.5 Other Research Work and Case Studies
EPRI [48] initiated research projects to study motor problems and how they can be detected, which provided intelligence that contributes to motor condition monitoring and a predictive maintenance strategy. One aspect of the research projects was detection of broken rotor bars with one rotor bar cut by 50%, same bar cut 100%, a second bar, located 180º degrees from the first bar, cut 100%, and lastly two additional bars were cut 100%. The two additional bars were located adjacent to the original cut bar, making four total bars cut. Each motor was run at 0%, 50%, and 100% and back down to 50% of rated load.
The tests performed or data collected on each motor were vibration data, motor current signature analysis data, power signature data and flux data which were done on-line at each of the data points with the motor circuit analysis data being collected off-line.
The EPRI research project results were analysed by each utility analyst for their respective equipment and also by the equipment vendors. A vendor and utility analyst was given a copy of only their data, without any information about the specific fault that were induced in each motor. The results, recommendations
and conclusions of the research project may be examined by obtaining Electric Motor Predictive Maintenance Program, TR-108773-V2 Final Report [48] but it must be highlighted that the research findings show that it is possible to perform early detection of broken rotor bars.
McCully and Landy [22] evaluated the on-line condition monitoring techniques for detecting broken rotor bars, by evaluating both current and vibration signals and taking cognisance of interbar currents. The conclusion on the evaluation was that measurement of both current and vibration signals taking cognisance of interbar currents can provide an accurate diagnosis of the condition of the bars in large squirrel cage induction machines.
Thomson and Fenger in [38, 39] discuss the development of a tool to detect faults in an induction motor using current signature analysis. Furthermore, using the developed tool performs case studies by performing current analysis on different motors. The tool was developed to include the following crucial features:
• Unambiguous diagnosis of a fault over a range of motor faults.
• Correct estimation of the slip for any given load conditions for a range of motor designs and power ratings.
• Clear discrimination between unique current signature patterns caused by a fault and any current components induced due to normal characteristics of the drive system.
• Current components caused by the effect of mechanical load must be reliably diagnosed since they can be misinterpreted as components from broken rotor bar.
• The goal is to eliminate the need for an expert to interpret the acquired data by applying reliable, advanced diagnostic algorithms to the spectra.
The tool developed in the research by Thomson and Fenger is the CSI Meter. The CSI Meter was used in the research and more detailed specifications are included in Appendix E.
CHAPTER 3
BROKEN ROTOR BARS DETECTION TECHNIQUES 3.1 Interbar Currents
As soon as a crack develops, the resistance of that bar increases, increasing its heating, and consequently worsening the crack. At the same time, the adjacent bars experience increased currents because of the reduced current in the cracked or broken bar.
Kerszenbaum and Landy [14, 15, and 16] proved that interbar currents exist when a rotor bar is broken in large copper bar squirrel cage induction motors with uninsulated rotor bars. Interbar currents can flow in the laminated core, perpendicular to the bars.
Figure 3.1: Kerszenbaum and Landy’s model of the broken bar region [14]
The model assumes that the break occurs along the bar between the core and the endring. This is justified by realising that the most likely region of failure (weakest mechanical point) in the rotor is the joint between the bar and endring. Other assumptions, used to derive the expression for current distribution in the broken rotor bar, have been mentioned in the previous chapter in section 2.1. The current distribution in the broken bar is based on the impedance distribution rather than the voltage distribution. This is justified by the assumption that the voltage across all three, i.e. the broken bar and the two adjacent bars, is constant. In the model, the total current flowing in all three bars is expressed by It with the current flowing in a healthy bar being In.
X Broken Bar Endring l B Ic Ic It/2-Ib(X) Endring Ib(X) It/2-Ib(X) Ib(X) dVA(X) dVB(X) dX
The current distribution along the broken bar length is thus given by:
( )
( )
( )
⎥ ⎦ ⎤ ⎢ ⎣ ⎡ − = l x I x I n b λ λ cosh cosh 1 2 (3.1)The magnitude and distribution of current in the broken bar depends on λ. λ is defined as the ratio of bar impedance (Zb) to interbar impedance (Zc). But due to the assumption that Zc is mostly resistive at relevant frequencies, λ then becomes: c b R Z 3 = λ (3.2)
In order to determine the current entering the broken bar Kerszenbaum [14] considered the current distribution given in eq. 3.1 at x = 0. The current entering the broken bar thus becomes:
( )
( )
⎥= ⎢⎣⎡ − ⎥⎦⎤ ⎦ ⎤ ⎢ ⎣ ⎡ − = = λ λ cosh 1 1 cosh 1 1 0 2 b n n bb I l I I I (3.3)The bar length is normalised since x = 0 and is omitted from the equation.
3.2 Axial Vibration Monitoring
The interaction between the stator flux and the interbar current produce an axial force. The interbar currents and stator flux both contain not only fundamentals, but also harmonic components, which interact with each other to produce a force.
Figure 3.2: Production of axial force model by Muller [30]
Muller [25-26 and 28 - 30] used the following assumptions regarding the model:
• A linear system is assumed, where the principle of superposition applies and effects of saturation may be ignored.
• The interbar currents only flow between the broken bar and the two immediate adjacent bars. (The same assumption was made by Kerszenbaum).
• The normal bar current for these two adjacent bars is excluded. (These bar currents provide not relevant information about the axial force, and can be superimposed on the model at a later stage).
The axial-force frequencies are determined by realising that both the flux density and the interbar currents consist of time harmonics. Consequently the product of the flux density and the rotor currents yields an array of axial force frequencies.
Rotor slots Force Vertical Horizontal Axial Stator mmf wave Interbar currents Force
The axial force frequencies used to diagnose interbar currents are [30]:
(
) (
)
[
q q q q s]
f fv = − a + b + a − b (3.4) or[
(
2−qa −qb) (
+ qa +qb)
s]
f (3.5) where b a q q , = 1, 5, 7…., f = supply frequencys = per unit slip
The derived mathematical analysis of the frequency content of the axial force shows that the spectrum of the axial vibration is an array of frequencies. These frequencies are given in Table 2 below, where x is a multiple of 6.
Group Frequency Component 1 Frequency Component 2 Frequency Component 3 1 - 2sf - 2 (6-8s)f (6-6s)f (6-4s)f 3 (12-14s)f (12-12s)f (12-10s)f 4 (18-20s)f (18-18s)f (18-16s)f 5 (24-26s)f (24-24s)f (24-22s)f 6 (30-32s)f (30-30s)f (30-28s)f 7 (36-38s)f (36-36s)f (36-34s)f 8 (42-44s)f (42-42s)f (42-40s)f - - - - n (x-(x+2)s)f (x-xs)f (x-(x-2)s)f
Table 3.1: Axial vibration frequencies due to broken rotor bars when interbar currents are present by Muller [26].
3.3 Stator Current Monitoring
The stator current monitoring is the most commonly used method for detection of broken rotor bars. McCully and Landy in [22] explained why the stator winding is monitored. The positive-sequence supply voltage applied to the stator winding produces current in the stator winding. This stator phase current produces space harmonic fields in the airgap of an induction machine, which consist of either backward or forward rotating components.
Each of these space harmonic fields induces current components into the copper bars of the squirrel cage rotor. In turn, each of these rotor current components produces field components back into the airgap of the machine. These rotor produced fields induce current components back into the stator winding. Then depending on the condition of the rotor the following will occur:
• If the rotor of the machine is symmetrical (without any rotor fault), the forward rotating components will add and the backward components will sum to zero.
• However, if the rotor of the machine is asymmetrical (with a rotor fault), the backward rotating field components do not sum to zero. These backward rotating components produce sidebands around all the rotor produced current components in the stator winding.
The rotor produced fields’ current components that are induced in the stator winding at frequencies given by:
fsb = f
(
1±2s)
(3.6)Kliman [19], Thomson [39], Elkasabgy [9] and Filipetti [3] used eq. 3.6 to analyse the motor supply current to detect broken bar faults. Their investigations involved investigating sideband components around the fundamental for
detecting broken bars. The lower sideband frequency component flsb is specifically due to the broken bar and the upper sideband frequency component
usb
f is due to the consequent speed oscillation.
(
s)
f
flsb = 1−2 (3.7)
and
fusb = f
(
1+2s)
(3.8)Filipetti et. al. in [3] showed that broken bars actually give rise to a sequence of such sidebands given by:
fsb = f
(
1±2ks)
(3.9)where k = 1, 2, 3,.…
Kliman et.al. [19] expressed the frequencies that are present in the air gap flux due to broken bar faults and that can be observed in the stator current as:
(
)
⎥ ⎦ ⎤ ⎢ ⎣ ⎡ ± − ⎟⎟ ⎠ ⎞ ⎜⎜ ⎝ ⎛ = s s p k f fsb 1 (3.10) where p k = 1, 3, 5…,These are the high frequencies, which should be observed as the fundamental frequency may be influenced by other factors for early detection of broken rotor bars.
Benbouzid [4] upon reviewing the motor current signature analysis for fault detection suggested that the amplitude of the left sideband frequency component is proportional to the number of broken rotor bars. Then approximated the amplitude I of frequency component f = f
(
1−2s)
by:(
π α)
α − ≅ 2 2 sin p I I s brb (3.11)where Is = stator current fundamental frequency component
R p Rb π α = 2 (3.12)
R = number of healthy rotor bars
b
R = number of broken rotor bars
Thomson et.al. [38] when developing the tool for detection of broken rotor bars used the equation of the estimation of the number of broken rotors (broken bar factor) as follows: p R n N + = 20 10 2 (3.13) where
n = estimate of the number of broken rotor bars R = number of rotor slots
N = average dB difference between the upper and lower sidebands and the supply component
p = number of pole pairs
Walliser [40] then later Muller [26], with Landy highlighted that the fault frequencies in the stator current spectrum can also be calculated by:
sf q n fs = r 1 ± (3.14) where r
n = rotational speed of the rotor in rev./sec.
1
q = harmonic in mechanical measure
The stator slot harmonics are calculated according to p
S
q1 = 1± (3.16)
1
S = number of stator slots p = number of pole pairs
3.4 Flux Monitoring
Kliman et.al. [19], and Tavner and Penman [37] state that axial leakage flux occurs in all electrical machines due to the fact that no machine can be constructed perfectly symmetrical. Kliman et.al. [19] by mounting an external axial flux coil around the shaft of the motor, determined that the axial gap flux frequencies that are present due to machine asymmetrices can be expressed by eq. 6 with k = harmonic index = 1, 2, 3, …. There were two important features noted by Kliman et. al:
• The magnitude of the line frequency sidebands due to asymmetries may be comparable to or larger than those due to a broken rotor bar in the same motor, and
• The magnitudes of the asymmetry components decay much more rapidly, in the higher harmonics, than those for a broken rotor bar.
Two conclusions were drawn from the above features; the first conclusion to be drawn is that there is real possibility that, with sensitivity sufficient to detect a single broken rotor bar, manufacturing or other asymmetries may give rise to a false broken bar indication. The second conclusion that may be drawn is that by examination of the higher harmonic amplitudes asymmetries may be distinguished from broken bars, hence the development of eq. 10 to monitor these higher harmonic asymmetries.
Milimonfared et. al. [13] stated that the reaction by
(
1±2s)
f sideband harmonics of the stator current with the rotor produces currents with the frequency of3sf .As a result of rotor asymmetry, the stator currents contain harmonic components of by
(
1±ks)
f and the rotor currents contain harmonic components of±ksf(k =1,3,5..). These harmonic components are the sources of MMF harmonics and, consequently the flux harmonics in the motor structure. Under the rotor asymmetry, these MMF harmonics produce shaft fluxes with the harmonic components of±ksf(k =1,3,5..).The results in [13], after testing by inserting four search coils in a three phase six-pole induction motor, showed the existence of sf , 3sf , 5sf and7sf voltage
harmonics in the search coil surrounding the shaft at the faulty end due to the rotor asymmetry.
Even though the commonly used method of broken rotor bar detection is stator current monitoring, the stator current broken rotor bar fault frequencies can be applied to flux monitoring. Walliser [40] holds the same opinion since in the stator current monitoring; the stator winding acts as a coil whereas with flux monitoring an external mounted coil can be used. Walliser suggests that the points applicable to current monitoring technique can be applied to flux monitoring technique.
3.5 The Effects of Load
Kilbey [17] assessed the effect of the load on detection of broken rotor bars and concluded the following:
• The degree to which the motor is loaded affects the temperature of the motor which in turn affects thermal expansion of cracks and breaks. Reduced load may not produce enough heat to open cracked bars.
• Load also affects the speed of the motor. As the motor becomes more heavily loaded, the rotational frequency slows and the slip frequency increases. The
greater the slip, the greater is the frequency separation that can be observed between sideband and line frequency. The lighter the load, the larger the ratio between line frequency amplitude and that of the sideband; especially, as load moves below 50 percent of full load. From 50 to 100 percent load this effect is less significant.
Schoen and Habetler [33] investigated the effects of time-varying loads on rotor fault detection and observed that if the load torque varies with the rotor position, the current spectral harmonics, produced by the load, contain the spectral components, which coincide with those caused by a fault condition. Schoen and Habetler then recommended monitoring of multiple frequency signatures and identifying those components not obscured by the load effect. Benhouzid and Kliman [5] expanded on this, suggesting that broken rotor bars detection is still possible since the current typically contains higher order harmonics than those induced by the load.
CHAPTER 4
MAXWELL 2D SIMULATION OF A CRACKED AND BROKEN ROTOR BAR
The simulation involved analysis of a cracked and single broken rotor of the squirrel cage induction motor using Maxwell 2D Field Simulator. Maxwell 2D Field Simulator is an interactive software package that uses finite element analysis to solve two-dimensional (2D) electromagnetic problems. In performing the simulation to analyse a problem, an appropriate geometry, material properties and excitation for a device or system of devices need to be specified.
4.1 Induction Motor Simulation Parameters
This section presents quantities and parameters used in creating and solving the induction motor for this research. A general procedure for creating and solving a Maxwell 2D model is presented in Appendix A. The simulation was done using guidelines in [2], especially on material, boundary and sources setup and the setup solution.
The induction motor simulated for this research has similar characteristics as the motors used in the industrial motor testing in Chapter 5. The physical motor dimensions measured and used in the simulation are tabulated in Table 4.1.
Stator Dimensional Details
Description Dimension
Stator Lamination OD to inner casing 18 mm
Stator Lamination ID 888 mm
Stator Winding Depth (1 coil) 45 mm
Stator Winding Thickness 20 mm
Stator Winding Slot 100 mm
Coil Span 6 slots (1-7)
Stator Core Length 980 mm
Stator Winding + Overhang Length 1400 mm
Stator Wedge Depth 5 mm
Stator Wedge Thickness 15 mm
Rotor Dimensional Details
Rotor Lamination OD 884 mm
Rotor Length 890 mm
Rotor Slot Type T-bar
Rotor Lip Depth 13 mm
Rotor Lip Width 7.5 mm
Rotor Lip Depth 25 mm
Rotor Lip Width 13 mm
Rotor Bridge Depth 4 mm
Endring Width 50 mm
Endring Thickness 18 mm
Endring ID 764 mm
Calculated Endring Circumference 2400 mm
Support Limp Thickness x 6 52 mm
Support Limp Depth x 6 200 mm
Rotor Shaft OD 176 mm
4.1.1 Creating the Model
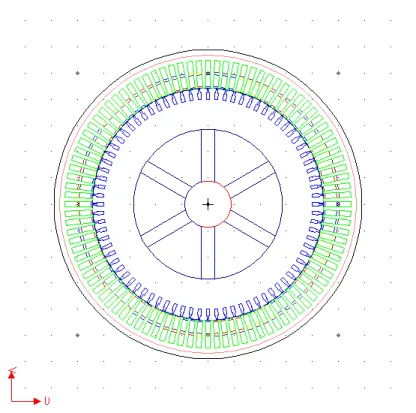
The solver used for the simulation is the Transient with the model drawn on the XY plane using the dimension in table 2.1. The 2D Modeler was used to create a two dimensional geometric model shown in Fig. 2.3.
Figure 4.1: The geometric model of the simulated induction motor
The only assumption made in the model is that the casing of the motor is where cooling pipes are in the industrial motors used in the experiment. This was done in order to optimise the model as this has no major impact on the simulation. The step by step drawing of the model was done using Maxwell 2D User Manual and Training Models. In drawing the model, stator and rotor slots as well stator coils and rotor bars were drawn as single objects then duplicated around origin (0, 0). This process was also performed for drawing of the rotor support limp objects. Otherwise, the other motor simulation objects, like motor casing and airgap band, were drawn using 2D Modeler/Object/Circle.
After finalising the model, the created objects were grouped using Define Model/Group Objects with respect to their functions and stator-winding layout. The 80 rotor bars were grouped as Rotor_Bars, support limps as Rotor_Spider, winding insulation as Winding_Insulation, stator slots as Stator_Core, rotor slots as Rotor_Core and finally the stator coils (windings) were grouped in phases and with respect to flow current direction e.g. PhaseAn (phase A negative) and PhaseAp (phase A positive).
4.1.2 Materials Setup
The next step, in simulating the motor in Maxwell 2D after grouping the objects, is assigning the materials. The materials were assigned as follows:
Object Material [AirGap_Band] vacuum [Motor_Casing] air [PhaseAn] copper [PhaseAp] copper [PhaseBn copper [PhaseBp] copper [PhaseCn] copper [PhaseCp] copper [Rotor_Bars] copper [Rotor_Core] non-conductive [Rotor_Spiders] non-conductive Shaft steel_1010 [Stator_Core] non-conductive [Winding_Insulation] mica Table 4.2 Material Set-up of the Simulated Motor
The stator and rotor cores were setup as non-conductive materials with a conductivity of zero so as for current to flow only in the stator windings and rotor bars.
4.1.3 Boundary and Sources Setup
This step in the simulation process is used to setup the sources and to assign the endring parameters. It must be noted that in electric motors, windings are generally voltage supplied with the resulting currents dependent on the resistance of the winding and the back electromotive force (EMF). The motor casing was setup as the boundary and the following materials setup as follows:
• The endring was setup as a passive end-connected conductor with 0.008 ohms in the end resistance between adjacent conductors and 0.005 henries in the end inductance between adjacent conductors.
• The phases were assigned the voltage sources as stranded with the following functions:
• PhaseA=3300*sqrt(2/3)*cos(2*pi*50*T)
• PhaseB=3300*sqrt(2/3)*cos(360*50*T - 120)
• PhaseC=3300*sqrt(2/3)*cos(360*50*T - 240)
The windings in each phase were assigned as positive and negative polarity according to grouping in section 2.2.1. Furthermore, the terminal attributes were assigned; the resistance value of 8 ohms, inductance of 0.003 henries, 200 total turns as seen from the terminal and 4 number of parallel branches. 4.1.4 Setup Solution
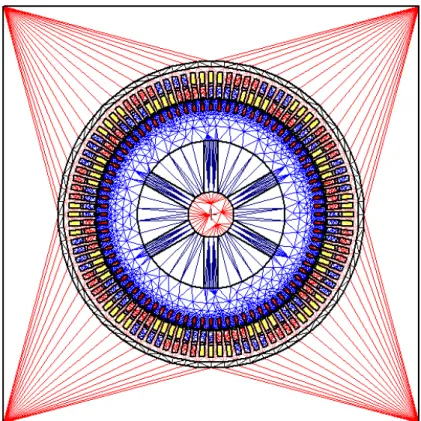
The important part of the Maxwell simulation is meshing. The quality of the mesh is critical to the accuracy and the convergence of the field solution. The mesh must be fine in regions where a large magnetic field gradient occurs (such as air gaps and rotor bars) and large elsewhere.
The process executed, for this simulation, was by choosing Manual Mesh and then accepting the number of levels for the QuadTree Seed. From this, a basic coarse mesh was generated and had to be refined for an accurate solution. The refining occurred by selecting objects, which are critical for solution accuracy. The number of elements in the AirGap_Band, Rotor_Bars and Stator_ Coils were made greatest to obtain a more accurate solution.
As a result of the refining for the accurate solution, the mesh was created as shown in Fig. 4.3 below.
Figure 4.3: Maxwell 2D simulation mesh 4.1.5 Solution Options
The ‘Time Step’ which instructs the solver to calculate the fields at each stipulated time of the solution process, was chosen in a manner to be able to study even high frequency harmonics as will be seen in the simulation results. The model depth was chosen to be 980 mm which is the length of the stator winding.
4.1.6 Motion Setup
For the motion setup a band was defined in the airgap. The band can be defined as a moving object that contains all moving objects. Then rotation was selected as the type of motion to be used with the set position at (0, 0) as the centre of
rotation. The mechanical setup of the motor was set at 747 rpm for the same load of the motor being that was used in the experiment.
4.1.7 Signal Processing
The simulation stator current signals were then exported and processed using Matlab to perform an FFT. The FFT function used and processing is explained in more detail in Chapter 5 section 5.3.2.
4.2 Induction Motor Simulation Results
Figure 4.4: Simulated stator current at the 5th harmonic
Fig. 4.4 shows a high increase in the amplitude of the simulated stator current at the 5th harmonics after a rotor bar break where
(
)
f s
6
5− component is.
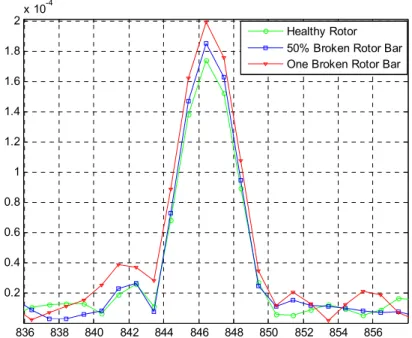
Whereas, Fig. 4.5, below, shows a slight increase after a rotor bar crack (50% broken rotor bar).
244 246 248 250 252 254 256 0 0.2 0.4 0.6 0.8 1 1.2 1.4 1.6 1.8 2x 10 -3 Healthy Rotor 50% Broken Rotor Bar One Broken Rotor Bar
Figure 4.5: Simulated stator current at the 17th harmonic
Component Harmonic Theoretical Fault Frequency (Hz) Simulated Fault Frequency (Hz) (1−2s)f 1 49.6 49.4 (3−4s)f 3 149.2 149.1 (5−6s)f 5 248.8 249.1 (7−8s)f 7 348.4 349.2 (9−10s)f 9 448.0 448.2 (11−12s)f 11 547.6 548.3 (17−18s)f 17 846.4 846.4 (19−20s)f 19 946.0 946.5 (21−22s)f 21 1045.6 1046.5 (27−28s)f 27 1344.4 1345.5 (43−44s)f 43 2141.2 2141.5 (53−54s)f 53 2639.2 2638.8 (61−62s)f 61 3037.6 3038.8
Table 4.3: Comparison of theoretical and simulated stator currents for s = 0.004 836 838 840 842 844 846 848 850 852 854 856 0.2 0.4 0.6 0.8 1 1.2 1.4 1.6 1.8 2x 10 -4 Healthy Rotor 50% Broken Rotor Bar One Broken Rotor Bar
The theoretical and simulated stator current frequencies for detection of rotor bar faults for the simulated motor at s = 0.004 are very similar to each other especially in lower harmonics. This indicates that the simulation results give a good indication of rotor bar detection frequencies for the conditions, the motor was simulated under. These frequencies are later utilised for the detection of a cracked and broken rotor bar in the experiment of the research.
Figure 4.6: Normalised simulated stator current results
The simulation was done in order to study broken rotor bar detection frequencies and observe how much the current amplitudes vary from no broken rotor bar, cracked rotor bar (half broken bar) to completely broken bar. Figure 4.6 indicates the variation of the stator current amplitudes on different harmonics. The
(
5−6s)
f component (5th harmonic) shows a 3 times increases from no broken bar to a half broken rotor bar then a 12 times increase for a completely broken rotor bar. The(
7−8s)
f and the(
11−12s)
f components show a 6.1 and 5.3 timesNormalised Simulated Stator Current Spectrum Amplitudes
0.0 1.0 2.0 3.0 4.0 5.0 6.0 7.0 8.0 9.0 10.0 11.0 12.0 13.0 49.4 149.1 249.1 349.2 448.2 548.3 846.4 946.5 1046.8 1344.5 2141.5 2639.1 3038.9 Frequency [Hz] Normalised St at or Current Amplitude
No Broken Rotor Bar Half Broken Rotor Bar One Broken Rotor Bar
increase after a completely broken rotor bar respectively with no increase after a rotor bar crack. In other harmonics, there are slight increase as can been seen in Figure 4.6.
4.3 Induction Motor Simulation Conclusion
The results of the Maxwell 2D simulation affirm the theoretical rotor bar detection frequencies, which are expressed by eq. 3.10. Most theoretical and simulated rotor bar detection frequencies are within or less than 0.5 Hz of each other. Furthermore, the results show how the stator current amplitudes vary at specific frequencies from no broken bar to a cracked bar and then to a completely broken bar. When a bar is completely broken there is a significant increase in the stator current amplitude. This simulation study gave a base for the broken rotor detection frequencies to be examined when performing the experimental measurements on industrial squirrel cage induction motors.
CHAPTER 5
EXPERIMENTAL TESTING DETAILS AND DATA PROCESSING 5.1 Experimental Test Details
Recently, a high frequency of electric motor failures due to broken rotor bars have been experienced at Eskom generation power stations. This prompted an investigation to determine an optimal technique to detect breaking of bars at the inception of the break.
The research involved uses a wide range of conventional broken rotor bar detection techniques and also explores new detection techniques. The testing was performed using different measuring instruments, operated by a number of test personnel from different companies and most importantly analysis of results. The experimental testing involved testing of two industrial induction motors which had operated as induced draught fan motors at Arnot Power Station. The testing was performed at a motor repair workshop, which had a capability to load a motor to simulate operating plant condition. The two induction motors were of the same design, even though other the motor had indications that it might have been rewound before.
The conventional rotor bar detection techniques performed were vibration (radial and axial) monitoring and stator current monitoring. The non-conventional techniques explored were shaft voltage and leakage flux monitoring (leakage flux results included in Appendix F). The tests measurements were taken under different condition of the rotor bar that is without any broken rotor bar, half broken rotor bar and fully broken rotor bar at different loads. The first phase of testing, involved testing the motors as received with an assumption that there were no broken rotor bars. The second phase of testing, involved testing after inducing a
rotor bar fault into the two induction motors with the testing personnel not knowing which one had what fault induced on it.
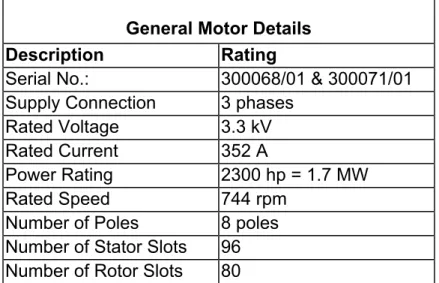
The motor details are provided below in Table 5.1.
General Motor Details
Description Rating
Serial No.: 300068/01 & 300071/01
Supply Connection 3 phases
Rated Voltage 3.3 kV
Rated Current 352 A
Power Rating 2300 hp = 1.7 MW
Rated Speed 744 rpm
Number of Poles 8 poles
Number of Stator Slots 96 Number of Rotor Slots 80
Table 5.1: Arnot Power Station ID Fan Induction Motor Specifications used for experimental measurements
The other motor details, which include dimensional details of the motors, were earlier included in Chapter 4.
Fig. 5.1 (a) and (b) illustrate a half-broken and one fully broken rotor bar used in the experimental testing. This specific rotor was used in the initial experimental measurements performed in 2005 indicated in Chapter 5 in [47] when the project initial commenced but is of the similar design as the motors used in the experiment for this research.
5.2 EXPERIMENT MEASURING INSTRUMENTS
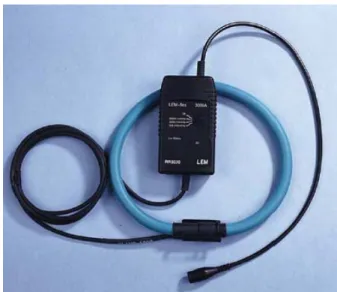
5.2.1 Current Transducer
A current transducer was used to capture the current induced into the stator winding by rotor bars. The current transducer used was a LEM-flex RR3030 AC current probe which is a Rogowski coil and works on the Rogowski principle. The Rogowski coil consists of a helical coil of wire with the lead from one end returning through the centre of the coil to the other end, so that both terminals are at the same end of the coil. The whole assembly is then wrapped around the straight conductor whose current is to be measured. Since the voltage that is induced in the coil is proportional to the rate of change (derivative) of current in the straight conductor, the output of the Rogowski coil is then connected to an electrical (or electronic) integrator circuit in order to provide an output signal that is proportional to current.
Figure 5.2: LEM-flex RR3030 AC current probe
LEM-flex RR3030 Specifications
Current Measuring Range 30 – 3000 A
Output 100 – 1 mV/A Frequency Range 10 Hz – 50 kHz Accuracy 1 % of range Operating Temperature -20°C to 85°C Noise 4 mV Phase Error (<1°) 45 – 65 Hz (<10°) At 20 kHz Table 5.2: LEM-flex RR3030 Specifications
The Rogowski coils were wrapped around the motor supply cables in each phase. Then the current signals from each phase were captured through coaxial cables using a dSpace adaptor box and fed into a dSpace data acquisition card DS1104.
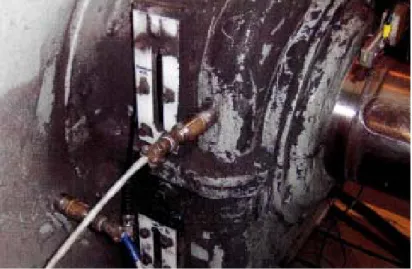
5.2.2 Vibration Sensors
As it is not easy to measure the vibration on the rotor, the most appropriate solution is to measure on the frame of the motor, since the force on the rotor is transferred through the bearing to the motor frame. Also Muller [28] stated the principal frequencies of axial force act on the rotor and are transferred directly as an axial vibration to the frame via bearings. It is important to realise that these frequencies in the axial vibration spectrum are also modulated by the inherent vibration of the rotor at rotational speed. The origin of the rotational force is due to mechanical unbalance.
The vibration sensors utilised in the experiment were accelerometers of an analog style accelerometers which outputted a continuous voltage that is proportional to acceleration 100mV/g. The accelerometers were magnetically to the body of the motor at the DE of the motor. Radial and axial vibration measurements were taken for the experiment.
The vibration signals were then passed through a charge amplifier by coaxial cables then to the dSpace card DS1104 as indicated in Figure 5.6 below.
5.2.2 Speed Sensor: Tachometer
The motor speed was measured using a digital tachometer, model RM-1501.
Figure 5.4: Digital Tachometer RM-1501 for speed measurement The tachometer was then connected by a coaxial cable to the dSpace card DS1104 as indicated in Figure 5.6 below.
Digital Tachometer RM-1501 Specifications
Range Resolution Accuracy
RPM (optical) 10.00 to 99999 rpm 0.01/0.1/1 0.04% ± 2dgtst
RPM (contact) 20.00 to 29999 rpm 0.01/0.1/1 0.04% ± 2dgtst
Sampling Rate 0,7 sec (>60 rpm) & 1 sec (10 to 60 rpm)
Measuring Distance 50 to 300mm
Operating Temperature 0ºC ~ 50ºC
Range Selection Automatic
Accessories Software and RS-232 interface
5.3 DATA ACQUISITION AND PROCESSING
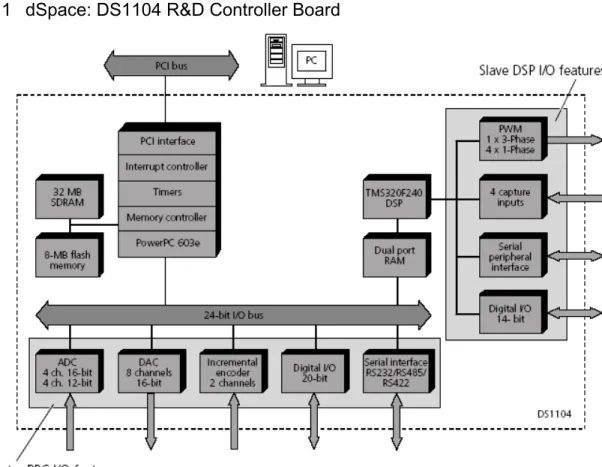
5.3.1 dSpace: DS1104 R&D Controller Board
Figure 5.5: An overview of the architecture and functional units of the DS1104 The DS1104 R&D Controller Board provides the following features:
• Master PPC representing the computing power of the board, and featuring several I/O units
• Slave DSP featuring further I/O units
• Interrupt controller providing various hardware and software interrupts
• Memory comprising DRAM and flash memory,
• Timers providing a sample rate timer, a time base counter, and 4 general-purpose timers,
• Host interface for setting up the DS1104, downloading programs and transferring runtime data from/ to the host PC.
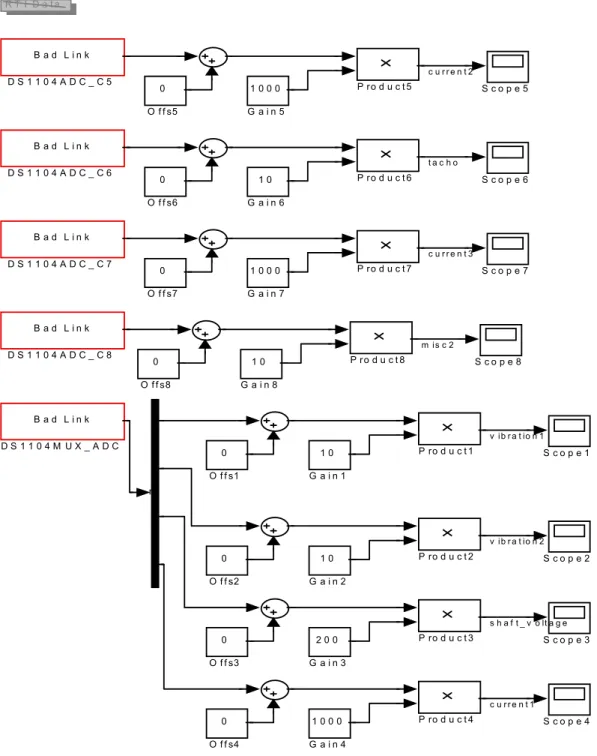
Further specifications of the DS1104 are included in Appendix B. The dSpace Control Desk for data acquisition was setup as seen below in Fig. 5.6.
S c o p e 8 S c o p e 7 S c o p e 6 S c o p e 5 S c o p e 4 S c o p e 3 S c o p e 2 S c o p e 1 R T I D a t a P ro d u c t 8 P ro d u c t 7 P ro d u c t 6 P ro d u c t 5 P ro d u c t 4 P ro d u c t 3 P ro d u c t 2 P ro d u c t 1 0 O f f s8 0 O f f s7 0 O f f s6 0 O f f s5 0 O f f s4 0 O f f s3 0 O f f s2 0 O f f s1 1 0 G a i n 8 1 0 0 0 G a i n 7 1 0 G a i n 6 1 0 0 0 G a i n 5 1 0 0 0 G a i n 4 2 0 0 G a i n 3 1 0 G a i n 2 1 0 G a i n 1 m B a d L i n k D S 1 1 0 4 M U X _ A D C B a d L i n k D S 1 1 0 4 A D C _ C 8 B a d L i n k D S 1 1 0 4 A D C _ C 7 B a d L i n k D S 1 1 0 4 A D C _ C 6 B a d L i n k D S 1 1 0 4 A D C _ C 5 c u r r e n t 2 t a c h o c u r r e n t 3 m is c 2 v ib r a t io n 1 v ib r a t io n 2 s h a f t _ v o lt a g e c u r r e n t 1
5.3.2 Signal Processing
The second most important aspect of signal analysis (and of this research) is the signal processing before fault diagnosis. Ayhan et. al. [43] mentioned that the Fast Fourier Transform (FFT) is the most widely used non-parametric spectrum analysis method, which yields efficient and reasonable results for MCSA technique. The FFT is an algorithm to compute the Discrete Fourier Transform (DFT) of a discrete time series function with minimum computational effort. FFT algorithms compute the DFT of the given time series by successively decomposing the N-point DFT computation into computations of smaller size. Ayhan [43] suggests that Welsch’s periodogram method is most efficient than FFT and periodogram methods in terms of fault detection performance. Although all the three methods are based on DFT technique, the use of a Hanning window and overlapping segments in Welch’s method contributed to the fault detection in a positive way. The use of Hanning window reduces the side effect of the sidelobes and results in a decrease in the PSD estimate bias. The side lobes of the signal spectrum cause the signal power leak into other frequencies. The bias of the PSD estimate is due to this spectral leakage. Applying a tapered window to the signal in the spectral estimation, such a Hanning window reduces the effect considerably. This results in a decreased estimation bias, which shows that the PSD estimate is closer to the real value. On the other hand, overlapping segments case the data treatment and smoothing of the PSD estimate. As the number of data segments increase, the PSD estimate variance decreases. Both these positive effects suggest that Welch’s periodgram method is a preferred approach when compared to the other two inspected methods in the broken rotor bar fault detection of induction motors.
However, Dhuness [47] suggested that the Welsh’s method is not adequate for large machines as the magnitude of interbar currents may become larger than fault frequency components as stipulated by Landy. Landy et.al. [20] outlined the
![Figure 3.1: Kerszenbaum and Landy’s model of the broken bar region [14]](https://thumb-us.123doks.com/thumbv2/123dok_us/10189016.2921578/29.918.232.607.133.564/figure-kerszenbaum-landy-s-model-broken-bar-region.webp)
![Figure 3.2: Production of axial force model by Muller [30]](https://thumb-us.123doks.com/thumbv2/123dok_us/10189016.2921578/31.918.185.697.231.554/figure-production-axial-force-model-muller.webp)