1111111111111111111inumuu~
(12) United States Patent
Djorgovski et al.
(54) SYSTEMS AND METHODS FOR DATA VISUALIZATION USING
THREE-DIMENSIONAL DISPLAYS (71) Applicant: California Institute of Technology,
Pasadena, CA (US)
(72) Inventors: Stanislav G. Djorgovski, Altadena, CA (US); Ciro Donalek, Pasadena, CA (US); Scott Davidoff, Los Angeles, CA (US); Vicente Estrada, Rancho
Cucamonga, CA (US)
(73) Assignee: California Institute of Technology, Pasadena, CA (US)
(*) Notice: Subject to any disclaimer, the term of this patent is extended or adjusted under 35 U.S.C. 154(b) by 0 days.
(21) Appl. No.: 15/276,742 (22) Filed: Sep. 26, 2016
(65) Prior Publication Data US 2017/0092008 Al Mar. 30, 2017
Related U.S. Application Data
(60) Provisional application No. 62/232,119, filed on Sep. 24, 2015, provisional application No. 62/365,837, filed on Jul. 22, 2016. (51) Int. Cl. G09G 5/00 (2006.01) G06F 3/00 (2006.01) (Continued) (52) U.S. Cl. CPC ... G06T 19/006 (2013.01); G06K 9/4671 (2013.01); G06K 9/6267 (2013.01); (Continued) (58) Field of Classification Search
CPC . G06F 3/04845; G06T 19/00; G06T 2200/16; G06T 2219/028; G06T 11/206; G06Q 40/04; G06Q 40/06 See application file for complete search history.
30 D2te `ilcualrzalan Cornpuiin9 SycG;m
72 ___________________
t;etwc k InNr~aoe
...
I/O Interface
(io)
Patent No.:
US
9,665,988 B2
(45) Date of Patent:
May
30,
2017
(56) References Cited
U.S. PATENT DOCUMENTS 6,057,856 A 5/2000 Miyashita et al. 6,154,723 A 11/2000 Cox eta].
(Continued)
FOREIGN PATENT DOCUMENTS Wo 2014130044 Al 8/2014
Wo 2014193418 Al 12/2014 OTHER PUBLICATIONS
Khairi Reda, Alessandro Febretti, Aaron Knoll, Jillian Aurisano, Jason Leigh, Andrew Johnson, Michael E. Papka and Mark Hereld, "Visualizing Large, Heterogeneous Data in Hybrid-Reality Envi-ronments", IEEE Computer Graphics and Applications, Jul./Aug. 2013, p. 38-48.*
(Continued) Primary Examiner Sing-Wai Wu
(74) Attorney, Agent, or Firm KPPB LLP
(57) ABSTRACT
Data visualization systems and methods for generating 3D visualizations of a multidimensional data space are described. In one embodiment a 3D data visualization appli-cation directs a processing system to: load a set of multidi-mensional data points into a visualization table; create representations of a set of 3D objects corresponding to the set of data points; receive mappings of data dimensions to visualization attributes; determine the visualization attri-butes of the set of 3D objects based upon the selected mappings of data dimensions to 3D object attributes; update a visibility dimension in the visualization table for each of the plurality of 3D object to reflect the visibility of each 3D object based upon the selected mappings of data dimensions to visualization attributes; and interactively render 3D data visualizations of the 3D objects within the virtual space from viewpoints determined based upon received user input.
30 Claims, 34 Drawing Sheets (30 of 34 Drawing Sheet(s) Filed in Color)
an,ory
li 30 hAo3e~ 4v e`ar McLaeata Re ored li (Optional) Viewpoin
-7?2, L14
.
-Data i~~n,e_n..i ns W-Merne Y Date
li TA Ppi"g 7 I Strurhrres Po., Data I = --- 7 6 T-8 JU M hi- V. . .n H P _ 710 _---__~__r_____ .---3D Ren zrinh__ ~. Disolzy Dri~ren Ce:nara Driver. Engina 714 j 724 732 ___ ---704 https://ntrs.nasa.gov/search.jsp?R=20170004951 2019-08-29T22:27:32+00:00Z
US
9,665,988 B2
Page 2 (51) Int. Cl. G06Q 40/00 (2012.01) G06T 19/00 (2011.01) G06T 17/00 (2006.01) G06T 15/00 (2011.01) G06T 19/20 (2011.01) G06T 7/00 (2017.01) H04N 5/225 (2006.01) G06K 9/62 (2006.01) G06K 9/46 (2006.01) G06T 13/20 (2011.01) G06T 7/20 (2017.01) (52) U.S. Cl. CPC ... G06T 7/004 (2013.01); G06T 7/20 (2013.01); G06T 13/20 (2013.01); G06T 15/005 (2013.01); G06T 17/00 (2013.01); G06T 19/20 (2013.01); H04N 5/2256 (2013.01); G06T 2200/04 (2013.01) (56) References Cited U.S. PATENT DOCUMENTS8,773,508 B2 * 7/2014 Daniel ... G06T 7/0065 348/42 2004/0041846 Al* 3/2004 Hurley ... G06Q 40/04 715/848 2005/0223337 Al* 10/2005 Wheeler ... G06F 3/04845 715/806 2006/0069635 Al* 3/2006 Ram ... G06Q 30/08 705/37 20 10/03 162 84 Al* 12/2010 Jeong ... G06T 5/002 382/162 2013/0097563 Al 4/2013 Pacheco Rodrigues Velho et al. 2015/0205840 Al 7/2015 Yerli
OTHER PUBLICATIONS
"31) Visualization Perspective for PDI 4 Pentaho Data Mining Pentaho Wiki", printed from http://wilci.pentaho.com/display/ DATAMINING/3D+Visualization+Perspective+for+PDI+4 on May 25, 2016, 5 pgs.
"Amra46p", printed from http://i.imgur.com/aMRA46p.png on May 19, 2016, 1 pg.
"castAR Wand", printed from https:Hs3.amazonaws.com/ksr/assets/ 001/081A88/765f86d82ae5f37a5 d4d0a27dad4534b large. jpg?1381537591 on May 19, 2016, 1 pg.
"InterSense, Precision Motion Tracking Solutions, IS-900 System", printed from http://www.intersense.com/pages/20/14 on May 19, 2016, 2 pgs.
"Magic Wand Programmable TV Remote", printed from http:// www.thinkgeek.com/product/cf9b/ on May 19, 2016, 4 pgs. "PPT Wand EST, Engineering Systems Technologies GmbH &
Co. KG", printed from http://www.est-kl.com/es/products/motion-tracking/worldviz/ppt-wand.html on May 19, 2016, 4 pgs. "Steal this idea: VR Wand", printed from https:Hforums.oculus. com/community/discussion/1620/steal-this-idea-vr-wand on May 19, 2016, 21 pgs.
"Virtual Reality: Input devices. Technologies for the direct interac-tion", Curs 2012/2013, 86 pgs.
"Virtual Reality: Interface Devices", printed from http://archive. ncsa.illinois.edu/Cyberia/VETopLevels/VRInterface.html on May 19, 2016, 3 pgs.
"VR Wand/Stylus Concept", printed from https://www.reddit.com/ r/oculus/comments/22mzis/vrwandstylus concept/ on May 19, 2016, 4 pgs.
Alger, Mike, "Visual Design Methods for Virtual Reality", Sep. 2015, 98 pgs.
Brath, Richard, "31) InfoVis is Here to Stay: Deal with It", IEEE VIS International Workshop on 3DVis, 2014, 7 pgs.
Cabral, Marcio C. et al., "On the usability of gesture interfaces in virtual reality environments", CLIHC '05 Proceedings of the 2005 Latin American conference on Human-computer interaction, Oct. 2005, 10 pgs.
Chandler, Tom et al., "Immersive Analytics", IEEE, 2015, 8 pgs. Chen, Jim X., "Data Visualization and Virtual Reality", Handbook of Statistics, vol. 24, 2005, 25 pgs.
Cioc, Alex, "Immersing Yourself in Your Data: Using Virtual World Engines to Solve "Big" Data", printed from http://www.astrobetter. com/blog/2013/03/25/immersing-yourself-in-your-data/ on Jun. 25, 2016, Mar. 25, 2013, 6 pgs.
Cruz-Neira, Carolina et al., "Scientists in Wonderland: A Report on Visualization Applications in the CAVE Virtual Reality Environ-ment", IEEE, 1993, pp. 59-66.
De Haan, Gerwin et al., "Towards Intuitive Exploration Tools for Data Visualization in VR", VRST '02, Nov. 11-13, 2002, 8 pgs. Djorgovski, S. G. et al., "Immersive Data Visualization", Astrolnformatics 2012, Redmond, WA, Sep. 2011, 8 pgs. Djorgovski, S. G. et al., "The MICA Experiment: Astrophysics in Virtual Worlds", SLACTIONS 2012 International Research Con-ference on Virtual Worlds, eds. L. Morgado, Y. Sivan, A.M. Maia, et al., 2012, pp. 49-57.
Donalek, Ciro et al., "Immersive and Collaborative Data Visualiza-tion Using Virtual Reality Platforms", IEEE, 2014, 6 pgs. Etemadpour, Ronak et al., "Choosing Visualization Techniques for Multidimensional Data Projection Tasks: A Guideline with Examples", Computer Vision, Imaging and Computer Graphics Theory and Applications, vol. 598, Mar. 2015, 21 pgs.
Gardner, M. R. et al., "The Immersive Education Laboratory: understanding affordances, structuring experiences, and creating constructivist, collaborative processes, in mixed-reality smart envi-ronments", EAI Endorsed Transactions on Future Intelligent Edu-cational Environments, Sep. 9, 2014, 13 pgs.
Heer, Jeffrey et al., "A Tour Through the Visualization Zoo", Communications of the ACM, vol. 53, No. 6, 2010, 9 pgs. Heer, Jeffrey et al., "Animated Transitions in Statistical Data Graphics", IEEE Transactions on Visualization and Computer Graphics, vol. 13, No. 3, Nov./Dec. 2007, pp. 1240-1247. Hollerer, Tobias et al., "Exploring MARS: Developing Indoor and Outdoor User Interfaces to a Mobile Augmented Reality System", Computers & Graphics, vol. 3, 1999, pp. 779-785.
Jarocsh, Rafael et al., "Interactive exploration of immersive illu-minated 3D scatterplots ProjINF", retrieved from https://www. informatik.uni-stuttgart.
de/studium/interessierte/bsc-studiengaenge/informatik/proj ekt-inf/2015-06-26/Gruppe6.pdf, Jun. 26, 2015, 6 pgs.
Luo, Xun, "PACE: A Framework for Personalized Visualization and Scalable Human Computer Interaction", Thesis of Xun Luo, 2008, 187 pgs.
Maddix, Karl, "Big Data VR Challenge Winners!", printed from http://www.mastersofpie.com/big-data-vr-challenge-winners/ on Jun. 21, 2016, 17 pgs.
Maddix, Karl, "Big Data VR Challenge Phase 1", printed from http://www.mastersofpie.com/big-data-vr-challenge/ on Jun. 21, 2016, Jun. 1, 2015, 10 pgs.
Maddix, Karl, "Big Data VR Challenge Phase 2 Update", printed from http://www.mastersofpie.com/big-data-vr-challenge-phase-2-update/ on Jun. 21, 2016, Jun. 26, 2015, 14 pgs.
Mart, Bernard, "How VR Will Revolutionize Big Data Visualiza-tions", retrieved from: http://www.forbes.com/sites/bemafdmarr/ 2016/05/04/how-vr-will-revolutionize-big-data-visualizations/ print/, May 4, 2016, 4 pgs.
Milgram, Paul et al., "A Taxonomy of Mixed Reality Visual Displays", retrieved from http://vered.rose.utoronto.ca/people/ pauldir/IEICE94/ieice.html; IEICE Trans, on Info. Syst., vol. E77-D, No. 12, Dec. 12, 1994, on Oct. 16, 2003 15 pgs. Moran, Andrew et al., "Improving Big Data Visual Analytics with Interactive Virtual Reality", arXiv:1506.08754v2 [cs.HC], Oct. 6, 2015, 6 pgs.
Nagel, Henrik R. et al., "Methods for Visual Mining of Data in Virtual Reality", In Proceedings of the International Workshop on Visual Data Mining, in conjunction with ECML/PKDD2001, 2nd
US
9,665,988 B2
Page 3 (56) References Cited
OTHER PUBLICATIONS
European Conference on Machine Learning and 5th European Conference on Principles and Practice of Knowledge Discovery in Databases, 2001, 15 pgs.
Raja, Dheva et al., "Exploring the Benefits of Immersion in Abstract Information Visualization", Virginia Tech, Department of Computer Science, 2004, 7 pgs.
St. John, Mark et al., "The Use of 2D and 3D Displays for Shape-Understanding versus Relative-Position Tasks", Human Fac-tors: The Journal of the Human Factors and Ergonomics Society, 2001, pp. 79-98.
Takahashi, Dean, "astAR will return $1Min Kickstarter money and postpone augmented reality glass shipments", printed from http:// venturebeat.com/2015/12/16/castar-will-return-Im-in-Icickstarter-money-and-postpone-augmented-reality-glasses-shipments/ on May 19, 2016, 7 pgs.
Takahasi, Dean, "CastAR shows how it will turn your tabletop into an animated gaming world", printed from http://venturebeat.com/ 2016/04/11/castars-latest-demos-show-how-it-plans-to-enable-tabletop-mixed-reality-games/ on May 19, 2016, 8 pgs.
Tanriverdi, Vildan et al., "VRID: A Design Model and Methodology for Developing Virtual Reality Interfaces", VRST'01, Nov. 15-17, 2001, 8 pgs.
The Uber Maker, "How to: Connect your Wiimote to your computer via Bluetooth", retrieved from http://www.instructables.com/id/ How-To-Connect-your-Wiimote-to-your-PC-via-Blueto/ in 2016, 6 pgs.
Tollerud, Erik, "An Analysis of 3D Data Visualization in Numerical Models", 2006, 24 pgs.
White, Sean et al., "Visual Hints for Tangible Gestures in Aug-mented Reality", Proceedings of the Sixth IEEE and ACM Inter-national Symposium on Mixed and Augmented Reality, Nov. 13-16, 2007, pp. 47-50.
White Paper Intel Labs, "ScienceSim: A virtual environment for collaborative visualization and experimentation", Intel Labs, 2009, 5 pgs.
Wilhelm, Parker, "Microsoft HoloLens Bluetooth Clicker is our first glimpse at a possible controller", printed from http://www. techradar.com/us/news/wearables/microsoft-s-hololens-bluetooth-clicker-is-our-first-glimpse-at-any-controller-1315623 on Jun. 25, 2016, Feb. 23, 2016, 10 pgs.
International Search Report and Written Opinion for International Application No. PCT/US2 0 1 6/0 53 84 2, Search completed Jan. 11, 2017, Mailed Jan. 11, 2017, 12 Pgs.
U.S. Patent
May
30,
2017
FIG. 1A
FIG. 1B
FIG.
lc
U.S. Patent
May
30,
2017
Sheet 4
of 34
US
9,665,988 B2
U.S. Patent
May
30,
2017
Sheet 6
of 34
US
9,665,988 B2
CD
U.S. Patent
May
30,
2017
Sheet 7
of 34
US
9,665,988
B2
.: ~
.
t~
.
~
17L
LL
_ ....::. LLU.S. Patent
May
30,
2017
Sheet 8
of 34
US
9,665,988
B2
>. w
v :;;ti<iv..:En. .
riff •}:
... EEE....E....E....EEEEE EEEEEE EEEEEE EEEEE EEE E E EEEEEErEE EE E
:.\v E:E:E:E:E:E:E::E:E:iE:E:iE::: :^Erg •.:T::> :::::r'~ co- Y:;:::~~:~r:•`'::::: X4}•.:.4{.. ''vii•}:}j: rii:4Y'ri . ^•ii4M1i•. ;. p 44 • v~•t{~'{M1h '8:
E
F .. E cr
2 K' FoamU.S. Patent
May
30,
2017
Sheet 13 of 34
US
9,665,988 B2
U.S. Patent
I
ID
U.S. Patent
May
30,
2017
Sheet 16 of 34
US
9,665,988 B2
co LO
8D
Data
Visualization
Computing
System
Processor
702
Network
Interface
706
I/O
Interface
708
Memory
l
l
3D
Model
l
l
722
Avatar
Metadata
(Optional)
734
---1 -
___________~
Rendered
Viewpoints
726
1---
---
---
---
---
---
---
---
---
---
---
---
--1 1 ? l lData
Dimensions
;
In
-Memory
Data
rE
Mappings3
Structures
i
Pose
Data
E
7201;
718;
1
7281
L _---______ _._.__________ ____________3D
Data
Multi
-dimensional
IMachine
Vision
Visualization
data
set
Application
Applicatlorl0
716
730
---,
---3D
Rendering
Display
Drivers
I
Camera
Drivers
Engine
714
724
1
782
0S712
704
700
U.S. Patent
May
30,
2017
Sheet 18 of 34
US
9,665,988
B2
802
804
806
808
---Start
800
---t
---
Load data points into
in-memory
data
structures
Instantiate 3D
objects
Determine attributes o
3D
objects using data
dimension mappings
Determine user pose
890
"~
Illuminate 3D objects
based upon user pose
(optional)
812
Determine visibility of
interaction
primitives
based upon user pose
(optional)
814
816
Render 3D display
complete?
FIG.
Yes
---
---Complete
No
818
I
1
_f
=" Modify data
-mappings?
Yes
U.S. Patent
May
30,
2017
Sheet 19 of 34
US
9,665,988 B2
852
854
856
858
860
862
864
866
Start
Instantiate 3D
objects
Determine attributes o
3D
objects using data
dimension mappings
T
... ...
create at least one
group 3D
object using
groups of visible 3D
Determine
user
pose
Illuminate group 3D
objects based upon
user pose
Collision
processing
Render 3D
display
complete?
lies
g
-Complete
860
No
Yes
U.S. Patent
May
30,
2017
Sheet 21 of 34
US
9,665,988 B2
U.S. Patent
May
30,
2017
co 0 CD cD 0 x --It r N C) CDm
Sheet 23 of 34
US
9,665,988 B2
aLL
U.S. Patent
May
30,
2017
Sheet 27 of 34
US
9,665,988 B2
~s
4. kV k { : •Y hrY C6A vtir. o;, a • r pp ..,.. ~ ~;:" <: {~•' `.air p as a xe ii4U.S. Patent
1302
1304
1300
May
30,
2017
Start
Sheet 28 of 34
Obtain pose
information
Select 3D object or
vertex within FOV
Determine direction of
illumination
1303
Illuminate 3D object
or
vertex
using
directional illumination
1310
tional 3D
obje-within FOV?
No
Complete
US
9,665,988 B2
1300
Yes
U.S. Patent
May
30,
2017
Sheet 30 of 34
US
9,665,988 B2
CD
CDU.S. Patent
May
30,
2017
Sheet 31 of 34
US
9,665,988 B2
U.S. Patent
May
30,
2017
A a• R xW ti Aa & O P • 4 y t AT A R s £Sheet 32 of 34
US
9,665,988
B2
R ~ ~ x R ~ R G ;: xa i\ A c ~Obul
x a ~A'A R a LL1706 9 8®.$e 8 6/ --I 1710 1708 1'710 1708
FIG.
17
Flu'.
17E
b 1710 M 702 °C w 0 t.~ 0 J 1712 w w 1702 0 wUS
9,665,988 B2
SYSTEMS AND METHODS FOR DATA VISUALIZATION USING THREE-DIMENSIONAL DISPLAYS
CROSS-REFERENCE TO RELATED 5 APPLICATIONS
The current application claims priority under 35 U.S.C. §119(e) to U.S. Provisional Patent Application Ser. No. 62/232,119 entitled "Novel Method for a Visual Exploration 10 of High-Dimensionally Data Sets Using Virtual Reality" to Djorgovski et al., filed Sep. 24, 2015 and U.S. Provisional Patent Application Ser. No. 62/365,837 entitled "Systems and Methods for Data Visualization Using Three-Dimen-sional Displays" to Djorgovski et al., filed Jul. 22, 2016. The 15 disclosures of U.S. Provisional Patent Application Ser. Nos. 62/232,119 and 62/365,837 are hereby incorporated by reference in their entirety.
STATEMENT OF FEDERAL SUPPORT 20 This invention was made with government support under Grant No. HCC0917814 awarded by the National Science Foundation. The government has certain rights in the inven-tion. The invention described herein was made in the per- 25 formance of work under a NASA contract NNNI2AAOIC, and is subject to the provisions of Public Law 96-517 (35 USC 202) in which the Contractor has elected to retain title.
III IIIIDZ6]=IIlI11►Wa011I to] 0
The present invention relates generally to data visualiza-tion and more specifically to the visualizavisualiza-tion of complex, multidimensional data using three-dimensional display tech-nologies including (but not limited to) virtual reality (VR), 35 mixed reality (MR), and augmented reality (AR) displays.
II?ITO1601.E618101K
Data visualization commonly refers to techniques utilized 40 to communicate data or information by encoding it as visual objects that can be displayed via a computer. Visualization is an essential component of any data analysis and/or data mining process. In many instances, a graphical representa-tion of the geometry and topology of a data distribution can 45 enable selection of appropriate analysis tools revealing further insights, and the interpretation of the results. In the era of "big data", the key bottleneck in the extraction of actionable knowledge from high dimensionality data sets is often a user's (in)ability to visualize patterns in more than 3 50 dimensions.
Computer displays typically display information in two dimensions (21)). However, a variety of three-dimensional (3D) display technologies are emerging that simulate depth
through a number of different visual effects including Ste- 55 reoscopy in which images rendered from different view-points are displayed separately to the left and right eye. The two images are then combined in the brain to give the perception of 3D depth. A number of head mounted 3D display technologies are currently available. Paul Milgram 60 and Fumio Kishino, in a paper entitled "A Taxonomy of Mixed Reality Visual Displays" published in IEICE Trans-actions on Information Systems, Vol. E77-D, No. 12 in December 1994 (the disclosure of which is incorporated by reference herein in its entirety) proposed the concept of a 65 "virtuality continuum" that relates to the mixture of classes of objects presented in any particular display situation,
2
where real environments constitute one end of the con-tinuum, and virtual environments constitute the opposite end of the continuum. In their paper, Milgram and Kishino explain the difference between virtual reality and mixed reality as follows:
The conventionally held view of a Virtual Reality (VR) environment is one in which the participant-observer is totally immersed in, and able to interact with, a completely synthetic world. Such a world may mimic the properties of some real-world environments, either existing or fictional; however, it can also exceed the bounds of physical reality by creating a world in which the physical laws ordinarily governing space, time, mechanics, material properties, etc. no longer hold. What may be overlooked in this view, however, is that the VR label is also frequently used in association with a variety of other environments, to which total immersion and complete synthesis do not necessarily pertain, but which fall somewhere along a virtuality con-tinuum. In this paper we focus on a particular subclass of VR related technologies that involve the merging of real and virtual worlds, which we refer to generically as Mixed Reality (MR)."
(Milgram, Paul, and Fumio Kishino. "A taxonomy of mixed reality visual displays." MICE TRANSACTIONS on Infor-mation and Systems 77.12 (1994), p. 1321).
Within the realm of mixed reality, a further distinction can be drawn between Augmented Reality (AR), and Mixed Reality (MR). Both AR and MR displays can be imple-mented using transparent display technology and/or by capturing images of a scene and using the captured images to render displays combining the real world scene and the virtual objects. The term AR is typically used to describe 3D display technologies that display virtual objects that provide contextually relevant information to a real world scene. AR is often used to refer to an experience in which real world objects are augmented or supplemented by computer-gen-erated sensory input. MR, sometimes referred to as hybrid reality, typically involves the merging of real and virtual worlds to produce new environments and visualizations where real and virtual objects co-exist and interact in real time.
AR, MR, and VR displays can all have a similar goal of immersing a user in an environment that is either partially or entirely virtual. With AR and MR, users continue to be in touch with the real world while interacting with virtual objects around them. With VR, the user is isolated from the real world while immersed in a world that is completely synthesized (although may include virtual analogues to real world objects).
SUMMARY OF THE INVENTION
Humans have a remarkable pattern recognition system and can acquire more information through vision than all the other senses combined. Visualization provides an ability to understand large amounts of data by mapping abstract information to more easily understandable visual elements. Systems and methods in accordance with various embodi-ments of the invention create 3D data visualizations that increase a viewer's ability to explore an even higher dimen-sionality in data and observe complex patterns within the data. Humans are biologically optimized to see the world and the patterns in it in three dimensions. Therefore, pre-sentation of data via a 3D display as a multidimensional (i.e., with the number of displayed data dimensions of 3 or greater) data visualization enables identification of mean-ingful structures in data (e.g., clusters, correlations, outliers)
US
9,665,988 B2
3
that may contain an actionable knowledge and that often reside in higher dimensional spaces and which are not readily observable through visualization of data via conven-tional 2D display technologies. Furthermore, immersiveAR, MR, and VR environments naturally support collaborative 5 data visualization and exploration, and are conducive to scientists interacting with their data along side of their colleagues in shared virtual spaces.
In discussing data visualization, a distinction must be made between the dimensionality of the graphical display io device, (e.g., a printed paper or a flat screen being typical 2D devices, while VR/AR headsets represent typical 3D display devices) and the dimensionality of the data, which can be though of as the number of features/quantities/parameters associated with each data item (e.g. a row in a spreadsheet 15 could be a single data item, and the number of columns would be its dimensionality). By way of further illustration, a data set with 3 column entries would be 3-dimensional, a data set with 20 columns would be 20-dimensional. Either dataset can be represented on a 3D display device. An 20 additional distinction is the dimensionality of the data space within which the data are being rendered or visualized. Up to 3 dimensions (axes) of such a data visualization space can be spatial; additional dimensions may be encoded through the colors, transparencies, shapes and sizes of the data 25 points. In this way, more than three data dimensions can be visualized in a multidimensional data space via a 3D display device. If a data set has N dimensions, a subset of k of them may be visualized at any given time, with k_N. If k>3, up to 3 dimensions can be encoded as spatial positions (XYZ) 30 in a data visualization space, with the remainder being represented through characteristics of the data points such as colors, sizes, and shapes. In a scatter plot each data item (data point) is represented as an individual geometrical
object, e.g., a dot, a square, a sphere, etc., with some spatial 35 coordinates (XYZ), and other visible properties (e.g., colors, sizes, etc.) encoding the additional data dimensions. The challenge is in maximizing the number of simultaneously visualized data dimensions k that can be readily understood
by a human. 40
In a number of embodiments, three-dimensional data visualization systems provide can provide data visualiza-tions in a variety of display contexts. In certain embodi-ments, multidimensional data is rendered for in a 3D data visualization space that can be viewed, navigated, and 45 manipulated using a traditional 2D display device (e.g., a flat screen). In many embodiments, an optimized rendering of up to 10 or more data dimensions is used to generate a 3D data visualization of the multidimensional data space. In several embodiments, the three-dimensional data visualiza- 50 tion systems can provide an enhanced intuitive comprehen-sion of the multidimencomprehen-sional data space, when displayed using a 3D display device (e.g., a VR/AR headset). Immer-sion in the multidimenImmer-sional data space using an immersive 3D display can enhance the human ability to understand the 55 geometry and the relationships (clusters, correlations, out-liers, anomalies, gaps, etc.) that may be present in the data as compared to a traditional data visualization methodology involving the use of a 2D display.
One embodiment of the invention includes: a display 60 device; and a computing system, including memory con-taining a 3D data visualization application and a processing system. In addition, the 3D data visualization application directs the processing system to: load a set of data points into a visualization table in the memory, where each data point 65 includes values in multiple data dimensions and an addi-tional visibility value is assigned to each data point in a
_►,
visibility dimension within the visualization table; create representations of a set of 3D objects corresponding to the set of data points, where each 3D object has a set of visualization attributes that determine the manner in which the 3D object is rendered and the visualization attributes include a location of the 3D object within a virtual space having three spatial dimensions; receive mappings of data dimensions to visualization attributes; determine the visu-alization attributes of the set of 3D objects based upon the selected mappings of data dimensions to 3D object attri-butes, where the selected mappings of data dimensions to visualization attributes determine a location for each visible 3D object within the virtual space; update the visibility dimension in the visualization table for each of the plurality of 3D object to reflect the visibility of each 3D object based upon the selected mappings of data dimensions to ization attributes; and interactively render 3D data visual-izations of the 3D objects within the virtual space from viewpoints determined based upon received user input.
In a further embodiment, the display device is a 3D display device, and interactively rendering 3D data visual-izations of the 3D objects within the virtual space from viewpoints determined based upon received user input com-prises rendering stereo images displayed via the 3D display device.
In another embodiment, the 3D data visualization appli-cation is implemented using a 3D rendering engine.
In a still further embodiment, the implementation of the 3D data visualization application further relies upon scripts that execute via the 3D rendering engine.
In still another embodiment, the visualization attributes include at least one attribute selected from the group of: X Coordinate, Y Coordinate, Z Coordinate, Shape, Size, Color Palette, Color Map, Color Scale, Transparency. ID, URL, Mask, Show By, Motion of the 3D Object, Sonification, Haptic Feedback, and Vibrotactile Feedback.
In a yet further embodiment receiving mappings of data dimensions to visualization attributes further includes receiving user selections of mappings of data dimensions to visualization attributes.
In yet another embodiment, receiving mappings of data dimensions to visualization attributes further includes retrieving a stored set of mappings of data dimensions to visualization attributes.
In a further embodiment again, interactively rendering 3D data visualizations of the 3D objects within the virtual space from viewpoints determined based upon received user input further includes: generating at least one 3D object based upon the visualization attributes of a plurality of visible 3D objects; and interactively rendering 3D data visualizations of the at least one group 3D object within the virtual space from viewpoints determined based upon received user input.
In another embodiment again, interactively rendering 3D data visualizations of the 3D objects within the virtual space from viewpoints determined based upon received user input further includes: modifying 3D objects forming part of a virtual environment within the virtual space in response to the user input so that the 3D objects corresponding to the set of data points remain stationary within the virtual space and appear to change relative to the virtual environment in the 3D data visualization due to the modification to the 3D objects forming part of the virtual environment; and render-ing the visible 3D objects correspondrender-ing to the set of data points and the 3D objects forming part of the virtual envi-ronment.
In a further additional embodiment, modifying 3D objects forming part of a virtual environment within the virtual
US
9,665,988 B2
5
space in response to the user input comprises at least one modification selected from the group including: modifying the size of the 3D objects forming part of the virtual environment in response a user instruction to resize the 3D objects corresponding to the set of data points to create the impression that the 3D objects corresponding to the set of data points are changing in size relative to the virtual environment; moving the positions of the 3D objects form-ing part of the virtual environment in response a user instruction to move the 3D objects corresponding to the set of data points to create the impression that the 3D objects corresponding to the set of data points are moving relative to the virtual environment; and moving the positions of the 3D objects forming part of the virtual environment in response a user instruction to rotate the 3D objects corre-sponding to the set of data points to create the impression that the 3D objects corresponding to the set of data points are rotating relative to the virtual environment.
In a still yet further embodiment, interactively rendering 3D data visualizations of the 3D objects within the virtual space from viewpoints determined based upon received user input includes: illuminating at least some of the 3D objects, where each illuminated 3D object is illuminated using a directional illumination source originating at a user view-point; and rendering at least the illuminated 3D objects based upon the user viewpoint.
In still yet another embodiment, illuminating at least some of the 3D objects further includes: determining a field of view; illuminating 3D objects within the field of view of the user using a directional illumination source originating at the user viewpoint; and rendering the illuminated 3D objects within the field of view of the user.
In a still further embodiment again, interactively render-ing 3D data visualizations of the 3D objects within the virtual space from viewpoints determined based upon received user input includes: rotating at least some of the 3D objects based upon a user viewpoint, so that the appearance of the rotated 3D objects is invariant with user viewpoint; and rendering the rotated 3D objects based upon the user viewpoint.
In still another embodiment again, interactively rendering 3D data visualizations of the 3D objects within the virtual space from viewpoints determined based upon received user input includes: determining a location within the virtual space of at least one interaction primitive based upon a user viewpoint; and rendering the at least one interaction primi-tive based upon the user viewpoint.
A still further additional embodiment also includes deter-mining a transparency of at least one interaction primitive based upon the user viewpoint.
In still another additional embodiment, the 3D objects include 3D objects having depth perception preserving shapes.
In a yet further embodiment again, the depth perception preserving shapes are characterized by a first dimension that is invariant and second dimension that is a visualization attribute that varies based upon a mapped data dimension. In yet another embodiment again, at least one of the depth perception preserving shapes is pill shaped.
In a further additional embodiment again, receiving map-pings of data dimensions to visualization attributes includes: receiving a selection of a target feature; determining the importance of at least a subset of multiple data dimensions to the target feature; and generating mappings of data dimensions having high importance to specific visualization attributes.
6
In another additional embodiment again, determining the importance of at least a subset of multiple data dimensions to the target feature further includes: identifying data dimen-sions that are numerical and data dimendimen-sions that are cat-5 egorical; generating mappings of numerical data dimensions having high importance to a first set of visualization attri-butes; generating mappings of categorical data dimensions having high importance to a second set of visualization attributes.
10 In another further embodiment, the first set of visualiza-tion attributes comprises X, Y, Z position, and size.
In still another further embodiment, the second set of visualization attributes comprises shape.
In yet another further embodiment, the 3D data visual-15 ization application further directs the processing system to: receive at least one updated mapping of a data dimension to a visualization attribute; determine updated visualization attributes for the set of 3D objects based upon the selected mappings of data dimensions to 3D object attributes, where 20 the updated mappings of data dimensions to visualization attributes determine a location for each visible 3D object within an updated virtual space; generate trajectories for the set of visible 3D objects from their locations in the virtual space to their updated locations in the virtual space; and 25 interactively render animations of the movements of 3D objects along their generated trajectories from their locations in the virtual space to their locations in the updated virtual space from viewpoints determined based upon received user input.
30 In another further embodiment again, the 3D data visu-alization application further directs the processing system to determine updated visibility values for each of the plurality of 3D object to reflect the visibility of each 3D object based upon the updated mapping.
35 In another further additional embodiment, interactively rendering animations of the movements of 3D objects along their generated trajectories further comprises varying the time at which different sets of 3D objects commence moving along their trajectories during a rendered animation. 40 In still yet another further embodiment, the time at which
different sets of 3D objects commence moving along their trajectories during a rendered animation is determined based upon user input.
In still another further embodiment again, interactively 45 rendering animations of the movements of 3D objects along their generated trajectories further includes varying the speed with which different sets of 3D objects move along their trajectories during a rendered animation.
In still another further additional embodiment, interac-50 tively rendering 3D data visualizations of the 3D objects within the virtual space from viewpoints determined based upon received user input includes: determining a location within the virtual space of at least one affordance, where user input directing movement of a 3D data visualization onto 55 one of the at least one affordances initiates modification of
the 3D data visualization; detecting movement of a 3D data visualization onto one of the at least one affordances; modifying the 3D data visualization based upon the one of the at least one affordances; and rendering the modified 3D 6o data visualization based upon the user viewpoint.
In yet another further embodiment again, modifying the 3D data visualization based upon the one of the at least one affordances comprises resizing the 3D data visualization.
In yet another further additional embodiment, modifying 65 the 3D data visualization based upon the one of the at least one affordances includes: applying a data analysis process to the set of data points in the visualization table corresponding
US
9,665,988 B2
7
to the 3D objects visualized within the 3D visualization; and modifying visualization attributes of the 3D objects visual-ized within the 3D visualization based upon at least one result of the data analysis process; and rendering a modified 3D data visualization including the modified visual attri-butes of the 3D objects based upon the user viewpoint.
In another further additional embodiment again, the data analysis process is a clustering process.
In still yet another further embodiment again, modifying the 3D data visualization based upon the one of the at least one affordances includes rendering a new 3D data visual-ization of a set of 3D objects represented by at least one selected 3D object in the 3D data visualization moved onto one of the at least one affordances.
Still yet another further additional embodiment, further includes: an input device having an elongated handle and an input button. In addition, the 3D data visualization applica-tion further directs the processing system to: obtain a pose input and a button state input from the wand; modify the 3D data visualization based upon the pose input and the button state input in a manner determined based upon a user interface context; and render the modified 3D data visual-ization based upon the user viewpoint.
In still another further additional embodiment again, modifying the 3D data visualization based upon the pose input and the button state input in a manner determined based upon a user interface context includes: determining a location for the 3D data visualization within the virtual world based upon the pose input and the button status input indicating that the button is not being pressed; and rotating the 3D data visualization within the virtual world based upon the pose input and the button status input indicating that the button is being pressed.
In a further embodiment, the memory further comprises avatar metadata including a set of visualization attributes that determine the manner in which an avatar is rendered and the visualization attributes include a location of the avatar within the virtual space, and interactively rendering 3D data visualizations of the 3D objects within the virtual space from viewpoints determined based upon received user input com-prises rendering avatars within the 3D data visualization based upon the viewpoints and the avatar metadata.
In another embodiment, the avatar metadata further com-prises pose information, and rendering avatars within the 3D data visualization based upon the viewpoints and the avatar metadata further comprises rendering the poses of avatars within the 3D data visualization based upon the pose infor-mation within the avatar metadata.
BRIEF DESCRIPTION OF THE DRAWINGS The patent or application file contains at least one drawing executed in color. Copies of this patent or patent application publication with color drawing(s) will be provided by the Oflice upon request and payment of the necessary fee.
FIGS. 1A-1E illustrate a set of eight clusters laid out with their data centers at the corners of a virtual cube.
FIGS. 2A-2D illustrate the different perspective a user can obtain by moving within a 3D visualizations of a multidi-mensional data space and the use of additional visualization attributes to visualize additional data dimensions in accor-dance with various embodiments of the invention.
FIGS. 3A-3E illustrate visualization of a 3D graph from multiple viewpoints in which data is visualized as 3D line plots in accordance with an embodiment of the invention.
8
FIGS. 4A-4E illustrate visualization of a 3D graph from multiple viewpoints in which data is visualized as a 3D surface in accordance with an embodiment of the invention. FIGS. 5A-5D conceptually illustrates rendering of a 3D 5 graph from different viewpoints of different users in
accor-dance with an embodiment of the invention.
FIG. 5E illustrates a 3D data visualization showing ava-tars of multiple users within a virtual space in accordance with an embodiment of the invention.
10
FIGS. 6A and 6B conceptually illustrate systems for generating 3D visualizations of a multidimensional data space in accordance with various embodiments of the inven-tion.
15 FIG. 7 conceptually illustrates a multidimensional data visualization computing system implemented on a single computing device in accordance with an embodiment of the invention.
FIG. 8A is a flow chart illustrating a process for gener-20 ating a multidimensional data visualization in accordance
with an embodiment of the invention.
FIG. 8B is a flow chart illustrating a process for rendering a 3D data visualization using group 3D objects in accor-dance with an embodiment of the invention.
25 FIGS. 9A-9C illustrates a 3D visualization of a multidi-mensional data space in which data dimensions are mapped to shape and size attributes of 3D objects in accordance with various embodiments of the invention.
FIG. 10 shows a small set of 3D object shapes that are 3o designed to be recognizable even in highly dense plots.
FIG. 11A shows the variation in appearance of a 3D object having a spherical shape under constant illumination by three static point sources when viewed from different direc-tions.
35 FIG. 11B shows the same 3D data object from the same viewpoints shown in FIG. 11A with the 3D object illumi-nated using a directional illumination source originating at (or near) the viewpoint of the user.
FIG. 12A-12C illustrate the similarity in appearance of 40 similar 3D objects as a user moves through a virtual space, because the illumination of the objects changes with the pose of the user, in accordance with various embodiments of the invention.
FIG. 13 is a flow chart showing a process for updating the 45 illumination of 3D objects (or individual vertices or surfaces of 3D objects) as the field of view of a user within a virtual space changes in accordance with an embodiment of the invention.
FIG. 14 conceptually illustrates Directional illumination 50 of multiple 3D objects and/or vertices or surfaces of group
3D objects within a virtual space.
FIG. 15A illustrates a 3D graph including interaction primitives in the form of grids, axes, and axis labels gener-ated by a 3D data visualization system in accordance with an 55 embodiment of the invention.
FIG. 15B illustrates a user interface showing recommen-dations concerning mappings of specific data dimensions to particular attributes of 3D objects visible in a 3D data visualization in accordance with an embodiment of the 60 invention.
FIGS. 16A-16D is a sequence of 3D data visualizations in which the X attribute of the 3D data objects is modified from a first data dimension (i.e. "Age") to a second data dimen-sion (i.e. "YearsOn7ob") in accordance with an embodiment 65 of the invention.
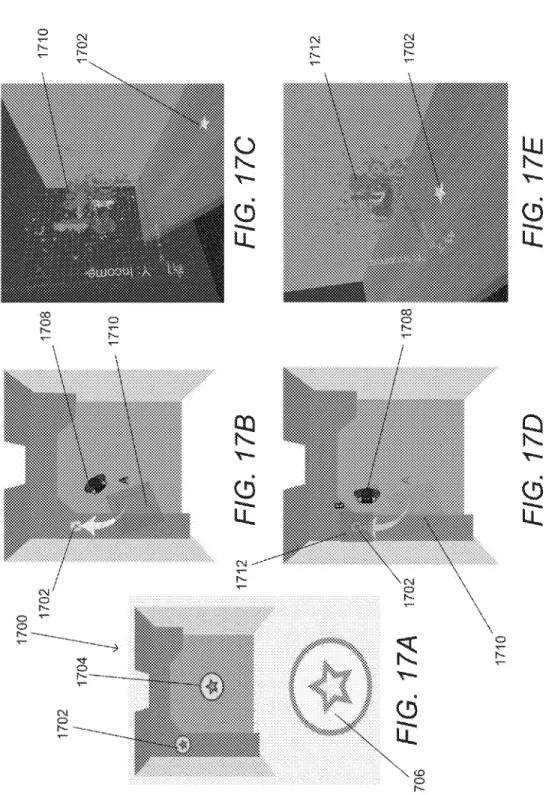
FIGS. 17A-17F illustrate affordances within a VR user interface that enable a user to control the size of a 3D data
US
9,665,988 B2
9
visualization within the virtual world generated by a 3D data visualization system in accordance with various embodi-ments of the invention.
DETAILED DESCRIPTION
Data visualization systems that can visualize multidimen-sional data as 3D graphs (i.e. 3D data visualization systems) and methods of generating visualizations of multidimen-sional data spaces in accordance with a number of embodi- io ments of the invention can utilize 3D display technologies to address many of the challenges of effective interactive visualization of high-dimensional data. The term here 3D graph is used in a general sense to reference any 3D object or group of 3D objects that collectively describe a set of 15 data. A distinction can be drawn between the 3D object or objects that make up a 3D graph and other 3D objects, which may be utilized within a 3D visualization of multidimen-sional data to represent a virtual environment in which the 3D graph is contained. Current data visualization tech- 20 niques, largely ask a user to perceive an environment that is displayed on a flat screen effectively by looking from the outside in. Systems and methods in accordance with several embodiments of the invention enable the visualization of more complex data spaces and can extend the human ability 25 to interpret additional dimensions by utilizing 3D display technologies to place a user inside the visualization, and making the act of data visualization a first person experi-ence. This approach can activate the human senses of proprioception (how people senses the relative position of 30 their body parts) and kinesthesia (how people sense the extent of their own body in motion), which describe and explain the human body's experience within an external environment.
Presentation of highly dimensional data in a three-dimen- 35 sional visualization is complex and can involve representa-tion of structure within data using subtle variarepresenta-tions in the characteristics of 3D objects such as size, shape, and/or texture. Movement and depth perception can confuse some of these visual cues and the confusion can be complicated in 40 circumstances where the manner in which the 3D objects are rendered for 3D display introduces variations that are unre-lated to the underlying data dimensions (e.g. shadows that may alter perceived color and/or size). 3D data visualization systems in accordance with many embodiments of the 45 invention utilize techniques including (but not limited to) shape selection and illumination models that preserve simi-larity between similar 3D objects within the field of view of the user and enhance a user's ability to differentiate between variations in size due to variations in the size attribute of a 50 3D object and variations in size due to differences in distances to 3D objects. In a number of embodiments, a user's ability to perceive structure within data is further enhanced by utilizing animation to enable a user to observe modifications to the attributes of 3D objects corresponding 55 to specific 3D data points as the 3D objects migrate from one 3D visualization of a multidimensional data space to a 3D visualization of a different multidimensional data space.
Usability of 3D data visualization systems in accordance with a number of embodiments of the invention is enhanced 60 by providing affordances within a 3D user interface that a user can use to automatically modify the rendering of high dimensionality data in a 3D data visualization. In several embodiments, the user can simply drag the 3D visualization of a multidimensional data space over the affordance and a 65 particular action is performed (e.g. resizing of the 3D data visualization, or k-means clustering of the data points). We
10
emphasize that whereas the data are visualized as distinct objects (data points) in a 3D data visualization, more than three data dimensions are being rendered through the prop-erties of the individual data points (e.g., colors, sizes, shapes, etc.).
As can readily be appreciated, the ability to visualize data within a multidimensional data space in 3D opens up a vast array of possibilities for the analysis of complex data, 3D data visualization systems in accordance with many embodi-ments of the invention enable data exploration to be per-formed in a collaborative manner. In several embodiments, multiple users who may or may not be in the same physical location can independently explore the same shared, virtual, multidimensional data space. In certain embodiments, a single user can lead a "broadcast" interactive session in which all users view the 3D data visualization space from the same viewpoint controlled by a lead user. Multidimen-sional data visualization systems and processes for exploring complex data using multidimensional data visualizations in accordance with various embodiments of the invention are discussed further below.
Three-Dimensional Data Visualizations
When dealing with complex data, two-dimensional map-pings often fail to reveal inherent structures within data. FIGS. 1A-1E illustrate a set of eight clusters laid out with their data centers at the corners of a virtual cube. The simple 2D projections shown in FIGS. 1A-1C do not readily reveal all structures within the data. When the data is visualized within three spatial dimensions as shown in FIGS. 1D and 1E, cluster patterns are more readily discerned. 3D data visualization systems in accordance with many embodi-ments of the invention provide the user with an additional capability to directly interact with 3D cues from motion and parallax that enable a user to more clearly discern structures that may not be readily apparent depending upon the view-point from which a particular 3D visualization is rendered. Stated another way, the ability for the user to readily shift the viewpoint of a 3D data visualization in real time can reveal visual cues that cause the user to explore the data space from a different viewpoint that yields additional insights into the data. The ability to visually observe structure can be par-ticularly useful in circumstances where machine learning algorithms trained to identify structures within data (e.g. k-means clustering) fail due to the presence of outliers that can be readily identified by a human user through visual inspection from one or more viewpoints.
FIGS. 2A and 2B illustrate the different perspective a user can obtain by moving within a 3D visualizations of a multidimensional data space (as opposed to being con-strained to look at data visualized in three spatial dimensions from outside the data space). As the viewpoint the user moves from the viewpoint shown in FIG. 2A toward data of interest and the viewpoint shown in FIG. 213, structure within a particular subset of the data is visible in greater detail. As is discussed further below, 3D data visualization systems in accordance with various embodiments of the invention can support any of a number of different input modalities via which a user can provide instructions con-trolling the zoom, relative position and/or orientation of the 3D data visualization. The 3D data visualizations shown in FIGS. 2A and 2B are rendered by mapping data dimensions to characteristics of 3D objects that include the visibility of the 3D object (some data points may not be shown based upon filtering criterion), the location of the 3D object within a 3D data visualization, the size of the rendered 3D object, and/or the color of the 3D object. In certain embodiments, higher dimensionality visualizations again can be generated
US
9,665,988 B2
11
by using data dimension mappings to determine additional characteristics of the 3D objects including (but not limited to) the shape used to render the 3D object, the texture of the 3D object, and/or the transparency of the 3D object. FIG. 2C illustrates a 3D visualization of the data set shown in FIG. 2B using transparency to represent an additional data dimen-sion. FIG. 2D illustrates a 3D visualization of the data set shown in FIG. 2B using both transparency and texture to represent additional data dimensions. The representation of additional data dimensions through choice of different 3D shapes, including the use of depth perception preserving shapes, in accordance with various embodiments of inven-tion is discussed further below. In other embodiments, data dimensions can be mapped to non-visual aspects of an immersive experience including (but not limited to) motion, sonification, haptic feedback, and/or vibrotactile feedback. An inherent limitation of illustrating 3D data visualiza-tions on a 2D page is that the 3D data visualizations shown in FIGS. 2A-2D are two-dimensional projections of the underlying 3D data visualization. 3D data visualization systems in accordance with many embodiments of the invention provide interactive 3D visualizations that enable interaction and motion parallax, which are lost when 3D data is projected in the manner utilized to generate FIGS. 2A and 2D. Accordingly, a video sequence illustrating interactive data exploration of a 3D data visualization generated by a 3D data visualization system in accordance with an embodi-ment the invention is available at s.com/patent/Virtualiticsl.mp4 and http://www.virtualitic-s.com/patent/Virtualitics2.mp4 and a 3D video sequence of the same interactive session is available http://www.virtual-itics.com/patent/Virtualitics3.mp4. A comparison of the 2D and 3D video sequences provides a sense of the benefits of motion parallax in interpreting the structure of the data used to generate the 3D data visualization by the 3D data visu-alization system. The 2D and 3D video sequences found at http://www.virtualitics.com/patent/Virtualiticsl.mp4, http:// www.virtualitics.com/patentNirivalitics2.mp4 and http:// www.virtualitics.com/patentNirivalitics3.mp4 are hereby incorporated by reference herein in their entirety.
While much of the discussion that follows relates to generation of interactive multidimensional visualizations created by rendering 3D objects within a virtual space, systems and methods in accordance with many embodi-ments of the invention can be utilized to generate multidi-mensional data visualizations using a variety of different techniques for representing data. In several embodiments, 3D data visualizations can include 3D line plots (see, for example, FIGS. 3A and 313) and/or 3D surfaces (see, for example, FIGS. 4A and 413). FIGS. 3A and 3B illustrate visualization of a 3D graph from multiple viewpoints in which data is visualized as a series of 3D line plots. By way of comparison, two dimensional projections of the 3D line plots are shown in FIGS. 3C-3E. FIGS. 4A and 4B illustrate visualization of a 3D graph from multiple viewpoints in which data is visualized as a 3D surface. By way of comparison, two dimensional projections of the 3D surfaces are shown in FIGS. 4C-4E. Accordingly, systems and meth-ods in accordance with different embodiments of the inven-tion are not limited to specific types of 3D data visualiza-tions and can be utilized to generate any of a variety of 3D data visualizations. Systems and methods for performing 3D data visualization that enable a user's cognition system to interpret highly dimensional data and interact with high dimensional data in accordance with various embodiments of the invention are discussed further below.
12
3D Data Visualization Systems
3D data visualization systems in accordance with certain embodiments of the invention can be configured for explo-ration of a 3D graph by a single user or by multiple users. 5 In several embodiments, the 3D data visualization system includes a 3D rendering engine that maps data dimensions to characteristics of 3D virtual objects that are then rendered for visualization within a virtual space by the 3D rendering engine. A machine vision system and/or sensor system can io be utilized to track the pose of one or more users and more specifically track the head position of the user(s). Head positions can be utilized to determine a viewpoint from which to render a 3D display of the virtual space for each user that is interacting with data within the virtual space. 15 Where multiple users are collaborating within a virtual space, head positions and/or poses of the users can be utilized to render the 3D displays presented to each user and to render the avatars of individual users within the data space.
20 Rendering of a 3D graph from different viewpoints of different users in accordance with an embodiment of the invention is conceptually illustrated in FIGS. 5A -51). A 3D data visualization showing avatars of multiple users within a virtual space in accordance with an embodiment of the 25 invention is illustrated in FIG. 5E. In the illustrated 3D data visualization, a 3D graph 500 is shown in which data points are visualized as 3D objects 502 and the viewpoints from which other users are exploring the virtual space is indicated by avatars 504, 506. As is discussed below, a user's ability 30 to orient themselves within a virtual space can be enhanced by providing intuitive interaction primitives such as grid lines 508, and 510 axes labels. In many embodiments collaborating users can independently move through the virtual space or a set of users can experience the same 35 visualization of the virtual space controlled by a single user's interactions with the virtual space. As can readily be appreciated, the specific collaborative exploration modes supported by a 3D data visualization system is largely dependent upon the requirements of a given application. 40 A multidimensional data visualization system that can be
utilized to generate a visualization of multidimensional data within three spatial dimensions for a user and/or to facilitate collaborative multidimensional data exploration in such a 3D space by multiple users in accordance with an embodi-45 ment of the invention is illustrated in FIG. 6A. The 3D data visualization system 600 includes a 3D data visualization computing system 602 that is configured to communicate with a 3D display 604, which in the illustrated embodiment is a head mounted display.
50 The 3D data visualization computing system 602 can also be connected to a camera system 606 that is utilized to capture image data of the user from which the pose and/or head position of the user can be determined. The camera system can also be used as an input modality to detect 55 gesture based inputs. Additional and/or alternative input modalities can be provided including (but not limited to) user input devices, and microphones to detect speech inputs. The camera system can incorporate any of a variety of different camera systems that can capture image data from 60 which the pose of a user can be determined including (but not limited to) conventional cameras, time of flight cameras, structured illumination cameras, and/or multiview stereo cameras. The term pose can be utilized to describe any representation of both a user's position in three-dimensional 65 space and orientation. A simple representation of pose is a head location and viewing direction. More complex pose representations can describe a user's body position using
US
9,665,988 B2
13
joint locations of an articulated skeleton. As can readily be appreciated the specific description of pose and/or camera system utilized within a given 3D data visualization system 600 is largely dependent upon the requirements of a specific application.
In a number of embodiments, the 3D data visualization computing system 602, the 3D display 604, and the camera system 606 are an integral unit. For example, the 3D data visualization computing system 602, 3D display 604, and camera system 606 can be implemented in a head mounted display such as (but not limited to) the HoloLens distributed by Microsoft Corporation of Redmond, Wash. In other embodiments, the 3D data visualization computing system 602 and the 3D display 604 communicate via a wireless data connection in a manner similar to that utilized by the Oculus Rift 3D display distributed by Oculus VR, LLC of Menlo Park, Calif. As can readily be appreciated, 3D data visual-izations can be constructed as a set of virtual objects displayed within a mixed reality context using a MR headset (e.g. HoloLens) and/or displayed in a completely immersive
environment using a VR 3D display (e.g. Oculus). In certain embodiments, the 3D data visualization com-puting system can leverage distributed processing. In a number of embodiments, at least some processing associated with rendering a 3D data visualization is performed by a processor within a head mounted display. In several embodi-ments, additional processing is performed by a local com-puter system with which the head mounted display commu-nicates. In many embodiments, processing is performed by a remote computer system (e.g. computing resources within a cloud computing cluster) with which the head mounted display communicates via the Internet (potentially via a local computer system). Accordingly, 3D data visualization computing systems in accordance with various embodi-ments of the invention are not limited to a single computing device and can encompass a single computing device, and/or a combination of a computing system within a head mounted display, a local computing system, and/or a remote comput-ing system. As can readily be appreciated the specific implementation of a 3D data visualization computing system used within a given 3D data visualization system is largely dependent upon the requirements of a specific application. A multidimensional data visualization system in which multiple users are able to simultaneously explore a 3D visualization of a multidimensional data space in accordance with an embodiment of the invention is illustrated in FIG. 6B. The 3D data visualization system 650 two local com-puter systems 652 that communicate via a server computing system 654 across a network 656. Each of the local com-puter systems 652 is connected to a 3D display 658 and a camera system 660 in a manner similar to that described above with reference to FIG. 6A.
In the illustrated embodiment, the local computer systems 652 each build a 3D model of the multidimensional data space and render video sequences (which may be 2D or 3D) responsive to changes in the pose of the users. In a number of embodiments, the local computer systems 652 are con-figured to enable independent data exploration by the users and pose information can be shared between the local computer systems 652 via the server computing system 654. The pose information can then be utilized to render an avatar(s) within the virtual space that indicates the location from which a specific user is viewing the virtual space. In many embodiments, the local computer systems 652 support a broadcast mode in which one user navigates through the virtual space and the pose of the navigating user is broadcast via the server computing system 654 to the local computer
14
systems 652 of the others users within the virtual space. The local computer systems 652 that receive pose information from the navigating user can use the pose information to render a multidimensional data visualization from the view-5 point of the navigating user for display via another user's 3D
display.
In many embodiments, a broadcast mode is supported by rendering a 3D video sequence and streaming the 3D video sequence to the local computer systems 652 of other users. io In several embodiments, the server computing system 654 system includes sufficient computing capacity (e.g. graphics processing units) to generate 3D data visualizations for each of the users and to stream 3D video sequences over the network 656 to the local computers for display via the 3D 15 displays based upon pose information received from a local
computer system 652.
Computer Systems for 3D Visualization of Multidimen-sional Data
Computer systems that can generate 3D visualizations of 20 multidimensional data can take a variety of forms including implementations in which all of the computing is performed by a single computing device to complex systems in which processing is distributed across head mounted displays, local computer systems and/or cloud based server systems. The 25 specific distribution of different processes is largely depen-dent upon the number of users and the requirements of a given application.
A multidimensional data visualization computing system implemented on a single computing device in accordance 30 with an embodiment of the invention is illustrated in FIG. 7. The multidimensional data visualization computing system 700 may be a personal computer, a laptop computer, a head mounted display device and/or any other computing device with sufficient processing power to render 3D displays at a 35 sufficient frame rate to satisfy the interactive 3D data
visu-alization requirements of a specific application.
The 3D data visualization computing system 700 includes a processor 702. The term processor 702 is used to refer to one or more devices within the computing device that can be 40 configured to perform computations via machine readable instructions stored within the memory 704 of the 3D data visualization computing system. The processor 702 can include one or more microprocessor (CPUs), one or more graphics processing units (CPUs), and one or more digital 45 signal processors (DSPs). In addition, the processor 702 can include any of a variety of application specific circuitry developed to accelerate the 3D data visualization computing system.
In the illustrated embodiment, the 3D data visualization 50 computing system 700 includes a network interface 706 to communicate with remote computing systems (e.g. the puting systems of other users and/or a remote server com-puting system) and an input/output (I/O) interface 708 that can be utilized to communicate with a variety of devices 55 including (but not limited to) a 3D display, and/or a camera system. The specific communication and I/O capabilities required of a computing system used to generated 3D visualizations of multidimensional data is typically deter-mined based upon the demands of a given application. 60 As can readily be appreciated, a variety of software
architectures can be utilized to implement a multidimen-sional data visualization computing system in accordance with an embodiment of the invention. In the illustrated embodiment, 3D data visualizations are generated by a 3D 65 data visualization application 710 that executes within a computing environment created by an operating system 712. The 3D data visualization application 710 leverages a 3D