Using Statistical Analysis of FLOSS Systems
Complexity to Understand Software Inactivity
Francielly Grigorio1, Daniel Miranda de Brito2,
Eudisley Anjos3, Mario Zenha-Rela4
1
Centre for Informatics, Federal University of Paraíba, João Pessoa – PB, Brazil
1
2
Centre for Informatics, Federal University of Paraíba, João Pessoa – PB, Brazil
2
3
CISUC, University of Coimbra, Coimbra, Portugal
3
4
CISUC, University of Coimbra, Coimbra, Portugal
4
Abstract: Understanding how systems evolves can reveal important pieces of information that
can help open source stakeholders to identify what can be improved in the software system’s internal organization. Once software complexity is one of the most important attributes to determine software maintainability, controlling its level in the system evolution process makes the software easier to maintain, reducing the maintainability costs. Otherwise, uncontrolled complexity makes the maintenance and enhancement process lengthy, more costly and sometimes it can contribute to the system abandonment. This work investigates the evolution of complexity in discontinued FLOSS projects, through statistical analysis with data obtained from analisis of SonarQube Software. SonarQube is an open-source software quality tool that analyzes the project’s source code and give the developers a feedback about the internal status of what is being developed. After several analyses, the outcome showed interesting results. A substantial portion of inactive FLOSS projects do not seem to be able to keep up with the extra work required to control the systems complexity, presenting a different behaviour of the
successful active FLOSS projects. Though, some inactive FLOSS projects do have a complexity evolution that resembles with the curves belonging to active projects.
Keywords: Software Complexity, FLOSS, software inactivity, open source success.
I. Introduction
Although Free/Libre Open Source Software (FLOSS) projects has increasingly gained visibility among
programmers in these past years, it is still a challenge for these kind of projects to manage to reach success
(Michlmayr, Hunt, & Probert, 2005). The lack of a rigid structure more present in proprietary software,
sometimes may prejudice the
prosecution of the system. The amount of discontinued projects is undoubtedly higher compared to the number of active projects. To illustrate this scenario, consider the data extracted in November, 2012, from SourceForge.net, one of the
most popular Free Software
repositories. Out of over 174,000 hosted projects, 65% of them were classified as “dormant”, (no development within the last two years) while 28% were classified as “active”, and the 7% remainder were classified as “inactive” (its development was allegedly ceased by the lead developer) (Khondhu, Capiluppi, & Stol, 2013).
Predict model projects in order to correctly foresee success or failure is still a significant challenge in software engineering (Beaver, Cui, Charles, & Potok, 2009). The evolution of these projects may occurs very quickly depending on
programming effort from
collaborators.
According to Lehman’s second law of software evolution, system’s complexity increases unless work is done to maintain or reduce it. So, as the FLOSS systems grow in size and,
consequently, features and
capabilities, they will also grow in complexity if the level of required work is not reached (Capiluppi &
Beecher, 2009). The deterioration of the integrity of the software, result of its continuous evolution, may
manifest itself as growing
complexity (Lehman, 1978). This phenomenon, called code decay in the literature, is likely to make it progressively more difficult to understand the inner workings of the software and, hence, to implement functional additions and changes (Eick, Graves, Karr, Marron, & Mockus, 2001). Thereby, it will be required increasing levels of work done to control complexity, in order to avoid system regression and to maintain their evolution (Capiluppi & Beecher, 2009).
Given the great commitment
necessary to keep a working and evolving FLOSS project, it is not unusual to find projects in which the lead developer(s) lost the interest on it. This was proven by the numbers of “discontinued” and “dormant” projects hosted by SourceForge.net
repository shown previously.
Occasionally, there are contributors willing to continue the development, but its complexity makes it more practical for them to start a new project as a replacement to the original (Terceiro & Chavez, 2009).
Sometimes even the lead
developer(s) realize that the code became so complex that it is more cost-effective to rewrite large parts of the software, or even to rewrite it entirely from scratch, than investing time in enhancing existing code (Terceiro & Chavez, 2009).
During the initial research on the
theme, we notice that some
discontinued projects hosted by web-based repositories, even when declared inactive by its developers (The inactive tag of SourceForge.net
only can be setted by the
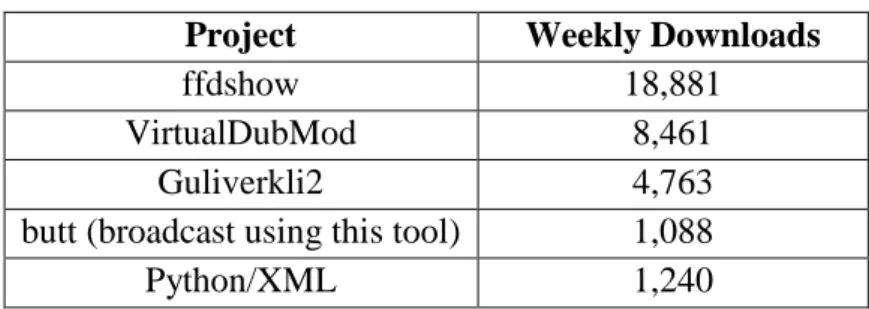
development team) still hold a high download rate per week. That means that projects that no longer have updates in their systems and no maintenance whatsoever still manage to be successful. For instance, we can mention the ffdshow project (Ivanov et al., n.d.), that currently counts with about eighteen thousands of weekly downloads. Below in
Table 1, you can see some
discontinued projects hosted by SourceForge.net repository that have a high download rate per week. If these projects continue being that popular, what is reason why they are discontinued then? To better understand this question, it is important to consider not only the interest of the public that utilizes the
software, but also the internal operation of the system. If the system reaches a point where it is difficult to make necessary changes that contribute to the system’s evolution, this can lead to its inactivation. In this case, the software development is ceased, but it is not necessarily discontinued. discontinued. The difference is that though the system cannot suffer further modifications, it is still running correctly so it can have a large number of page visits and high weekly downloads rate, as well as a wide range of users. Therefore, regardless external discriminators of success, what determines whether a project will continue to evolve or cease its development can be also related to the state of its internal structure. It is in the light of these questions, we propose to explore the source code complexity in order to acquire an overview about the internal behaviour of the system.
TABLEI:DISCONTINUEDPROJECTSHOSTEDONSOURCEFORGE.NET
WITHAHIGHWEEKLYDOWNLOADRATE’
Project Weekly Downloads
ffdshow 18,881
VirtualDubMod 8,461
Guliverkli2 4,763
butt (broadcast using this tool) 1,088
Python/XML 1,240
In this paper, we approach the relation between discontinued
FLOSS and complexity metrics. We think that complexity is one of the
most important attributes to be evaluated attributes to be evaluated in way to ensure an acceptable level of system maintenance. A project with an uncontrolled complexity can become difficult to maintain, and it can contribute to its abandonment. We think that understanding the complexity evolution for these software and the relation with its failure, it can guide us on how to avoid similar failures in software that are still under development. This paper is organised as follows: in Section II we show significant related work about FLOSS projects in order to situate the reader in the subject and relevance of this work. In Section III we state the research strategy containing the methodology we adopted to guide our work. In Section IV we presented the theoretical grounding to our statistical analysis. The results are presented in Section V, in Section VI we discuss future work, and we finalize the paper with the conclusions in Section VI.
II. Related Work
The categorization of OSS projects has been the target of an extensive
number of studies, such in
(Capiluppi, Lago, & Morisio, 2003), (English & Schweik, 2007), where is established that a considerable number of OSS projects tend to be
discontinued, suffering the
“abandonment tragedy” (English & Schweik, 2007).
A study conducted by (Beecher et al., n.d.), investigates whether the inclusion of a specific project in the same forge and distribution of a successful FLOSS project has an influence on its evolutionary characteristics. For the analysis, they sampled 50 projects from both forges: Debian and Source-Forge, and studied their evolution. They concluded that Debian projects do indeed show different characteristics than projects from SourceForge. Debian projects were shown to have a longer period of evolution, were larger in size, attracted more developers and experienced greater activity than SourceForge projects. Their second research question was based on the Debian sample only and assessed the presence of two phases of evolution, i.e. before and after the inclusion into the Debian forge.
However, their results were
ineficient to conclude that there was a statistically significant difference before and after the inclusion.
Using a sample set of 83 projects hosted on Source-Forge.net that had at least 7 developers that have ever contributed code and had at least 100
bugs reported, (Wang, 2005)
concluded that the success of an OSS project can be predicted by just considering its first 9 month development data with his K-Means clustering predictor at relatively high confidence. k-means clustering is a machine learning algorithm used to cluster observations into groups of related observations without any
prior knowledge of those relationships.
Contrary to the idea of most existing studies on the maintainability of OSS projects, which shows that evolving software tends to decrease its quality and maintainability (Bakota et al., 2012), through our research of related work we found that this is not necessarily true, as stated in (Khondhu et al., 2013).
In their paper, (Stamelos, Angelis, Oikonomou, & Bleris, 2002) show empirical results on the relationship between the size of application components and the delivered quality measured through user satisfaction. Quality characteristics of 100 applications written in C for
GNU/Linux were compared to
industrial standards. They limited their analysis to the component level – a component is any C function in the program. They have determined that, up to a certain extent, the average component size of an application is negatively related to the user satisfaction for this application. Their findings relating structural quality to user satisfaction reflects the connection between internal structure and the application acceptability by the user, what may contribute to determine whether an OSS project will become successful or not. In (Schweik, English, Paienjton, & Haire, 2010), the authors investigated what factors lead to success or abandonment of open source software (OSS) projects.
As mentioned in their paper, the
most important external
discriminators of success and abandonment in the growth stage of development process are the quantity of page visits and the download rate. However, it is not clear which factors in the source code structure affects these number.
III. Research Design
A. Research Strategy
Our research strategy is based on the
Goal-Question- Metric (GQM)
approach (Basili, Caldiera, & Rombach, 1994). According to this strategy, we must first specify our goals, then we must delineate those goals to the data that are designated to define those goals operationally, and finally provide a underlying structure for interpreting the data with respect to the stated goals. The GQM approach is a mechanism for defining and interpreting operational and measurable software. It can be used in isolation or, better, within a context of a more general approach to software quality improvement. The following are the objectives and questions that make up the strategy in this paper.
– Goal. The overall goal of this
paper consists in study the relation between source code complexity metrics and the success of FLOSS projects, as well as investigate how further this relation can affect the system’s survival. Once it is clear that we cannot directly point out the
abandonment, we propose to explore the internal factors that may contribute to the project failure.
– Questions. This paper addresses
the following research question:
1) How the internal
properties of the software influence the abandonment of a project?
2) In which point of development process discontinued FLOSS projects tend to fail?
– Metrics and Definitions. In order
to analyse the OSS, we used the following metrics and definitions:
– Lines of Code (LoC): Number of
physical lines that contain at least one character which is neither a whitespace or a tabulation or part of a comment.
– Complexity: It is the cyclomatic
complexity, also known as
McCabe’s complexity metric.
Whenever the control flow of a function splits, the complexity counter gets incremented by one. Each function has a minimum complexity of 1. – Complexity/class: Average complexity by class. – Complexity/file: Average complexity by file. – Complexity/function: Average complexity by function. – Normalized Complexity:
Outcome value of dividing the total complexity of each system version by its size (source code number of lines) of that same version.
B. Data Collection and Analysis In this subsection we specify how the data collection and the analysis of the data obtained was performed.
SonarQube Software: Firstly, aiming to pick a source code quality measurement tool that matched with our needs to fulfil the goals proposed at the beginning of this study, we have chosen to use the SonarQube software. SonarQube is an open source software that aims to be the source code’s quality management platform, allowing control over a large number of software metrics by the development team. The software main goal is to identify how the code is evolving, as well the behaviour of the multiple quality measures, while pointing possible software bugs.
When a SonarQube analysis is performed, the outcome is generated automatically through a complete inspection on the code base, after
which the results are displayed through the web interface displayed
in graphics and dashboards.
Figure. 2: SonarQube Web Interface.
Bellow, we detail the steps taken to perform this empirical study.
1) Sampling of projects. In way to
find the software to fit in our strategy, we performed a research
through the SourceForge.net
repository. The results were filtered to show projects only written in Java, so they were ordered using two tags: inactive and rating. We chose the Java language because it is a widely used object-oriented programming language. Moreover, the rating was important to check how relevant the software among the discontinued ones was. Once that projects had a high value of rating, most of them had a high download rate per week. Then, we manually selected ten projects with more than five released versions to proceed with analysis. We checked the last update date to include only projects that were
inactive for more than two years. Afterwards, we selected three
successful and active FLOSS
projects. They were used to compare with the unsuccessful ones. Two out of them, are well-known systems (Tomcat and Hibernate), and the third one, JabRef, is a smaller software, but still very popular. We chose them based on the availability and good organization of the source code (what simplifies the analysis).
2) Extracting data. The source code
of the selected projects was manually extracted from the respective
projects’ web-pages on
SourceForge.net repository. All released versions available were downloaded.
3) Analysing the source code. As
stated before, we used the
SonarQube tool to execute the analysis. A Python script was written
to automatize the analysis via terminal. Once the analysis is performed, the results are available in the web interface, and count with the extraction of almost twenty metrics analysed. Within the range of metrics generated by the analysis, we adopted six metrics to proceed with our research. The metrics we chose to proceed within this work are presented in the previous subsection.
4) Evaluating the results. The final
step is the evaluation process. The results are obtained through the
execution of SonarQube and data analysis.
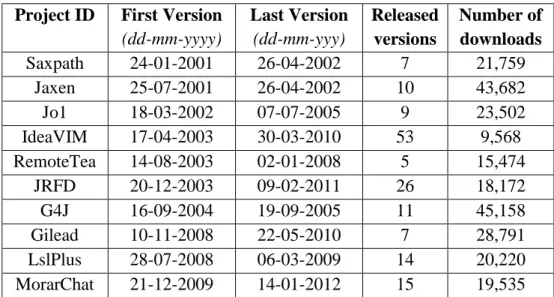
The following table (Table 2) shows
information from the ten
discontinued FLOSS projects
analysed. As we can observe, all of the samples has at least two years of inactivity, what assures that the projects are discontinued in fact. They also present a significant number of downloads per project, which shows on the other hand that all of them had some relevance in the Open Source Software scenario.
TABLEII:DATAOFSELECTEDDISCONTINUEDPROJECTS.
Project ID First Version
(dd-mm-yyyy) Last Version (dd-mm-yyy) Released versions Number of downloads Saxpath 24-01-2001 26-04-2002 7 21,759 Jaxen 25-07-2001 26-04-2002 10 43,682 Jo1 18-03-2002 07-07-2005 9 23,502 IdeaVIM 17-04-2003 30-03-2010 53 9,568 RemoteTea 14-08-2003 02-01-2008 5 15,474 JRFD 20-12-2003 09-02-2011 26 18,172 G4J 16-09-2004 19-09-2005 11 45,158 Gilead 10-11-2008 22-05-2010 7 28,791 LslPlus 28-07-2008 06-03-2009 14 20,220 MorarChat 21-12-2009 14-01-2012 15 19,535
IV. Statistical Analysis
A. Correlation
In order to determine how the complexity metrics are correlated, we started to seek for some correlation coefficient that could measure this connexion. Correlation coefficient is a measure of association between two variables,
and it ranges between 1 and 1. If the two variables are in perfect linear relationship, the correlation coefficient will be either 1 (total positive correlation) or 1 (total negative correlation). The correlation coefficient is 0 if there is no linear relationship between the variables. Two different types of correlation
coefficients are in use. One is called
the Pearson product-moment
correlation coefficient, and the other is called the Spearman rank correlation coefficient, which is based on the rank relationship between variables (“Encyclopaedia of Measurement and Statistics”, 2007).
The Pearson product-moment
correlation coefficient (sometimes referred to as the PPMCC or PCC
or Pearson’s r) is more widely used
in measuring the association between
two variables. Given paired
measurements (X1; Y1); (X2; Y2); (Xn; Yn), the Pearson product-moment
correlation coefficient is a measure of association given by
Where X and Y are the simple mean of X1; X2; ... Xn and Y1; Y2; ... Yn, respectively.
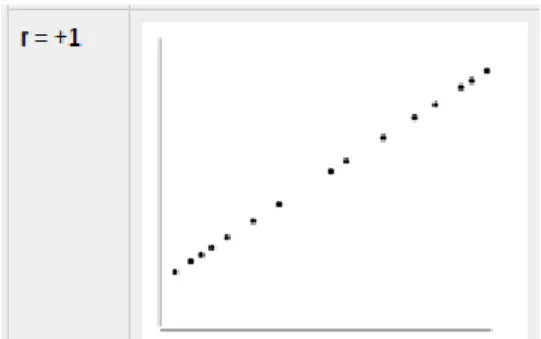
Bellow you can find examples of scatter diagrams with different values of Pearson’s correlation coefficient.
Fig. 3: Data lie on a perfect straight line with a negative slope
Fig. 4: No linear relationship between the variables.
Fig. 5: Data lie on a perfect straight line with a positive slope.
B. R Programming To Calculate Correlation
R is an open-source (GPL) statistical environment, started by Robert Gentleman and Ross Ihaka (hence the name, R) of the Statistics Department of the University of Auckland in 1995. R is a powerful statistical program but it is first and
foremost a programming language. R provides a wide variety of statistical and graphical techniques, including linear and nonlinear modelling, classical statistical tests, time-series analysis, classification, clustering, and others. R is easily extensible through functions and extensions, and, besides, routines have been written for R by people all over the world and mad freely available from the R project website as “packages”. R can perform correlation with the cor() function. Built-in to the base distribution of the program are three routines: for Pearson, Kendal and Spearman Rank correlations. The detailed steps undertaken are the following:
1) The first step is to arrange your data in a .CSV file. Use a column for each variable and give it a meaningful name. Don’t forget that variable names in R can contain letters and numbers but the only punctuation allowed is a period. In our case, we arranged the data in a readable formatation, so we could copy the data into a .CSV file.
2) The second step is to read your data file into memory and give it a sensible name.
3) The next step is to attach your data set so that the individual variables are read into memory.
4) Finally, to get the correlation coefficient you type: cor( var1, var2, method = “method”)
The default method is “pearson” so you may omit this if that is what you want. If you type “kendall” or
“spearman” then you will get the appropriate correlation coefficient.
V. Results
Subsection IV.A shows the
evaluation of the outcome obtained by performed analyse detailed in Subsection III.B. As described in Section III, we defined our goal that is addressed by the research questions. Subsections IV.B discuss questions 1 and 2. Subsection IV.C explain the exception in the results pattern.
A. Evaluating analysis outcome
Given the results of the analysis made with SonarQube, we began to interpret some of the data obtained. The data collected allows us to affirm that the projects are consistently growing since their first release. Delimiting the number of released versions served to not select small projects that are locally developed for a certain public. Thus, the selected projects were being actively developed and receiving new features as an effect of new user requirements.
In order to make a more complete analysis of the systems’ metrics and compare them to each other, we made some normalizations. Thereby, we calculated the complexity ratio by dividing the total complexity of each system version by its size (source code number of lines) of that
same version. We called it
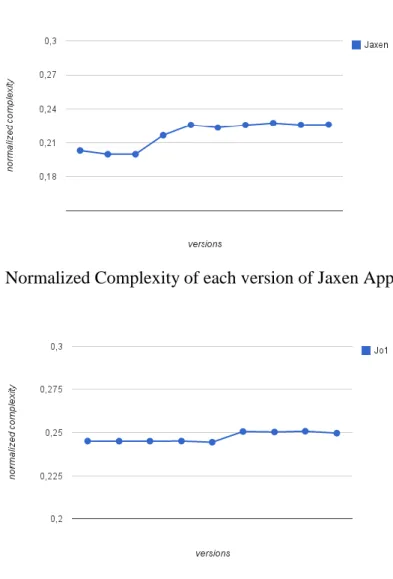
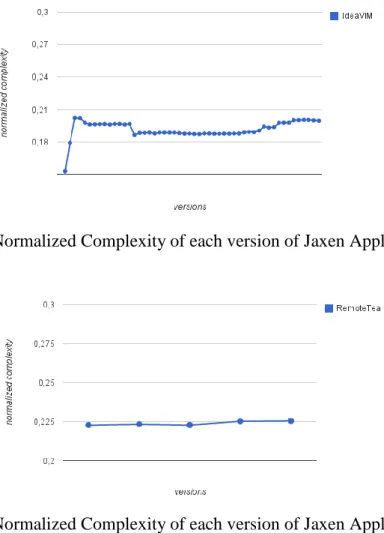
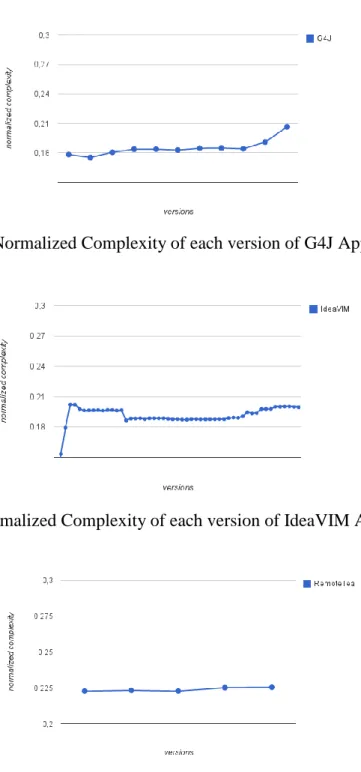
As we can observe through the statistics, shown by Fig. 1, 3, 5, 6, 7 and 9, six out of ten projects
analysed have a resembling
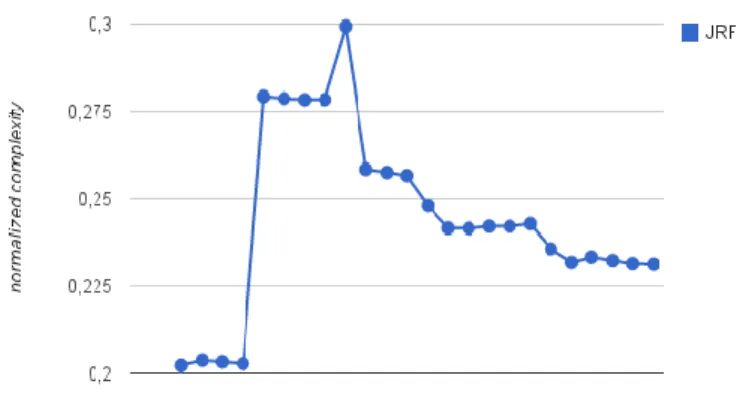
behaviour. These six projects (Jaxen, IdeaVIM, JRFD, G4J, Gilead and MorarChat), show a gradual (Fig. 1, 3, 6 and 7) or uncontrolled (Fig. 5 and 9) rise in their normalized complexity, which tends to remain
for the upcoming versions.
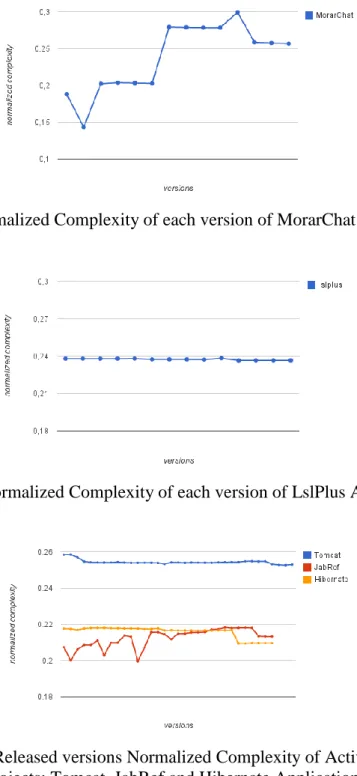
Comparing them with the graphics
that shows the normalized
complexity of active applications (Fig. 11), we can point out the differences. While the active projects has a more controlled complexity, presenting almost a constant normalized complexity, with small decreases on its value, the discontinued projects do not seem to be able to control the system’s complexity, since its complexity is gradually increasing or sometimes it is even widely varying. In the other hand, Fig. 2, 4, 8 and 10 shows that the normalized complexity metric is kept almost constant for these projects. This demonstrate that these inactive projects (Jo!, RemoteTea, Saxpath and LslPlus) have a very similar behaviour to the active ones.
B. Addressing paper questions
Question 1.“How the internal
properties of the software influence the abandonment of a project?”
The complexity data reveals
interesting issues. As verified in the previous subsection, on six out of ten inactive projects analysed the
complexity grows as the time passes, according as the discontinued projects evolve. Also, the curve drawn by the complexity sometimes may shows a lot of variations. Therefore, the increasing complexity of these projects enables us to assert that these projects can not completely control the complexity as faster as it grows. The level of work needed to keep the control over the complexity seems not to be reached by the developers, and this could also contribute to the abandonment of these projects.
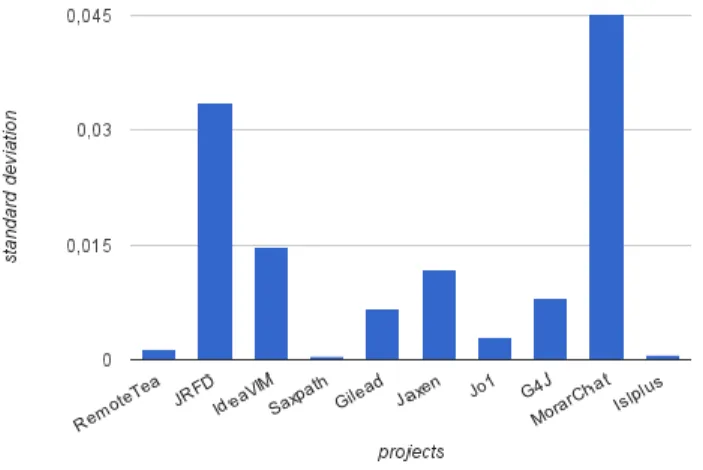
In order to further investigate the relationship between the complexity of a project and its abandonment, we calculate de standard deviation of the complexity metrics. The standard deviation measures how close the set of data is to the mean value of the data set. If the data set have a high standard deviation then the values are spread out very much. If the data set have a small standard deviation then the data points are very close to the mean. The following graphs (figure 12 and 13) shows that discontinued projects have a larger standard deviation than the active ones, when it comes to its normalized complexity, indicating that active projects could possibly have a more effective control over its
complexity. However, it is
mandatory to notice that not all of the inactive projects presents the same behaviour. Fig. 12 ratifies what we observed previously about
similarities etween inactive and active projects. According to Fig. 12, Jo!, RemoteTea, Saxpath and LslPlus projects, shows indeed a low
standard deviation, indicating that these projects kept the normalized complexity under control.
Fig. 6: Normalized Complexity of each version of Jaxen Application.
Fig. 8: Normalized Complexity of each version of Jaxen Application.
Fig. 9: Normalized Complexity of each version of Jaxen Application.
Moreover, observing the graphs we also identified that the complexity/function metric has a higher impact in the systems’
evolution among the other
complexity related metrics also analysed. We calculate the standard deviation as well as the variance of this metric. The variance measures how far a set of numbers is spread out. A variance of zero indicates that all the values are identical.
Therefore, a small variance means that the variable has its numbers not so spread out, thus the similar values indicates constancy in the metric. We found out that both standard deviation and variance is larger for discontinued projects as well (Fig. 14, 15, 16 and 17), what lead us to conclude that in some projects the complexity may have a connection with its failure, especially when we focus in its complexity by function.
Question 2. “In which point of development process discontinued FLOSS projects tend to fail?”
As seen in Section I, there are a lot of projects hosted by web-based repositories that became so complex that it is more cost-effective to rewrite large parts of its source code. When an application reaches this apex of complexity, we can declare it a failed project. Therefore, this “failure point” – considering only the structural motivations – it is when the complexity makes the system no longer maintainable and then the project becomes discontinued.
However, as we can notice from the charts, the structural elements of software do not determine precisely
when a project must be discontinued. Taking in account Fig. 5, which
shows the behaviour of the
normalized complexity of JRFD project, we can see that in the sixth released version of the software occurs a peak on the value of its normalized complexity, but this factor is clearly not sufficient to immediately cease its development. That lead us to conclude that, though
the complexity may have a
contribution on the discontinuation of a project, the point of development process that a project tend to fail is a complex question that involves way more external aspects rather than a limited subset of factors dictated by internal properties.
Fig. 11: Normalized Complexity of each version of G4J Application
Fig. 12: Normalized Complexity of each version of IdeaVIM Application.
Fig. 14: Normalized Complexity of each version of MorarChat Application.
Fig. 15: Normalized Complexity of each version of LslPlus Application
Fig. 16: Released versions Normalized Complexity of Actives FLOSS projects: Tomcat, JabRef and Hibernate Applications.
Fig. 17: Normalized Complexity standard deviation of discontinued FLOSS projects.
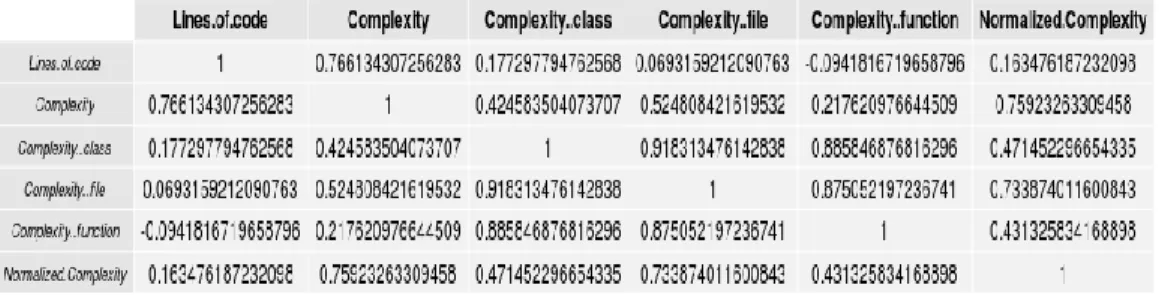
C. Correlation between complexity metrics
As we can see from the figures bellow, which show the Pearson’s coefficient of the complexity metrics from the projects analysed, we can notice that the projects present different correlations for the same pairs of metrics analysed. For instance, the correlation between the LoC x Complexity by function metric is strongly positive for Jaxen application, but it is strongly negative for RemoteTea application and even non existent for Jo! application. Therefore, for each project, its class, function or file characteristics, has a stronger correlation with the other metrics, indicating that this particular metric has a greater impact over the characteristics of the project as a whole. What could determine which
of them – the class, the function or the file – exerts this role, is the definition of its architecture and its definition of module. Once there is not a formal definition of a module, and what a module is in the context of a project, it largely depends on the nature and design of the project. So, this distribution of correlation may has to do of how the development team see the set of modules that compose the source code, and how they implement the additions and modifications in this software.
In order to have a clearer view of what metrics have deeper relation with the Complexity metric, we construct the table below. Take x for positive correlation with th Complexity metric and �x for
Fig. 18: Normalized Complexity standard deviation of actives FLOSS projects.
Fig. 19: Pearson’s correlation coefficient of Jaxen Application.
Fig. 20: Pearson’s correlation coefficient of Jaxen Application.
Fig. 22: Pearson’s correlation coefficient of Jaxen Application
Fig. 23 Pearson’s correlation coefficient of Jaxen Application
Fig. 24 Pearson’s correlation coefficient of Jaxen Application
Fig. 26 Pearson’s correlation coefficient of Jaxen Application
Fig. 27: Pearson’s correlation coefficient of MorarChat Application.
Fig. 28: Pearson’s correlation coefficient of LslPlus Application.
D. Detailed Analysis of Behaviours
Though we collected a small sample of projects, the outcome provided was very diversified, once the projects presented a very divergent behaviour from each other. The main difference is that the output of four out of the ten projects analysed (Jo!,
RemoteTea, Saxpath and LslPlus projects) hold constant values for the studied complexity metrics. Thereby, we decided to further investigate these detached projects in order to verify what could have lead them to this result. Our aim was to answer the question: If the project has a
controlled complexity why did it become discontinued?
Accessing Saxpath webpage on SourceForge.net we found out that the project was not discontinued. In fact, it had the inactive tag because it had been incorporated into another software. In other words, the project
did not show any signs of
uncontrolled complexity and it was active indeed. Also, when accesing
RemoteTea webpage on
SourceForge.net we noticed that the inactive tag was gone, indicating that the project could be reactivated any time by its development team. That
is, the project was not totally abandoned (even it did not receive any released version in the last six years). However, in the case of Jo! and LslPlus projects when accessing
the respective webpages on
SourceForge.net, we did not find any sign of activation by their development team. Posteriorly, we investigate the current state of the remaining six projects that had increasingly complexity. Through an inspection in their website, we found out that all of them, with the exception of IdeaVim project, remained inactive.
TABLEIII:DISCONTINUEDPROJECTSHOSTEDON
SOURCEFORGE.NETHIGHWEEKLYDOWNLOADRATE
Project ID First Version
(dd-mm-yyyy) Last Version (dd-mm-yyy) Released versions Number of downloads Saxpath 24-01-2001 26-04-2002 7 21,759 Jaxen 25-07-2001 26-04-2002 10 43,682 Jo1 18-03-2002 07-07-2005 9 23,502 IdeaVIM 17-04-2003 30-03-2010 53 9,568 RemoteTea 14-08-2003 02-01-2008 5 15,474 JRFD 20-12-2003 09-02-2011 26 18,172 G4J 16-09-2004 19-09-2005 11 45,158 Gilead 10-11-2008 22-05-2010 7 28,791 LslPlus 28-07-2008 06-03-2009 14 20,220 MorarChat 21-12-2009 14-01-2012 15 19,535
IdeaVim project is the only one that presents growth on its complexity only until the 4th version, and then have the metric under control, with small variations. Apart from that peak, its behaviour is more similar to
an active project, once its complexity is very controlled as the application evolves. Thus, excluding the first 4 released versions, the remaining 39
versions had its complexity
development team keep up with the work at the level required by the software growth. Accessing their webpage on SourceForge.net, we found out that they left a note to users, informing that the project was discontinued because Jetbrains Fig. 17: Normalized Complexity standard deviation of discontinued FLOSS projects. took over the IdeamVIM
plugin several years ago, and that any support should be directed to the company. Jetbrains is a software development company whose tools are targeted towards software developers and project managers (Hunger, 2010). The company lists 75,000 customers worldwide, among them Apple, LinkedIn, Siemens, and
Bank of America.
Fig. 29: Complexity by function standard deviation of discontinued s FLOSS projects.
Therefore, it is suitable state that internal properties of the software can not be used to precisely determine whether a project will be abandoned or not, but it can provide an understanding about what could have contributed to software failure. In the case of complexity, we could notice that there is a relation between
uncontrolled complexity and
software abandonment. Thus, it is
important that an analysis over external factors of the software be performed to explore another reasons that could influence the software abandonment. For instance, a study about social impact on software architecture, as we did in a previous work (Siebra, Anjos, & Rolim, 2014), also helps the developers to identify elements that commits the software evolution.
Fig. 29: Complexity by function standard deviation of discontinued s FLOSS projects.
VI. Future Work
This work has limitations that motivates future works. Firstly, the study should be replicated with a larger number of projects samples. The samples used in our work were restricted only to projects written in Java and hosted by SourceForge.net repository. The study would become more complete if it include projects written in other languages, such as C language, once a considerable number of FLOSS projects are
written in this language. Also, future works could have projects hosted by other repositories, such as GitHub and Google Code. Moreover, we recognize that there are a lot of other metrics besides the ones we used in this study, that could help in exploring the FLOSS abandonment
phenomenon. Additional
investigation is necessary, in order to discover others variables that may influence the software failure.
Also, a more detailed analysis needs to be performed, in order to find
correlation between another
complexity metrics in order to confirm the relation of complexity and software inactivity. In future works, it could be used complex
maintainability models instead of only simple complexity metrics, utilizing practical tools for measuring maintainability like SQALE, SIG, ColumbusQM and Quamoco.
Fig. 32: Complexity by function variance of actives FLOSS projects.
Furthermore, it is import to point out that the results of our work could be also valid for every kind of project, once private systems are even more complex and cohesive than FLOSS (Maccormack et al., 2008). In order to confirm this assumption, future work in this theme is required. Moreover, a further investigation whether the projects analyzed could have evolved to other versions and given origin to successful projects, it would be also a worth future work as well.
Finally, this work has shown another direction for future work. We believe that one work that seems to be relevant is to understand if there is a
way to classify if a project is doomed to failure. The failure could be based on known projects that would be used to train a classification mechanism, like a Neural Network. Studies have shown that we can learn with successful projects, but we always forget to learn with projects that have failed.
VII. Conclusion
This paper presents a study of
discontinued FLOSS projects
complexity. By sampling projects hosted at SourceForge.net, tagged as “inactive”, it was investigated whether there is a relation between the metrics used to analyse FLOSS projects complexity, and the
abandonment of them. Though several tests performed in this work, we found interesting results that confirmed some of this relationships. The majority of the discontinued FLOSS projects we have analysed
(60%), showed a substantial
complexity grow since its first release compared to its last one. While the active projects revealed a
more controlled complexity,
presenting almost a constant
normalized complexity, some
discontinued FLOSS do not seem to be able to control the system complexity. The inability to handle the extra work needed to control the
system complexity seems to
contribute to the failure of the system, as predicted by Lehman’s law of software evolution mentioned earlier. One possible explanation of these failures is the use of anti-patterns, that are responses to recurrent problems that should not be done, because they can jeopardise the projects’ evolution and control.
We also observed that the
complexity by function metric seems to have a stronger relationship with the abandonment of the projects, since it is the metric that shows a larger standard deviation for discontinued projects than the active ones.
Besides, we found some projects (40%) that exhibited a different behaviour, having its complexity’s curve more similar to the curve of active projects. A detailed search
showed that two out of these four projects was actually still under development.
Through a statistical analysis of the data extracted with SonarQube, we calculated the Pearson’s coefficient
of correlation between the
complexity metrics and we found that the projects have variants behaviours. Some projects, as Jaxen Project and IdeaVim project present strong correlation between all the diverse complexities (class, file and function) and the total complexity. Some of them, as Jo! and Gilead, present a really weak correlation between all of the three variations and the total complexity. Based on this fact, we decided to investigate it further, and then started to investigate what have happened to each project separately.
Despite the fact that the IdeaVim project presents an increasingly growth on its complexity until its 4th
released version, later its
development team managed to keep the complexity under control. Accessing its website we found out that it was incorporated into another software.
These results lead us to conclude that
although the complexity may
contribute to the software
abandonment, once an uncontrolled complexity demands a higher level of work from contributors, it requires more extra information about the project to guide improvement
decisions related to its activity. Therefore, it is mandatory to also evaluate external elements that may interfere in the software evolution.
We believe that the results of this study can be helpful for FLOSS projects practitioners, since they can
find an explanation of abandonment of collaborators. We also believe that this work can be considered as a base for future works in the area of FLOSS projects, specifically in the area of discontinued projects, which still needs further investigation
References
Bakota, T., Hegedus, P., Ladanyi, G., Kortvelyesi, P., Ferenc, R., & Gyimothy, T. (2012). A cost model based on software maintainability. In Icsm (p.
316-325). IEEE Computer
Society. Retrieved from
http://dblp.uni-trier.de/db/conf/ icsm/icsm2012.htmlBakotaHK FG12
Basili, V. R., Caldiera, G., & Rombach, H. D. (1994). The goal question metric approach. In Encyclopedia of software engineering. Wiley.
Beaver, J. M., Cui, X., Charles, J. S., & Potok, T. E. (2009). Modeling success in floss project groups. In T. J. Ostrand (Ed.), Promise (p. 16). ACM. Retrieved from http://dblp.uni-trier.de/db/conf/promise/promis e2009.htmlBeaverCCP09 Beecher, K., Boldyreff, C., Rank, S.,
Beecher, K., Boldyreff, C., & Rank, S. (n.d.). Evolutionary
success of open source
software: An investigation into exogenous drivers. Electronic Communications of the EASST,
2008.
Capiluppi, A., & Beecher, K. (2009). Structural complexity and decay in floss systems: An inter-repository study. In A. Winter, R. Ferenc, & J. Knodel (Eds.), Csmr (p. 169-178).
IEEE. Retrieved from
http://dblp.uni-trier.de/db/conf/csmr/csmr2009 .htmlCapiluppiB09
Capiluppi, A., Lago, P., & Morisio, M. (2003). Characteristics of open source projects. In
European conference on
software maintenance and
reengineering.
Eick, S. G., Graves, T. L., Karr, A. F., Marron, J. S., & Mockus, A. (2001, January). Does code decay? assessing the evidence from change management data.
IEEE Trans. Softw. Eng., 27(1),
1–12. Retrieved from
http://dx.doi.org/10.1109/32.89 5984 doi: 10.1109/32.895984 Encyclopedia of measurement and
statistics. (2007). In N. J. Salkind (Ed.), Encyclopedia of
measurement and statistics
Inc. Retrieved from http://dx.doi.org/10.4135/9781
412952644 doi:
http://dx.doi.org/10.4135/9781 412952644
English, R., & Schweik, C. M. (2007). Identifying success and tragedy of floss commons: A preliminary classification of sourceforge.net projects. In Proceedings of the 29th international conference on software engineering workshops. ICSEW ’07. Hunger, M. (2010). Jetbrains developer tools. In infoq. Ivanov, A., Andy2222, Bergholm,
D., Rosbach, H. K.,
Krakow, K., & Barry, T. (n.d.).
Ffdshow.
http://sourceforge.net/p/ffdsho w.
Khondhu, J., Capiluppi, A., & Stol, K. (2013). Is it all lost? A study of inactive open source projects. In Proceedings of the 9th international conference on open source systems.
Lehman, M. M. (1978). Programs cities, students, limits to
growth? Programming
Methodology, 42-62.
Maccormack, A., Rusnak, J.,
Baldwin, C. Y., Maccormack, C. A., Rusnak, J., & Baldwin, C. Y. (2008). Exploring the duality between product and organizational architectures: A
test of the mirroring
hypothesis, working paper 08-039.
Michlmayr, M., Hunt, F., & Probert, D. (2005). Quality practices and problems in free software projects. In M. Scotto & G. Succi (Eds.), Proceedings of
the first international
conference on open source systems (p. 24-28). Genova, Italy.
Schweik, C. M., English, R., Paienjton, Q., & Haire, S. (2010,05/2010). Success and abandonment in open source commons: Selected findings from an empirical study of sourceforge.net projects. In
Second international workshop on building sustainable open source communities (oscomm 2010).
Siebra, B., Anjos, E., & Rolim, G. (2014). Study on the social impact on software architecture through metrics of modularity.
ICCSA (5), 618-632.
Stamelos, I., Angelis, L.,
Oikonomou, A., & Bleris, G. L. (2002). Code quality analysis in open source software development. In Information systems journal (Vol. 12, pp. 43–60).
Terceiro, A., & Chavez, C. (2009). Structural complexity evolution in free software projects: A case study. In M. Ali Babar, B. Lundell, & F. van der Linden
(Eds.), Qacos-osspl 2009:
Proceedings of the joint
workshop on quality and
architectural concerns in open source software (qacos) and open source software and
product lines (osspl).
Wang, Y. (2005). Prediction of
success in open source
software development.