DRIVER INATTENTION
– Drivers’ Perception of Risks and Compensating Behaviours –
Richard TAY
David KNOWLES
Associate Professor in Road Safety Driving Institute of Australia Centre for Accident Research & Road Safety Australia
Queensland University of Technology Carseldine, Queensland, Australia
(Received September 17, 2003)
Driver inattention, especially driver distraction, is an extremely influential but generally neglected contributing factor of road crashes. This pa-per explores some of the common behaviours associated with several common forms of driver inattention, with respect to their pa-perceived crash risks, rates of self-reported behaviours and whether drivers regulate such behaviours depending on the road and traffic environment, and provides some policy recommendations to address issues raised.
Key Words: Driver inattention, Risk perception, Self-regulation, Risk compensation
1. INTRODUCTION
Road crashes have been a major cause of death and serious injuries in many developed and developing coun-tries1. For example, there were 1,970 fatalities and 21,978
serious injuries resulting from traffic accidents in 1996 in Australia, and the corresponding annual social cost was estimated to be A$15 billion2. In an effort to reduce the
road trauma, traffic authorities in Australia and New Zealand have implemented a series of countermeasures aimed primarily at reducing the road fatalities, with most states focusing their efforts on the four major contribut-ing factors known as the “fatal four”: speedcontribut-ing, drink-driving, fatigue and non-usage of seatbelts. Relatively little attention, however, has been devoted to several other factors, including driver inattention, that also contributed significantly to the social cost of road crashes in Austra-lia3.
With the exception of a few recent papers investi-gating the impact of mobile telephone usage, little research has been conducted on the problems associated with other forms of drivers’ inattention. The purpose of this study is to explore driver’ perception of the risks associated with inattentive behaviours while driving and their self-re-ported incidences of behaviours such as eating, drinking, using a mobile phone, handling the stereo system, read-ing, writing and looking at scenery and attractive pedes-trians. Comparisons are made with the two widely researched and documented behaviours of speeding and
drink driving to provide a better understanding of driv-ers’ attitudes and behaviours. In addition, this study at-tempts to assess if drivers self-regulate such behaviours in response to different road and traffic environments, as predicted by the risk compensation hypothesis. Finally, some policy recommendations will be provided to im-prove the efficiency in the allocation of scarce road safety resources.
2. METHODOLOGY
Since large-scale observational study of driver dis-traction and inattentive behaviours is extremely difficult if not impossible in real life, self-reported behaviour mea-sures, which can easily be gathered through a survey of drivers, will be used in this study. Also, the survey is an easy method to gather other subjective information such as risk perceptions, which is also extremely difficult and costly to measure objectively on a large scale. Moreover, a simple driver survey is a very cost effective method to conduct exploratory research on a neglected issue that will provide some useful insight into improving road safety. Therefore, a self-administered questionnaire was designed to gather relevant information from the respon-dents regarding perceptions of the risks involved in sev-eral common activities that would distract from the driving tasks and their self-reported inattentive behaviours.
the possible presence of response bias, especially the so-cial desirability bias; that is, respondents may not be will-ing to admit to performwill-ing socially undesirable activities. However, as evident in our results and results from other surveys of illegal and risky driving activities, many re-spondents do not seem to be deterred from admitting to such behaviours4–7. Nevertheless, our results should be
treated as a low estimate of the actual prevalence of driver distraction. In any case, this potential source of bias is not likely to affect their perception of the risks associ-ated with such behaviours. Also, it should be noted that although the survey used has high face validity, it has not been validated and this study should thus be considered as an exploratory study.
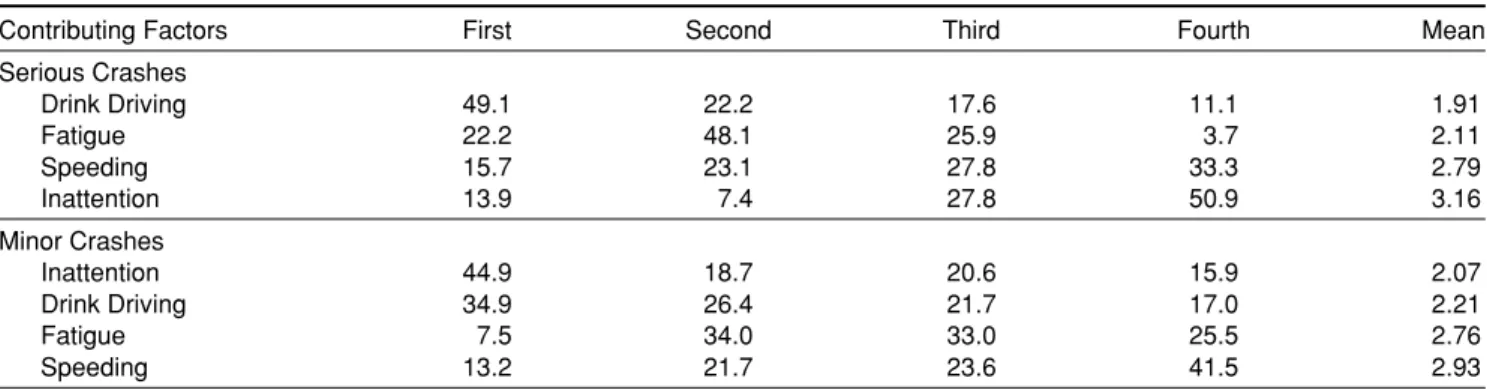
In addition to the usual socio-demographic data, the survey gathered, among other information, four questions that are relevant to this study. First, in order to gauge the respondents’ overall perceptions of the relative risks as-sociated with inattention as compared to some of the more highly publicised risky driving behaviour, the respondents were asked: “Please rank the following behaviours from 1 (most likely) to 4 (least likely) to contribute towards a serious crash?” The question is followed by these factors: drink driving, speeding, fatigue and inattention (see Table 1). The same question and choices were repeated for mi-nor crashes instead of serious crashes.
Second, in order to get more detailed information on the respondents’ perceptions of the risks involved in several common activities that would distract from the driving tasks, they were asked: “How likely do you think a crash will occur if a driver engages in the following behaviours while driving?” These activities included eat-ing, drinkeat-ing, using a mobile phone, handling the stereo system, reading, writing and looking at scenery and
at-tractive pedestrians (see Table 2). The responses were re-corded on a 5-point scale ranging from 1 = very likely to 5 = very unlikely. Again, for the purpose of compari-son, the survey also gathered information on the respon-dents’ perception of the risks associated with several common speeding and drink driving behaviours using the same format.
Third, in order to collate the respondents’ risk per-ceptions with their self-reported behaviours, respondents were asked: “How often do you engage in the following behaviours while driving?” The question was followed by the same list of activities described above and the responses were recorded on a 5-point scale ranging from 1 = never to 5 = regularly (see Table 3). It should be noted that the list of items used was not intended as a compre-hensive list of all possible inattentive behaviours but only as a sample of the common inattentive behaviours within the control of the drivers - an attribute that is important in determining driver self-regulation and the risk compen-sation.
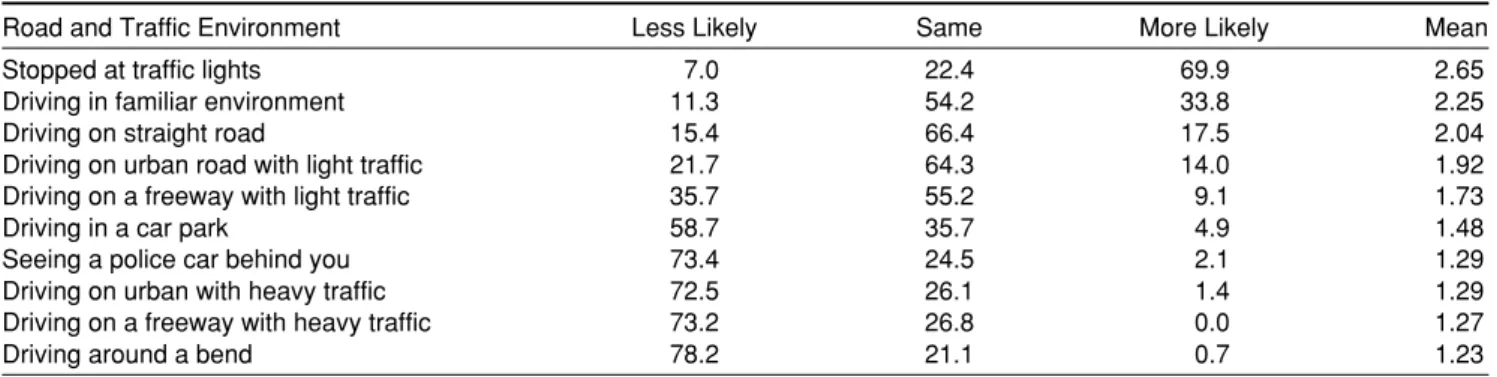
Finally, to examine if drivers self-regulated such behaviours according to the perceived risks in different road and traffic environment, they were asked: “Will you be more likely to participate in the above activities if you are in the following situations?” The question was fol-lowed by a list of road and traffic conditions ranging from stopping at traffic lights to driving on a freeway with heavy traffic (see Table 4) and the responses to each item were recorded on a three point scale with 1 = less likely, 2 = same and 3= more likely. Again, the items used were not intended to be a complete list of different road and traffic environments but a convenient set of options to check for the existence of self-regulation as predicted by the risk compensation hypothesis.
Table 1 Ranking of perceived crash risks of contributing factors
Contributing Factors First Second Third Fourth Mean
Serious Crashes Drink Driving 49.1 22.2 17.6 11.1 1.91 Fatigue 22.2 48.1 25.9 3.7 2.11 Speeding 15.7 23.1 27.8 33.3 2.79 Inattention 13.9 7.4 27.8 50.9 3.16 Minor Crashes Inattention 44.9 18.7 20.6 15.9 2.07 Drink Driving 34.9 26.4 21.7 17.0 2.21 Fatigue 7.5 34.0 33.0 25.5 2.76 Speeding 13.2 21.7 23.6 41.5 2.93
Note: Distribution (%) of the responses for each item is shown in the second to fifth columns. Mean calculated using first = 1, second = 2, third = 3, fourth = 4.
Table 3 Self-reported inattentive behaviours
Inattentive Behaviours Never Rarely Sometimes Often Regularly Mean
Changing channel/volume or cassette/CD on your stereo 4.9 27.3 36.4 20.3 11.2 3.06
Looking at scenery, advertisements, etc 16.8 32.9 32.9 10.5 7.0 3.00
Looking at attractive pedestrians by the side of the road 7.0 22.4 69.9 0.0 0.7 2.58
Eating (fast food, sandwiches, fruits, etc) 23.1 40.6 30.1 5.6 0.7 2.20
Drinking (coffee, tea, soda, etc) 34.3 30.1 23.8 9.1 2.8 2.16
Talking on your hands free mobile phone 62.0 7.7 15.5 7.7 7.0 1.90
Reading maps, newspaper, notes, etc 58.5 33.8 6.3 1.4 0.0 1.51
Talking on your hand-held mobile phone 72.0 21.0 5.6 0.7 0.7 1.37
Making written notes, appointments, etc 83.1 12.0 3.5 1.4 0.0 1.23
Note: Distribution (%) of the responses for each item is shown in the second to sixth columns. Mean calculated using never = 1, rarely = 2, sometimes = 3, often = 4 and regularly = 5.
Table 4 Self-regulation of inattentive behaviours
Road and Traffic Environment Less Likely Same More Likely Mean
Stopped at traffic lights 7.0 22.4 69.9 2.65
Driving in familiar environment 11.3 54.2 33.8 2.25
Driving on straight road 15.4 66.4 17.5 2.04
Driving on urban road with light traffic 21.7 64.3 14.0 1.92
Driving on a freeway with light traffic 35.7 55.2 9.1 1.73
Driving in a car park 58.7 35.7 4.9 1.48
Seeing a police car behind you 73.4 24.5 2.1 1.29
Driving on urban with heavy traffic 72.5 26.1 1.4 1.29
Driving on a freeway with heavy traffic 73.2 26.8 0.0 1.27
Driving around a bend 78.2 21.1 0.7 1.23
Note: Distribution (%) of the responses for each item is shown in the second to fourth columns. Mean calculated using less likely = 1, same = 2, more likely = 3.
Table 2 Perceptions of crash risks of contributing factors
Behaviours Very Likely Neutral Unlikely Very Mean
Likely Unlikely
Making written notes, appointments, etc 62.0 32.1 2.9 2.2 0.7 1.47
Reading maps, newspaper, notes, etc 59.4 33.3 5.1 1.4 0.7 1.51
Talking on your hand-held mobile phone 39.9 43.5 12.3 4.3 0.0 1.81
Eating (fast food, sandwiches, fruits, etc) 14.5 51.4 23.9 10.1 0.0 2.30
Drinking (coffee, tea, soda, etc) 16.7 50.7 18.8 13.0 0.7 2.30
Looking at attractive pedestrians by the side of the road 17.4 44.2 30.4 7.2 0.7 2.30
Looking at scenery, advertisements, etc 14.6 35.8 38.0 11.7 0.0 2.47
Changing channel/volume or cassette/CD on your stereo 12.5 39.0 33.1 14.7 0.7 2.52
Talking on your hands free mobile phone 8.7 37.0 28.3 23.9 2.2 2.74
Exceeding the speed limit by < 10 km/h on a 50km/h road 6.5 29.0 33.3 22.5 8.7 2.98 Exceeding the speed limit by 10–20 km/h on a 50 km/h road 28.3 48.6 13.0 8.7 1.4 2.07 Exceeding the speed limit by > 20 km/h on a 50 km/h road 54.0 35.3 7.9 2.2 0.7 1.60 Exceeding the speed limit by < 10 km/h on a 100km/h road 8.0 18.1 37.7 23.9 12.3 3.14 Exceeding the speed limit by 10–20 km/h on a 100km/h road 25.9 36.0 23.0 12.9 2.2 2.29 Exceeding the speed limit by > 20 km/h on a 100 km/h road 37.4 46.0 10.8 4.3 1.4 1.86
Driving after having an alcoholic drink or two 20.1 31.7 33.8 12.2 2.2 2.45
Driving with a BAC level of 0.05–0.08 51.4 36.2 8.0 4.3 0.0 1.65
Driving with a BAC level of 0.08–0.10 74.6 21.7 2.2 0.7 0.7 1.31
Driving with a BAC level of more than 0.10 91.2 7.3 0.7 0.0 0.7 1.12
Note: Distribution (%) of the responses for each item is shown in the second to sixth columns. Mean calculated using very likely = 1, likely = 2, neutral = 3, unlikely = 4 and very unlikely = 5.
3. SAMPLE
The survey was administered to a sample of 140 participants. Most of the participants were recruited from Australian companies with a demonstrated interest in driver safety and driver training. The organisations in-volved cover a variety of industries but most do not have any drivers who would be considered as part of the trans-port industry, that is, very few of the respondents are pro-fessional or long haul drivers. Since there is no easy way to check on the extent of sample selection bias, the re-sults obtained in this exploratory study should be treated as preliminary and further research using a broader sample should be conducted to confirm some of the find-ings.
The majority of the respondents drove to and from work (80%) and about a third have jobs that “require a lot of driving” but only about one-quarter of the respon-dents drove for more than 15 hours per week. The ma-jority of the respondents drove a car (69.1%) or 4WD (23.5%) most regularly, while the rest drove small trucks, buses, van and motorcycles most regularly.
The respondents were drawn from a fairly even mix in terms of residential locality: city (40.6%), country town (43.4%) and rural (16.1 %). The respondents were pre-dominantly male (75.5%) and had the following age dis-tribution: under 25 (5.6%), 25–34 (15.4%), 35–44 (36.4%), 45–54 (26.6%), 55–64 (9.8%) and above 64 (6.3%).
4. RESULTS
As evident from the survey results shown in Table 1, most respondents considered driver inattention to be a minor contributor to serious crashes but a major contribu-tor to minor crashes. In terms of overall rankings, drink driving was considered to be the most significant con-tributor to serious crashes, followed by, in descending order, fatigue, speeding and inattention. In contrast, in-attention was considered to be the most significant con-tributor to minor crashes, followed by, in descending order, drink driving, fatigue and speeding.
As discussed earlier, driver inattention comprises several common behaviours that have different perceived crash risks. As shown in Table 2, the behaviours that were perceived as most likely to cause a crash were writing, reading and talking on a hand-held mobile phone. These
behaviours were perceived to be more likely to cause a crash than all of the common speeding behaviours, in-cluding driving more than 20 km/h above the speed limit on a 50 km/h road. In addition, both reading and writing while driving were also perceived to be more risky than driving with a moderately high (0.05–0.08) blood alco-hol concentration level. Also, the acts of eating and drink-ing while drivdrink-ing were considered to be about as risky as driving 10–20 km/h over the speed limit on a 100 km/ h road. Moreover, all the inattentive behaviours listed were perceived to be more risky than driving less than 10 km/h over the speed limit.
As shown in Table 3, most drivers reported that they never or rarely read or write while driving. This re-sult is consistent with the perception of most respondents that it is very risky to participate in these behaviours. Reading, however, appeared to be done by a fairly sub-stantial share of the drivers albeit not often or regularly. Also, only about 23% and 34.3% of the respondents, re-spectively, reported that they never drank or ate while driving, whereas the majority of the respondents reported that they had done these activities occasionally. More-over, looking at scenery, advertisements and attractive pedestrians while driving were also done more frequently by drivers in the sample. Finally, as expected, a large pro-portion of the respondents reported that they often handled their car stereo system while driving since these activities were not perceived to be very risky.
As shown in Table 4, drivers reported that they were more likely to participate in inattentive behaviours when they were stopped at traffic lights, driving in fa-miliar environment or driving on a straight road. The neu-tral point appeared to be driving on urban roads with light traffic and any further increase in traffic will induce driv-ers to pay more attention to their driving and engage less in distracting or inattentive behaviours. These results pro-vided some support for the hypothesis that drivers were more likely to participate in inattentive behaviours in a road and traffic environment that they deemed to be safer and less likely to undertake such activities under more adverse conditions, as postulated by the economic theory of consumer choice under uncertainty, in particular, with respect to risk compensation and self-selection.
5. DISCUSSION AND POLICY IMPLICATIONS
In general, respondents did not perceive driver in-attention as a major contributor of serious crashes. This
perception is not consistent with crash statistics from the Australian State of Queensland which showed that it con-tributed more to not only the number of fatal crashes than fatigue but also several times more to the number of se-rious injury crashes than speed, alcohol or fatigue3. Part
of this incorrect perception may be due to the lack of pub-licity and awareness on driver inattention as a major con-tributor to serious crashes. As serious crashes are relatively rare events, very few drivers have much direct experience of a serious crash but instead form their per-ceptions of these crashes from indirect sources such as public awareness and education campaigns. Therefore, more effort should be focussed on highlighting the con-tribution of driver inattention in the road safety campaigns televised in Australia and New Zealand.
In contrast, the perceptions of most respondents re-garding the risks associated with driver inattention with respect to minor crashes are quite consistent with the rankings ordered according to the actual crash statistics3.
This result may be due to the fact that most drivers have more direct experiences of either a near miss or minor crash associated with a variety of contributing factors in-cluding alcohol, speed, fatigue and inattentive behaviours. As minor crashes are relatively more common compared to serious crashes, it is not surprising that the respondents are better able to gauge the relative risks associated with the various contributing factors toward minor crashes than toward serious crashes.
Drivers may also perceive inattention to contribute mainly to minor and not serious crashes because of their ability to self-regulate according to the perceived risks in different road and traffic environments. Unlike the more persistent effects of alcohol on the driver throughout the duration of the trip, driver inattention is more transient during the trip and drivers might be able to compensate for the higher risks involved in driving on more risky road and traffic conditions by paying more attention. It should be noted that many drivers probably have the incorrect notion that a crash in a low risk road and traffic environ-ment (e.g. low speed road or car park) is not likely to be serious. This misconception may be due to the presump-tion that a crash is likely to involve another vehicle and not a pedestrian or cyclist. However, if they were to con-sider the event of hitting a pedestrian or a cyclist to be quite high, then they might reassess it as a serious crash resulting in death or serious injury.
It is important to note that although drivers gener-ally consider inattentive behaviours to be a major con-tributor to only minor crashes, they do consider several types of inattentive behaviours as very risky. Respondents
indicated that writing, reading and talking on hand-held mobile phones while driving were more risky than driv-ing more than 20 km/h above the speed limit on a 50 km/ h road. In addition, inattentive behaviours like reading and writing while driving are also perceived to be more risky than driving with a moderately high (0.05–0.08) blood alcohol concentration level.
Given the strong emphasis on speeding and drink driving by transport authorities and the relative lack of emphasis by most government agencies to address the problem associated with driver inattention, these results suggest that compared to most policy makers, drivers have either overestimated the dangers associated with driver inattention or underestimated the dangers associ-ated with speeding and drink driving. Therefore, unless the differences in the perceived risks between policy mak-ers and drivmak-ers are adequately addressed, it may result in the wrong perception among some drivers that some of the countermeasures directed at reducing speeding and drink driving may not be a measure designed mainly to reduce crashes and improve road safety.
The emphasis on speeding and drink driving, how-ever, may also be partially due to the strong reliance in Australia and New Zealand on legal sanctions and en-forcement to improve road safety and the availability of relatively cost effective means of speeding and drink driv-ing enforcement with a high likelihood of generatdriv-ing more than sufficient revenue to cover the costs of these enforcement activities. In contrast, it is much more diffi-cult to address the issue of driver inattention by enforce-ment due to the diverse nature of behaviours involved which complicates the design and implementation of le-gal sanctions and the large scale detection of such behaviours.
Nevertheless, there are other simple countermea-sures available, such as public education campaigns that can highlight the dangers of a variety of inattentive behaviours while driving, and these countermeasures should be utilised more regularly. An example of such publicity campaigns is the ‘concentrate or kill’ television advertising campaign aired for a short period of time in the Australian state of Victoria. One reason why such campaigns are not utilised as often is the popular belief in the road safety arena that television advertising works only when supported by intensive enforcement activities such as speed camera and random breath testing pro-grams.
The respondents in general reported that they had participated in some of the inattentive behaviours while driving. In particular, about three-quarters and two thirds
of the respondents have respectively reported that they have drank and eaten while driving, albeit not often or regularly. These results suggest that respondents view such activities as socially acceptable and not very risky. Interestingly, although these activities are perceived to be as risky as driving 10–20 km/hr above the speed limit on a 100 km/hr road, only the latter is deemed by most trans-port authorities as a major road safety concern that mer-its intensive public education campaigns such as the “Every K Over is a Killer” advertising campaign. There-fore, relative to the current level of anti-speeding pub-licity campaigns, more public education on the risks associated with these inattentive behaviours should be implemented in order to achieve some consistency in road safety policies.
It is interesting to note that the self-reported use of mobile phone is not as high as popularly believed. The high level of debate and publicity in Australia on the dan-gers associated with mobile phone usage, particularly hand-held phones, while driving may have contributed to the lower usage rate and/or greater social desirability bias in the self-report. On the other hand, part of the lower usage rates may simply be due to the fact that our sample comprises a relatively large proportion of respondents from rural and country towns that are not as well served by such services.
6. CONCLUSION
Despite contributing more to the social costs of road crashes than drink driving, speeding or fatigue, the prob-lem of driver inattention has received little attention in the road safety arena. This paper explored drivers’ per-ceptions of the risks associated with inattention and found that most drivers considered it a more significant con-tributor to minor crashes but a less significant contribu-tor to serious crashes than drink driving, speeding and fatigue. In addition, several types of driver inattention, such as handling the car stereo, looking at scenery, ad-vertisements and attractive pedestrians, eating and drink-ing were found to be fairly widespread. However, drivers also self-regulated these activities according to the road and traffic environment, increasing the likelihood of par-ticipating in such activities when they felt safer and vice-versa.
REFERENCES
1. Murray, C. & Lopez, A. Global health statistics: A Compendium of Incidences, Prevalence and Mortality Estimates for Over 200 Condi-tions, Harvard University Press, Boston. (1996).
2. BTE. The Social Costs of Road Crashes in Australia. Canberra: Bureau of Transport Economics. (2000).
3. Tay R. Prioritising Road Safety Initiatives: Fatalities versus Social Cost. Applied Health Economics and Health Policy, 1(3), 129-134. (2002).
4. Tay R and Watson B. Changing Drivers’ Intentions and Behaviours Using Fear-Based Driver Fatigue Advertisements. Health Marketing Quarterly, 19(4), 55-68. (2002).
5. Tay R, Watson B and Hart S. Personal and Social Influences of Speeding. Proceedings of the Third International Conference on Traffic and Transportation Studies. Reston: American Society of Civil Engineers. (2002).
6. O’Brien S, Tay R and Watson B. An Exploration of Australian Driving Anger. Proceedings of the Road Safety Research, Policing and Edu-cation Conference. Adelaide: Transport South Australia. (2002). 7. Tay R. Exploring the Effects of a Road Safety Advertising Campaign
on the Perceptions and Intentions of the Target and Non-target Audience to Drink and Drive. Traffic Injury Prevention, 3, 195-200. (2002).
ACKNOWLEDGEMENTS
Financial support from the Motor Accident Insurance Com-mission of Queensland is gratefully acknowledged. The views ex-pressed by the authors, however, do not necessarily reflect those of the commission.