Skin Image Processing and Skin Characterizations
Wei Pan
School of Engineering
London South Bank University
Ph.D.
Content
Content ... 1 Acknowledgement... 1 Abstract ... 1 Chapter 1 Introduction ... 1 1.1 Skin Histology... 2 1.1.1 The Epidermis ... 2 1.1.2 The Dermis ... 51.1.3 The Subcutaneous Tissue ... 6
1.1.4 Skin Functions ... 7
1.2 Skin Hydration ... 7
1.2.1 Skin Hydration ... 8
1.2.2 Water concentration profile and TEWL ... 9
1.2.3 The water in stratum corneum ... 9
1.3 Skin Measurement Techniques ... 9
1.3.1 Electrical Conductance ... 9
1.3.2 Electrical Capacitance ... 10
1.3.3 TEWL Measurement ... 12
1.3.4 Infrared Spectroscopy ... 16
1.3.5 Photoacoustic spectroscopy ... 16
1.3.6 Optothermal Infrared Spectroscopy ... 17
1.3.7 Magnetic Resonance Imaging ... 17
1.3.8 X-ray Diffraction ... 18
1.3.9 Ultrasound ... 18
1.3.10 Structured-light 3D Scanner ... 19
1.3.11 Optical Coherence Tomography ... 20
1.3.12 Diffusion Tensor Imaging ... 20
1.3.13 Confocal Raman Spectroscopy ... 21
1.4 Summary and Research Objectives ... 22
1.5 Organization of the Thesis ... 23
Chapter 2 Skin Measurement Instruments ... 24
2.1 OTTER ... 24
2.2 AquaFlux ... 29
2.3 Capacitive Contact Imaging Based on Fingerprint sensor ... 34
2.4 Corneometer ... 39
2.5 Digital Camera ... 41
2.6 ProScope HR2 Digital Microscope ... 42
2.7 Summary ... 43
Chapter 3 Skin Image Processing using MATLAB ... 45
3.1 Image processing Techniques ... 46
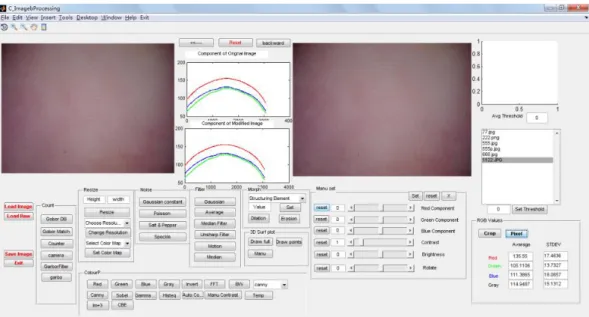
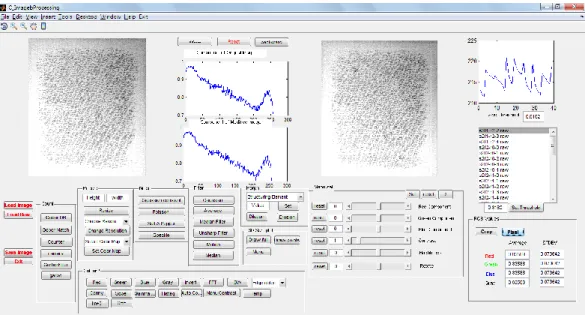
3.2 GUI Programme Implementation ... 66
3.3 Summary ... 83
Chapter 4 Skin Image Processing Using OpenCV ... 84
4.1 OpenCV ... 84
4.2 Microsoft Visual Studio ... 85
4.3 Image Processing Techniques ... 86
4.3.1 Face Detection ... 87
4.3.2 Image Stitching ... 91
4.3.3 Contours Detection ... 95
4.3.4 Real-time Video Processing ... 96
Content
Chapter 5 Skin Characterization Measurements ... 106
5.1 Skin Over-Hydration Measurement ... 106
5.2 AquaFlux Occlusion Effect in Skin Hydration Measurement ... 110
5.3 Skin damage assessment ... 113
5.3.1 Tape stripping measurement ... 113
5.3.2 SLS Irritation Measurement 1 ... 122
5.3.3 SLS Irritation Measurement 2 ... 130
5.3.4 The Occlusion Effects in Capacitive Contact Imaging for In-vivo Skin Damage Assessments ... 133
5.4 Dermabrasion ... 145
5.5 Soap Drying Effect ... 150
5.6 Summary ... 158
Chapter 6 Conclusions and Future Work ... 160
6.1 Conclusions ... 160 6.2 Future Works ... 161 References ... 163 Publications ... 179 Appendix ... 181 QT GUI programme 1 ... 181 QT GUI programme 2 ... 186
Acknowledgement
First, I wish to express my sincere thanks to Dr. Perry Xiao, my supervisor, for his guidance, support and patience during my PhD work. With his help, I obtained a lot of co-operation projects with the other researchers.
I would like to thank to my colleges in the group of South Bank University and Biox Systems Ltd for their help and technical support.
Abstract
Abstract
The skin hydration and skin Trans-epidermal water loss (TEWL) are of great importance in many skin research areas, such as dermatology, clinical analysis, pharmacology and cosmetic science etc. However, to measure them is not easy. Over the years, our research group has developed three novel technologies for such measurements: Opto-Thermal Transient Emission Radiometry (OTTER), AquaFlux and capacitive contact imaging based on the Fingerprint sensor. The aim of this research is to develop new skin image processing and data analysis techniques for capacitive contact images, as well as digital colour images, and to develop new methodologies for skin characterization by using the three technologies.
For skin image processing, a new GUI based MATLAB programme has been developed, which can be used for extracting and analysing the images from the result files created by the measurement instruments. The programme implements the skin image processing techniques such as image enhancement (i.e. brightness equalization, extraction of skin texture, hair removal), image stitching, image matching and skin surface 3D profiling etc. Another image processing programme based on OpenCV has also been developed, which is more suitable for real time video processing, including contour detection, texture extraction and face detection etc.
For the skin characterization, several experiments are conducted: skin over-hydration experiments; skin damage assessment including intensive washing, SLS irritations, and tape stripping; dermabrasion experiments; soap drying effect assessment. These experiments provide better understandings of the technologies. The occlusion effects in capacitive images shows good potential for skin damage assessment, as it can not only reflect the scale of damage, but also the types of damage.
Chapter 1 Introduction
The human skin is the largest organ of the body. It accounts for more than 12% total body weight and 18- 40% total water content in the body.
The water, found mainly in the dermis, is mobilised rapidly in stress situations for use in other organs in the body. However, the ability of the skin to hold water is primarily due to the stratum corneum (SC) and is critical for maintaining healthy skin (Blank, I.H 1952). The water content of the SC and Trans-epidermal water loss (TEWL) are of importance for its infection, dehydration, barrier function and mechanical properties.
There are many attempts which have been made for skin in-vivo measurement, such as electrical capacitance and electrical conductance measurements, evaporimetry, infrared spectrometry, ultrasound, magnetic resonance imaging and wide-angle x-ray diffraction.
In this research, three novel instruments are mainly used for skin measurements: Opto-Thermal Transient Emission Radiometry (OTTER), AquaFlux and capacitive contact imaging based on the Fingerprint sensor. There is a brief introduction of the instruments in Chapter 2.
The aim of this research is to develop new digital image processing and data analysis techniques for capacitive contact images from fingerprint sensor; to develop novel graphic user interface (GUI) based MATLAB software for digital image processing techniques; to develop new methodologies of skin measurement using our novel capacitive contact imaging, AquaFlux and OTTER, as well as other instruments.
This thesis can be divided into two parts, theoretical investigation (Chapter 3 and Chapter 4) and experimental work (Chapter 5).
Chapter 1. Introduction
In the theoretical part, a skin image processing algorithm has been developed for digital images, greyscale capacitive images and webcam. Relevant GUI has been developed to implement all the algorithm and experimental data analysis.
In the experimental work, various in-vivo measurements were performed in order to study skin hydration function using the three novel instruments.
In this chapter, a general introduction and review of skin structure and skin hydration will be presented.
1.1 Skin Histology
Skin is a barrier to provide protection against environmental hazards, such as radiological and microbial attacks, physical and chemical. It also works as a sensor to transmit environmental information such as pain, cool to the nerve centre and depot to store excess food as fat for future use (Swarbrick et al, 1995). For an average 70 kg human being, the surface area is about . A typical square centimetre covers 10 hair follicles, 12 nerves, 15 sebaceous glands, 100 sweat glands, 3 blood vessels with 0.92 m total length, 3.6 m of nerves and cells. Human skin may be subdivided into three mutually dependent layers: the fatty subcutaneous layer (hypodermis), the overlying dermis, and the epidermis, the outermost layer of the skin. Human skin displays two main types. Hairy skin encloses hair follicles and sebaceous glands, but there no encapsulated sense organs.
1.1.1 The Epidermis
The most superficial layer of human skin is the epidermis. The cells of the epidermis are produced from the basal layer and migrate to the exterior, undergoing keratinization to form the outermost layer, the stratum corneum. It
2
1.8m
varies in thickness from 0.8 mm on the palm to 0.06 mm on the eyelids. The epidermis can be subdivided into five layers:
(1) The stratum basale (stratum germinativum).
The stratum basale is characterized by intense mitotic activity. The cell division occurs in this layer. New keratinocytes which move upwards pushing the older above towards the surface of the skin is generated by the basal keratinocytes.
Figure 1.1 Structure of Human Skin, from Van De Graaff KM, Fox SI.
(2) The stratum spinosum.
Chapter 1. Introduction
epidermis of areas subject to continuous friction and pressure (such as the sole of the feet) has a thicker stratum spinosum with more abundant tonofibrils and desmosomes.
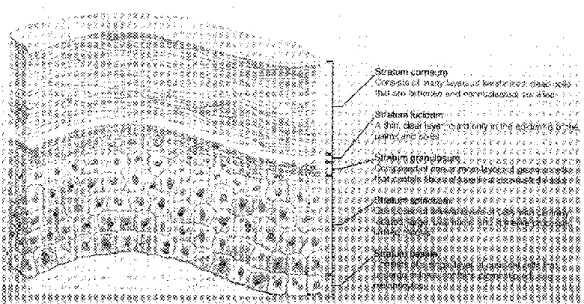
(3) The stratum granulosum (granular layer).
It is characterized by 3-5 layers of flattened polygonal cells containing centrally located nuclei and cytoplasm. The shape is membrane-coating granule, ovoid or rodlike. The cells generate keratohyalin granules in this layer.
Figure 1.2 Structure of Epidermis, from Van De Graaff KM, Fox SI
(4) The stratum lucidum.
It is a thin translucent layer and is generated in the palm of the hand and the sole of the foot, an anatomically distinct, poorly staining hyaline zone.
(5) The stratum corneum (The horny layer).
It is the most superficial layer of the skin and comprises 10 to 15 layers
of dead cells with approximately 10-20 thickness. The structure
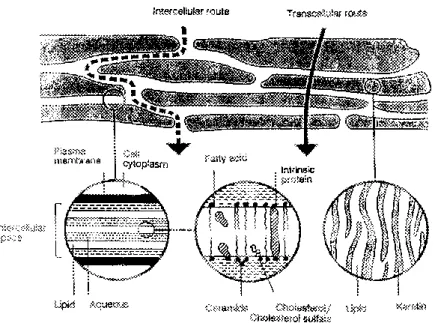
of the stratum corneum may be represented as a brick and mortar model
m
which provides two micropathways for the trans-epidermal drug diffusion (Figure 1.3, William AC and Barry BW, 1992). When the cells arrive at the SC, they are fully keratinized and dead.
Figure 1.3 The “brick and mortar” structure of the stratum corneum (Diagram from William AC and Barry BW, 1992).
The epidermis contains three less abundant cell types: Melanocytes, the Langerhans Cells, and the Merkel Cells.
1.1.2 The Dermis
The dermis shown in Figure 1.4 is the second layer of the skin. The connective tissue that supports the epidermis and binds it to the subjacent layer forms the dermis. The thickness of the dermis varies depending upon the region of the body, reaching its maximum of 3 mm on the soles of the feet (Junqueira LC, 1977).
Chapter 1. Introduction
Figure 1.4 Structure of dermis
The dermis is composed of two layers. One is the immediately sub-epidermal papillary layer, and another is the deeper, more massive and denser the reticular layer. The dermis has a rich network of blood vessels which regulates temperature and pressure, delivers nutrients to the skin and removes waste products, mobilizes defence forces, and contributes to skin colour. The dermis also contains some epidermal derivatives, the hair follicles, sweat and sebaceous glands. A rich supply of nerves is found in the dermis, and the effect or nerves to the skin are postganglionic fibres of the ganglia of the paravertebral chain.
1.1.3 The Subcutaneous Tissue
The subcutaneous fat (hypodermis, subcutis) spreads all over the body. The size of this layer varies throughout the body and from person to person. The subcutis provides a thermal barrier and a mechanical cushion; it is a site of synthesis and depot of readily available high-energy chemicals (Barry BW 1983). It carries the major blood vessels and nerves to the skin and may contain sensory pressure organs (William AC, 1992).
1.1.4 Skin Functions
The skin performs many varied functions. The following presents a brief digest of its biological role (Barry BW 1983).
1. To contain body fluids and tissues --the mechanical function.
2. To protect from potentially harmful external stimuli--the protective or barrier function: (a) micro-organisms; (b) chemicals; (c) radiation; (d) heat; (e) electrical barrier; or (f) mechanical shock.
3. To receive external stimuli, i.e., to mediate sensation: (a) tactile (pressure) ; (b) pain; or (c) heat.
4. To regulate body temperature.
5. To synthesize and to metabolize compounds. 6. To dispose of chemical wastes.
7. To provide identification by skin variations. 8. To attract the opposite sex.
9. To regulate blood pressure.
1.2 Skin Hydration
A water profile in skin calculated from Energy Dispersive Spectrometry Spectra (Warner et al, 1988) is shown in Figure 1.5. The water in skin and its relationship to the skin function will be introduced in the following section.
Chapter 1. Introduction
Figure 1.5 Calculated Water profile across human skin. The vertical scale is percent water expressed as grams of water per total grams (water plus dry mass) of tissue. SC stands for Stratum Corneum, GR stands for Stratum Granulosum, SP stands for Stratum Spinosum, and B stands for Stratum Basale.
1.2.1 Skin Hydration
The relationship between relative humidity and water contents of the stratum corneum is shown in Figure 1.6 (Spencer TS et al, 1975). According to Takenouchi M., at 0% Relative Humidity (RH), stratum corneum still holds about 0.05 g/g water.
Figure 1.6 Concentration of water in stratum corneum in equilibrium with air at 30 ºC as a function of relative humidity.
1.2.2 Water concentration profile and TEWL
Stratum corneum is dry at its surface because of the dry external environment and wet at its base where is contact with the deeper fully hydrated part of the epidermis (Blank IH, 1984). Therefore, a concentration gradient which results in a continuing diffusion of water from within the body through the skin to the environment, trans-epidermal water loss (TEWL) will generate within the stratum corneum. The TEWL for normal skin is about 4~8 𝑔/𝑚2 per h (Tsai J et al, 1990).
1.2.3 The water in stratum corneum
In the stratum corneum, there are three types of water: tightly bound water, loosely bound water and free water. The experiments from (Anderson RL et al 1973) show that the hydration and dehydration rates of free water are lower than that of bound water. This suggests that free water is located primarily intracellular, with the cell envelope the major barrier to its loss, while the bound water is primarily intercellular or on the cell surface.
1.3 Skin Measurement Techniques
Numerous electronic, optical, magnetic and acoustic methods have been used in skin moisture content and skin state measurement (Potts RO, 1986, Berardesca E, 1995).
This thesis mainly focuses on the Fingerprint sensor, OTTER and TEWL measurements. This section presents the skin measurement techniques in order to figure out the strength of each technique.
1.3.1 Electrical Conductance
The physical principle of the conductance method is based on the changes in the electrical properties of the stratum corneum associated with skin hydration (Berardesca E, 1995).
Chapter 1. Introduction
For a conducting or semiconducting element, electrical resistance R and electrical conductance G are defined as
(1.1)
Where I is the electric current through the object and V is the voltage (electrical
potential difference) across the object.
The electrical conductance of organic materials such as protein in the stratum corneum is greatly influenced by the water content. Human skin impedance falls when the frequency of applied alternating current raises and become easily measurable with dry electrodes. It is possible to assess the state of hydration of skin at 3.5 MHz (Tagami H. et al, 1994).
1.3.2 Electrical Capacitance
Water also affects the dielectric constant, which increases with increasing hydration of the stratum corneum. The capacitive imaging instrument (Fingerprint sensor), developed by our previous PhD student (Singh, H. 2010), see Figure 1.1, are based on the capacitance fringing field measurement principle. In this case, the parallel plates of the capacitor are split to a coplanar position; the fringing electric field will continue to create a field between the two plates. More details are described in Chapter 2.
1 I G
R V
Figure 1.1 The prototype of the Fingerprint sensor.
The Corneometer is one of the most commonly used capacitance measurement instruments. The measurement is based on capacitance measurement of a dielectric medium. The Corneometer® CM 825 measures the change in the dielectric constant due to skin surface hydration changing the capacitance of a precision capacitor. The measurement can detect even slight changes in the hydration level. More detail about the Corneometer® CM 825 is presented in Chapter 2.
Advantages of the Corneometer®
Substances on the skin (e.g. salts or residues of topical applied products) have only minimal influence due to capacitance measurement.
It allows very quick measurement (1 s) important to avoid occlusion.
Continuous measurements over a longer time period can optionally be performed.
The measurement depth is very small (10-20 μm of the Stratum corneum) to
exclude the influence of deeper skin layers (e.g. from the blood vessels). Measurements on an only 15 μm thick foil show only 20 % of the original measurement value.
The probe is small and lightweight for easy handling and measurement on all body sites (e.g. lips etc.).
Chapter 1. Introduction
The spring in the probe head ensures constant pressure on the skin enabling exact, reproducible measurements.
The accuracy of the Corneometer® probe and the penetration depth of the scatterfield can be checked easily anytime.
The probe head can quickly be cleaned after each measurement.
Worldwide established as "corneometry" with a broad range of studies. The Corneometer® has even been used on a space mission on the ISS.
The Corneometer® CM 825 and its predecessor Corneometer® CM 820 are
the only skin moisture measurement instruments of which the accuracy have ever been evaluated in a broad multicentric study.
1.3.3 TEWL Measurement
Measurement of transepidermal water loss (TEWL) is important for the infection, dehydration, barrier function and mechanical properties. The instrument (AquaFlux) details are described in Chapter 2.
TEWL is assessed by determining the vapour pressure gradient in the water boundary layer surrounding the skin. This gradient, which is stable in the absence of forced convection, is proportional to the amount of water vapour passing through the boundary layer per unit time and area by evaporation from the skin surface.
AquaFlux is a condenser-chamber based instrument. When the chamber is brought in contact with the skin surface, the chamber is sealed and it can protect the diffusion zone within it from ambient air movement. The natural convection and other bulk air movements are brought down because of the internal dimensions of the chamber being very small. In fluid dynamics terms, this requires the Rayleigh Number to be below the critical value for its geometry. Under these conditions, passive diffusion remains the only transport mechanism for the water vapour entering the chamber. The condenser controls the absolute humidity in the measurement chamber independently of ambient conditions. It is similar to a vapour sink by forming ice on its surface, thus creating a zone of low humidity in its immediate vicinity. By contrast, the test surface acts as a vapour source,
creating a zone of higher humidity in its immediate vicinity. This humidity difference causes water vapour to migrate from source to sink by passive diffusion and creates a diffusion vapour density gradient from which the flux density can be measured (Imhof, R.E. et al, 1999).
The Tewameter® TM 300 is the worldwide most accepted measuring device for the assessment of the TEWL. This is an indispensable parameter for the evaluation of the water barrier function of the skin and a basic measurement in all kind of applications. Even the slightest damage in the skin water barrier can be determined at an early stage. Several hundreds of international scientific studies (Literature List Tewameter®, www.courage-khazaka.de) demonstrate its importance in dermatological research and cosmetological fields.
A certain evaporation of water from the skin takes always place as part of the normal skin metabolism. As soon as the barrier function of the skin is slightly damaged, the water loss will increase (even with smallest damage invisible to the human eye). Therefore this measurement is a basis for all cosmetic and dermatological research. The Tewameter® probe measures the density gradient of the water evaporation from the skin indirectly by the two pairs of sensors (temperature and relative humidity) inside the hollow cylinder. This is an open chamber measurement. The open chamber measurement method is the only method to assess the TEWL continuously without influencing its micro environment. A microprocessor analyses the values and expresses the evaporation rate in g/h/m2.
Chapter 1. Introduction
Figure 1.2 Cutout diagram of the probe head chamber of the Tewameter
(http://www.courage-khazaka.de/index.php/en/products/scientific/139-tewameter#tm1a).
(1.2)
Where A = surface [m2], m = water transported [g], t = time [h], D = diffusion constant [= 0.0877 g/m(h(mmHg))], p = vapour pressure of the atmosphere [mm Hg], x = distance from skin surface to point of measurement [m].
Advantages of the Tewameter®
Extremely accurate and quick measurement of the TEWL without any
influences of the micro climate of the skin (pressure, occlusion, temperature) The small size of the probe head minimizes the influence of air turbulence
inside the probe.
Its low weight has no influence on the skin structure and ensures easy handling.
No waiting time between the measurements
Traceable, sophisticated calibration of humidity, temperature and TEWL to g/h/m2
A stable measurement is achieved quickly; continuous measurements over longer periods are also possible depending on the application.
dm dp
D A
The development of the measurement values, average and standard deviation over time is always visible. Display of r.h and °C separately for upper and lower sensor
Worldwide most used TEWL measurement method (even approved in
space). Several hundreds of performed studies with the Tewameter® prove this fact.
Recording of the ambient conditions with the Ambient Condition Sensor RHT 100 to help to compare measurements taken at different times
Special calculations i.e. SSWL (Skin Surface Water Loss - assessment of skin's water holding capacity after occlusion) are possible
With the open chamber measurement even higher water loss values can be detected accurately as no water is collected inside the probe.
Accuracy of the probe can be checked anytime quickly Offset function to compensate "aging effects" of the probe
Measurement with several probes at the same time possible (e.g. for the measurement of large areas or sweat studies)
Accessories for measurements on small skin areas, special adapters to be hygienically cleaned etc. are available
The VapoMeter is the only fully portable instrument available for the measurement of TEWL values and evaporation rates.
The VapoMeter is battery-operated and portable. This offers great freedom of movement and the possibility of measuring difficult areas. Changeable and re-usable adapters are available for different in-vivo and in-vitro user applications. The core of the VapoMeter is a sensitive humidity sensor that is inside a cylindrical measurement chamber. This chamber is closed by the skin or other measurement surface during the measurement period and is unaffected by ambient airflows. The sensor monitors the increase of relative humidity (RH) inside the chamber during the measurement. The evaporation rate value (g/m²h) is automatically calculated
Chapter 1. Introduction
from the RH increase. The chamber is passively ventilated between measurements and the ventilation time is automatically controlled.
The VapoMeter is widely accepted as the most practical and efficient instrument for TEWL measurements.
1.3.4 Infrared Spectroscopy
The Infrared spectroscopy measurement (Osberghaus et al, 1978) is based upon human skin exhibiting two characteristic absorption bands at 1,645 𝑐𝑚−1 and at 1,545 𝑐𝑚−1. The first of these bands, amide I band, is greatly expanded by the presence of water, while the second band, the amide II band, is unaffected. The ratio between the two bands is therefore largely dependent upon the amount of water present in the horny layer (Gloor M et al, 1980, 1981).
Attenuated Total-reflectance (ATR) infrared spectroscopy was also used to measure the water content (Potts RO, 1985). A weak water-absorbance band near 2,100 𝑐𝑚−1 was detected in both in-vivo and in-vitro spectra. The significance of this band is that it occurs in a region of the mid-infrared where the SC and most topically applied substances show no absorption. In-vitro spectra obtained as a function of ambient relative humidity showed an increase in absorbance near 2,100
𝑐𝑚−1with increasing water concentration in the SC. The combined in-vivo and in-vitro results lead to a quantitative assessment of water concentration in the uppermost layers of the SC. In addition, the ATR-IR technique holds promise for the measurement of water concentration at varying depths, since the penetration changes with the incident angle. Thus, optical sectioning of the SC may be achieved with variable-angle optics. The internal reflection element (IRE) usually used is a zinc sulfide trapezoid.
1.3.5 Photoacoustic spectroscopy
Photoacoustic spectroscopy has also been examined for measuring the concentration profile of water in human SC in-vivo (I. Simon et al, 1979). Photoacoustic spectroscopy measures the acoustic signals arising when modulated optical radiation is absorbed near a sample’s surface. Absorption of optical
radiation by water within the stratum corneum results in localized heating in proportion to the amount of water present at any given depth. Because the incident radiation is modulated, the penetration depth of a periodic heat wave into the stratum corneum depends on its frequency.
1.3.6 Optothermal Infrared Spectroscopy
An Optothermal Infrared Spectroscopy (OTIS) method has been introduced for skin water measurement in-vivo (Frodin T et al, 1988). The technique is based on detection of heat generated in sample owing to absorption of periodic monochromatic radiation, where water has a highly specific absorption band. The heat is conducted to a thin sapphire plate in contact with the skin and transparent to the radiation directed to the test area. The subsequent thermal expansion of the plate is transformed to an electrical signal by an annular piezo-electric crystal cemented to the periphery of the plate. The signal is fed into a lock-in amplifier and recorded on a pen-recorder. The signal detection depth is depending on the chopping frequencies, the higher frequencies the shorter the detection depth, the lower frequencies the longer the detection depth.
1.3.7 Magnetic Resonance Imaging
Magnetic Resonance Imaging (MRI) is a technique for producing images with good spatial resolution and tissue differentiation. MRI has been used as a diagnostic technique since 1980 and is now frequently employed because of its non-invasive nature. The parameters which produce contrast between different tissues are essentially relaxation times (T1 and T2) and proton density. They can be measured in a localized area and are related to mobile water content. Transverse relaxation time (T2) is a more sensitive indicator of changes in the amount of mobile water than longitudinal relaxation time (T1). Proton density might seem to be a potentially superior index of skin hydration, but the measurement of this parameter is more difficult than that of T2, and, in addition, needs an external reference (Franconi F et al, 1995). In principle, the method can also be used to make absolute, not just relative, measurements of the water content of skin in-vivo. MRI can readily locate and distinguish water in body tissue. MRI enables one to
Chapter 1. Introduction
study proton exchange phenomena, making it possible to move beyond the simplistic concepts of “bound” water and “free” water (Ablett S et al, 1991, Duce SL et al, 1992). But MRI has a relatively low spatial resolution and sensitivity for SC because of its unusual dryness and low thickness (Elsner P et al, 1994).
1.3.8 X-ray Diffraction
The structure (lipid, keratin and protein) of SC has been investigated by Small-angle and Wide-Small-angle X-ray Diffraction measurements (Swanbeck G, 1959, Bouwstra JA et al, 1992, Cornwell PA et al, 1994). The intercellular bilayers and intracellular keratin structures did not change with hydration level, this was taken to indicate that there is no water absorbed between the lamellar regions of human SC. A disordering of the lipid lamellar structure was observed when SC was heated to about 60ºC. However, no changes in the protein structure were observed. Because water is a strong X-ray absorber, the overall intensity and resolution of the diffraction patterns decrease with increasing water content of the sample.
1.3.9 Ultrasound
A typical dermatological ultrasound scanner uses echo reflections of pulsed high frequency ultrasound (>10MHz) from a transducer. The time lag between emitted and reflected sound waves depends on the physical distance between the surface of the object and the different layers of the object, which might reflect the sound. In A-mode, scans produce intensity-time curves, with peaks representing echoes from different layers. The distance between peaks within the object is easily calculated when the intra-object velocity of sound is known. In B-mode scanning, the transducer is automatically moved tangentially over the object and a number of A-mode scans are depicted and processed electronically. In C-mode scanning, a horizontal picture is depicted. M-mode scanning is a special procedure in which such structures and their motility pattern may be characterized (Berardesca E et al, 1995).
1.3.10 Structured-light 3D Scanner
A structured-light 3D scanner is a 3D scanning device for measuring the three-dimensional shape of an object using projected light patterns and a camera system.
Structured-light 3D scanners project a pattern of light on the subject and look at the deformation of the pattern on the subject. The pattern is projected onto the subject using either an LCD projector or other stable light source. A camera, offset slightly from the pattern projector, looks at the shape of the pattern and calculates the distance of every point in the field of view.
Structured-light scanning is still a very active area of research with many research papers published each year. Perfect maps have also been proven useful as structured light patterns that solve the correspondence problem and allow for error detection and error correction (Morano, R., et al, 2002).
The advantage of structured-light 3D scanners is speed and precision. Instead of scanning one point at a time, structured light scanners scan multiple points or the entire field of view at once. Scanning an entire field of view in a fraction of a second reduces or eliminates the problem of distortion from motion. Some existing systems are capable of scanning moving objects in real-time. VisionMaster creates a 3D scanning system with a 5-megapixel camera – 5 million data points are acquired in every frame.
A real-time scanner using digital fringe projection and phase-shifting technique (certain kinds of structured light methods) was developed, to capture, reconstruct, and render high-density details of dynamically deformable objects (such as facial expressions) at 40 frames per second (Song Zhang, 2006). Recently, another scanner has been developed. Different patterns can be applied to this system, and the frame rate for capturing and data processing achieves 120 frames per second. It can also scan isolated surfaces, for example, two moving hands (Kai Liu, 2010). By utilizing the binary defocusing technique, speed breakthroughs have been made that could reach hundreds of (Song Zhang, 2010) to thousands of frames per second (Yajun Wang, 2011).
Chapter 1. Introduction
1.3.11 Optical Coherence Tomography
Optical coherence tomography (OCT) is an established medical imaging technique that uses light to capture micrometer-resolution, three-dimensional images from within optical scattering media (e.g., biological tissue). OCT is based on low-coherence interferometry, typically employing near-infrared light. The use of relatively long wavelength light allows it to penetrate into the scattering medium. Confocal microscopy, another optical technique, typically penetrates less deeply into the sample but with higher resolution.
Depending on the properties of the light source (superluminescent diodes, ultrashort pulsed lasers, and supercontinuum lasers have been employed), optical coherence tomography has achieved sub-micrometer resolution (with very wide-spectrum sources emitting over a ~100 nm wavelength range).
1.3.12 Diffusion Tensor Imaging
Diffusion tensor imaging (DTI) is a magnetic resonance imaging technique that enables the measurement of the restricted diffusion of water in tissue in order to produce neural tract images instead of using this data solely for the purpose of assigning contrast or colours to pixels in a cross sectional image. It also provides useful structural information about muscle—including heart muscle—as well as other tissues such as the prostate (Manenti et al, 2007).
In DTI, each voxel has one or more pairs of parameters: a rate of diffusion and a preferred direction of diffusion—described in terms of three-dimensional space— for which that parameter is valid. The properties of each voxel of a single DTI image is usually calculated by vector or tensor math from six or more different diffusion weighted acquisitions, each obtained with a different orientation of the diffusion sensitizing gradients. In some methods, hundreds of measurements— each making up a complete image—are made to generate a single resulting calculated image data set. The higher information content of a DTI voxel makes it extremely sensitive to subtle pathology in the brain. In addition, the directional
information can be exploited at a higher level of structure to select and follow neural tracts through the brain—a process called tractography (Filler, Aaron, 2009). A more precise statement of the image acquisition process is that the image-intensities at each position are attenuated, depending on the strength (b-value) and direction of the so-called magnetic diffusion gradient, as well as on the local microstructure in which the water molecules diffuse. The more attenuated the image is at a given position, the greater diffusion there is in the direction of the diffusion gradient. In order to measure the tissue's complete diffusion profile, one needs to repeat the MR scans, applying different directions (and possibly strengths) of the diffusion gradient for each scan.
1.3.13 Confocal Raman Spectroscopy
Raman Spectroscopy is a non-destructive technique, based on scattering of light by molecules. The sample under investigation is illuminated with low power laser light. In a Raman scattering event, part of the energy of the incoming light is transferred to a molecule, thereby exciting one of the molecule's vibrational modes. Every molecule contributes to the overall Raman spectrum of a cell or a tissue, the spectrum is, in fact, a direct representation of the overall molecular composition. As such the Raman spectra can be used as highly specific spectroscopic fingerprints, which enable identification or classification of cells and tissues. The technique is non-destructive and does not require sample preparation, nor reagents, dyes, labels or other contrast enhancing agents. It is perfectly suited for in vivo application. Measurements can be carried out in a matter of seconds or less. The gen2-SCA has been custom-designed for rapid, non-invasive data collection from the skin, including the skin of the scalp and the axilla. It uses red and near-infrared laser light and complies with international standards for safe laser light exposure of the skin.
The gen2-SCA is a highly sensitive confocal Raman system for in vivo skin analysis.
Chapter 1. Introduction
Determine molecular concentration profiles from the skin surface into the dermis, in seconds to minutes, with high spatial resolution.
Obtain information about the concentration and distribution of amino acids, sweat constituents, lipids, proteins, water, and topically applied materials. Study penetration and transdermal delivery of topically applied materials. Examples of applications are:
Water concentration profiles from skin surface to dermis in minutes
Determination of Natural Moisturizing Factor concentration in the stratum corneum
Studies of the penetration of topically applied materials Optimization of formulations for actives delivery
1.4 Summary and Research Objectives
In summary, this chapter presents the basic introduction and review of skin characterization such as skin structure, functions, hydration and trans-epidermal water loss (TEWL). This chapter also describes the latest skin measurement technologies.
The literature reviews show that there are many exciting technologies that have been used for skin measurements, such as recently developed capacitive contact imaging etc. But there are still many questions unanswered, particularly in the areas related to skin hydration, skin TEWL, and skin damage assessments.
Therefore, the aims of this study are to develop new skin imaging analysis algorithm for capacitive contact imaging and other skin imaging, and to have a better understanding in characterization, i.e. skin hydration, skin TEWL and skin damage assessments.
1.5 Organization of the Thesis
Chapter 2 presents the instruments which were used in this thesis for skin hydration and TEWL measurements: OTTER, Aqua Flux, Fingerprint sensor, Corneometer, digital camera and ProScope HR2.
Chapter 3 and Chapter 4 present the skin image processing algorithms and relevant GUI programme such as image matching, stitching, enhancing etc.
Chapter 5 presents three experiments: Skin damage assessment including tape striping, Dermabrasion and SLS-irritation; Skin over-hydration measurements; Soap drying assessment.
Chapter 2 Skin Measurement Instruments
Chapter 2 Skin Measurement Instruments
Measurements of skin hydration of Stratum Corneum (SC) and Trans-epidermal water loss (TEWL) are of great importance in many research areas such as dermatology, clinical analysis, pharmacology and cosmetic science.
Studies show that there are many techniques for skin in-vivo measurements, such as electrical capacitance measurements, evaporimetry, infrared spectrometry, ultrasound, magnetic resonance imaging and wide-angle x-ray diffraction.
In this thesis, three novel instruments are mainly used for skin hydration and TEWL measurements: Opto-Thermal Transient Emission Radiometry (OTTER), AquaFlux and capacitive contact imaging based on Fingerprint sensor. Another four instruments were used for performance assessment comparing with the data from Fingerprint sensor.
In this Chapter, a brief introduction of the instruments will be presented.
2.1 OTTER
Opto-thermal transient emission radiometry (OTTER), shown in Figure 2.1, is an infrared remote sensing technique based on photothermal radiometry (PTR) or Opto-thermal radiometry (OTR). OTTER is invented and developed by the research group. It has many advantages, such as non-contact, non-invasive, work on arbitrary surfaces, in-sensitive to colour and small movements. Due to the large size of the laser generator and cooling system, OTTER is not a portable instrument.
Figure 2.1 The OTTER apparatus.
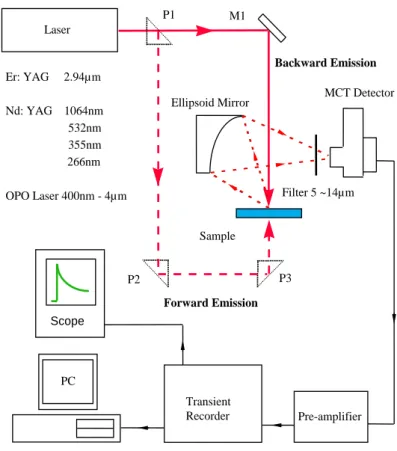
Figure 2.2 shows a schematic diagram of the OTTER.A Q-switched pulsed laser as the excitation source is used to heat up the sample surface and then generate a heat radiation. Heat radiation, whose wavelength region is in the mid-infrared 5-15µm, is focused by an aluminium ellipsoidal mirror from the sample onto a high speed, liquid nitrogen cooled Mercury Cadmium Telluride (MCT) detector, whose signal is captured by a digital oscilloscope. A PC, linked to the transient recorder as digital oscilloscope through a high-speed parallel interface, is used for signal averaging, data storage, display and analysis. The shape of the measured signal is dependent on the sample’s optical and thermal properties, the thickness of the sample and its layer structure.
Chapter 2 Skin Measurement Instruments
Figure 2.2 The schematic diagram of OTTER, where P1, P2, P3 are prisms, and M1 is a mirror.
In Opto-Thermal physical process, OTTER measurements can be modelled as three sequential physical processes as follows:
(1) The near-surface region of the sample is heated by absorption of the incident laser energy. This establishes an initial temperature field at time t=0.
(2) The absorbed energy diffuses within the sample and causes the temperature distribution to change with time (transient temperature field).
(3) Due to the changes of the transient temperature field, the thermal radiation from the sample surface changes. This heat radiation can be detected, recorded and analysed as an opto-thermal signal.
1 Scope Er: YAG 2.94µm Nd: YAG 1064nm 532nm 355nm 266nm OPO Laser 400nm - 4µm Sample P2 P3 MCT Detector Ellipsoid Mirror Filter 5 ~14µm Laser M1 P1 Forward Emission Backward Emission Transient Recorder Pre-amplifier PC
Therefore, Opto-thermal signals can be modelled in three steps: (1) the initial temperature field; (2) the transient temperature distribution; (3) the infrared heat radiation. The main sample properties involved in these three steps: (1) the absorption coefficient for the laser radiation ; (2) the thermal diffusivity D; (3) the absorption coefficient for the emitted thermal radiation .
When laser radiation is incident on a sample surface, some radiation will penetrate into sample as it is absorbed. The initial temperature field can be expressed as:
(2.1)
Where is the temperature at t=0 of sample at position z, with z=0 at the surface of the sample and increasing toward the inside of the sample. C is the sample’s specific heat, is the sample’s density and is the energy density absorbed from the excitation pulse (Xiao, P, Imhof, R.E 1998).
The temperature re-distribution after the initial disturbance follows the diffusion law, which can conveniently be expressed in Green's function form as:
(2.2)
Where is Green's function describing the temperature change in
position at time due to a Dirac-Delta heat disturbance at position and time . Therefore the transient temperature field can be found by integration of the heat source and Green's function in the semi-space of the sample.
0 ( , 0)z E e z C ( , 0)z E0 ' ' ' ' 0 0 ' ' ' ' 0 ( , ) ( , ) ( , ; , ) ( , 0) ( , ; , ) t Q z t z t G z z t t dz dt C z G z z t t dz
' ' ( , ; , ) G z z t tz
t ' z ' t ( , )z tChapter 2 Skin Measurement Instruments
The opto-thermal signal comes from the transient thermal radiation, which is
caused by the time-dependent temperature field above. The calculation of
Opto-thermal signal is given by (Xiao, P, Imhof, R.E 1998):
(2.3)
Where the parameter includes factors that depend on the blackbody
emission curve, detector sensitivity, focusing and alignment, but is independent of the properties of the sample.
By substituting Eq. (2.1) and (2.2) into Eq. (2.3), and using semi-opaque limit, >> , or >> , we have
(2.4)
Where is either or , , is the amplitude of the
signal and is the complementary error function,
is error function. The least-squares fitting of all signals of
OTTER measurements in this thesis is done by using Eq. (2.4).
OTTER has demonstrated the capability for measuring skin hydration, skin pigments, skin thickness and transdermal drug delivery. However, Skin measurement is not the only application of OTTER measurements. OTTER can also be used as a non-destructive evaluation technology for many industrial applications, such as (Xiao, P, Imhof, R.E 1998):
(1) Measurement of thermal properties of materials. (2) Measurement of optical properties of materials.
( , )z t 0 ( ) 0 ( ) ( ) ( , ) z z dz S t
z e z t dz ( em)
ˆ / ˆ 1 ( ) t / S t A e erfc t ˆ ˆ 2 1 ˆ D 0 1 ˆ E A C ( ) 1 ( ) erfc x erf x 2 0 2 ( ) x y erf x e dy
(4) Measurement of thermal resistance of materials. (5) Material characterization.
(6) Flaw detection and characterization.
2.2 AquaFlux
AquaFlux (Biox Systems Ltd), shown in Figure 2.3, originally developed by the research group, is a novel condenser-based, closed chamber technology for measuring water vapour flux density from arbitrary surfaces, including in-vivo measurements of trans-epidermal water loss (TEWL), skin surface water loss (SSWL) and perspiration.
Figure 2.3 AquaFlux
It uses a cylindrical measurement chamber, with one end open and attached to the sample surface, and another end closed and cooled down to below the water freezing point. Figure 2.4 shows a simple cutout diagram of the AquaFlux condenser-chamber. When the chamber is brought in contact with the skin surface, the chamber is sealed and it can protect the diffusion zone within it from ambient
Chapter 2 Skin Measurement Instruments
air movement. The natural convection and other bulk air movements are brought down because of the internal dimensions of the chamber being very small. In fluid dynamics terms, this requires the Rayleigh Number to be below the critical value for its geometry. Under these conditions, passive diffusion remains the only transport mechanism for the water vapour entering the chamber.
Figure 2.4 A simple cut-out diagram of the AquaFlux condenser-chamber from (AquaFlux, Biox systems Ltd)
The condenser controls the absolute humidity in the measurement chamber independently of ambient conditions. It is similar to a vapour sink by forming ice on its surface, thus creating a zone of low humidity in its immediate vicinity. By contrast, the test surface acts as a vapour source, creating a zone of higher humidity in its immediate vicinity. This humidity difference causes water vapour to migrate from source to sink by passive diffusion and creates a diffusion vapour density gradient from which the flux density can be measured (Imhof, R.E. et al, 1999).
Since the size of sample is normally much greater than the measurement orifice, the measurement principles are discussed under one dimension, and the Cartesian coordinate system is used, shown in Figure 2.5.
Figure 2.5 Geometry of 1-D AquaFlux modeling from (Imhof, R.E. et al, 1999)
As mentioned above, the internal space of the measurement chamber is small enough to suffocate natural convection and other bulk air movement. Therefore, diffusion is the only transport mechanism available, so bulk air movement is ignored, and thus, the migration of the water molecules in the chamber can be calculated using Fick’s first law of diffusion:
(2.5)
Where is the water vapour flux density from the sample surface, is the
molecular diffusion coefficient for water vapour in air ( )
at room temperature , and is the water vapour humidity.
VA z H J D J DVA 5 2 2.42 10 / VA D m s 20C H
Chapter 2 Skin Measurement Instruments
Similarly, the temperature transfer is expressed as:
(2.6)
Where is the heat flux density, is the thermal conductivity of air, and is the temperature distribution in the chamber.
Immediately after the vapour enters the chamber from the sample, it will be removed by the condenser. The steady-state vapour distribution is established. The steady-state solution is characterized by the constant water vapour humidity gradient in the chamber, whence the water vapourflux density from the sample surface. Therefore,
(2.7)
In the AquaFlux measurements, the water vapour humidity is calculated using the following equations.
(2.8)
Where is the fractional RH value, is the equilibrium vapour density at
temperature , and is the temperature at position .
Then Eq. (2.8) can be rewritten as:
(2.9) A Q K z Q KA z ( ) ( C) VA C H z H L J D L z ( ) H z ( ) VE( )z H z
VE( ) zz
[ ( ) ( )] VA z VE z C VE C C D J L z Where and are the fractional RH values at z and at the condenser respectively, and are the temperature at position are the temperatures at
z and at the condenser respectively, and and are the
equilibrium vapour densities at z and at the condenser respectively.
Due to the thermodynamic equilibrium between the vapour phase near the condenser and the solid phase at the condenser (ice), at the condenser. The Eq. (2.9) can be simplified as:
(2.10) Some extreme cases of the above equation are important for the AquaFlux
measurements. When , Eq. (2.9) is rewritten as:
(2.11)
Where and are the temperature and the fractional RH value at the RHT sensor respectively, and above equation allows the flux density to be determined
from measurements of, , and .
When z=0, Eq. (2.10) becomes:
(2.12) Where and are the temperature and the fractional RH value at the sample surface. z C z
z
( ) VE z
VE( C) 1 C
[ ( ) ( )] VA z VE z VE C C D J L z S zL [ ( ) ( )] VA S VE S VE C C S D J L L S S S S C 0 0 [ ( ) ( )] VA VE VE C C D J L S SChapter 2 Skin Measurement Instruments
The above equation specifies the microclimate immediately above the sample surface. With J calculated from Eq. (2.11), the fractional RH value at the sample surface can be calculated.
Comparing with other water vapour flux density measurement instruments, such
as Tewameter (Courage + Khazaka Electronic GmbH, Germany),
DelfinVapoMeter (Delfin Technologies, Finland) and Evaporimeter (Cortex Technology ApS, Denmark), AquaFlux has many advantages, for example, high sensitivity, low noise, super reliability, excellent calibration ability and comparability, and above all, the measurement results are independent of external environment. AquaFlux can be used in the following areas (Imhof, R.E. et al 1999): (1) Skin barrier function, skin recovery, skin disease etc., based on TEWL
measurements.
(2) Membrane penetration and permeation. (3) Material absorption/desorption.
2.3 Capacitive Contact Imaging Based on Fingerprint
sensor
The water content within human skin is very important for its cosmetic properties and its barrier functions; however, to measure it is very difficult. There are some disadvantages of the commercial skin hydration measurement devices, such as, poor repeatability, reproducibility and difficult to calibrate. To address these issues, a novel hand-held probe for in-vivo skin hydration imaging using capacitive Fingerprint sensors has been developed by the research group. It is based on capacitance measurement principle of capacitors.
Commonly, a capacitor is used to store (hold) the electrical charge. A capacitor is constructed of two conductive parallel plates separated by a non-conductive
medium or the dielectric region. Assuming that the parallel plates are charged with and that the voltage between the plates is V, the capacitance can be shown as:
(2.13)
The unit of measurement used for measuring capacitance is farad, where 1 farad is equal to 1 coulomb per volt (Xiang, Ou, 2014).
The capacitor stores energy which is equal to the energy required to charge it and thus electrical energy is not dissipated.
If a small element of charge is moved across the two plates against the potential
difference it will require the amount of energy :
(2.14)
This energy fluctuates depending on the interference of the dielectric medium.
Figure 2.6 Two parallel capacitor plates are moved into coplanar position with fringing electric fields (Li Xiaobei, 2002).
Fingerprint sensors are based on the capacitance fringing field measurement principle (Singh, H. 2010). The parallel plates of the capacitor are split to a
Q Q Q C V dq / V q C dW q dW dq V
Chapter 2 Skin Measurement Instruments
coplanar position; the fringing electric field will continue to create a field between the two plates, see Figure 2.6 (Li Xiaobei, 2002).
Each set of a parallel plate is regarded as a cell and each cell in turn contains a feedback capacitance known as a sensor plate. After a side-by-side array of alternating charged and sensor conductor plates are created, the alternating plates form the two plates of the capacitor. Meanwhile, any interference in between the plates causes the dielectric fields to change between the conductor plates. One set of conductor plates makes a single cell whose size is larger than the width of one ridge on the skin. The print image is created when the sensor detects variance in dielectric constants between the two.
Each set of the conductor plates (or cells) contains their own electrical circuit which the electrical circuit creates an inverting operational amplifier that alters the voltage being supplied thus making them tiny groups of semiconductor chips. The altered voltage is connected to the inverting terminal input and the non-inverting terminal input is relative to a reference voltage supply and a feedback loop. This feedback loop is in turn connected to the amplifier output which includes two conductor plates.
The Fingerprint sensor is non-invasive, quick, simple to use, imaging based and is based on latest fingerprint sensor technologies and using well researched mathematical imaging processing algorithms. Compared with thermal sensors, capacitor technology offers better image quality with a wider range of operating conditions. It can measure any part of the body, and generate pixels
black and white skin capacitance images with a special resolution.
In each image, each pixel is represented by an 8 bit greyscale value, 0~255, with 0 represents white (i.e. dry skin - low capacitance) and 255 represents black (i.e. wet skin- high capacitance).
256 300
The prototype of capacitive contact imaging based on Fingerprint sensor shown in Figure 2.7(a) has many functions:
(1) By processing those capacitive skin images using a dedicated software programme with purposely designed mathematical algorithms, we can produce skin hydration images, skin micro relief images and skin 3D surface profile images.
(2) It can also be used for study soft materials.
(3) It can also be used to study solvent membrane penetrations. Apart from water, (4) Fingerprint sensor is also sensitive to many the solvents using in
pharmaceutical studies.
Chapter 2 Skin Measurement Instruments
(b) Epsilon permittivity imaging system.
Figure 2.7 Development of capacitive imaging system.
By using AquaImager software, developed specifically for the Fingerprint Sensor by the research group, the skin site is visualized as shown in Figure 2.7(a). It produces the raw images of the skin site which can be processed by MATLAB programme into grey images. To study the difference between digital image and grey images, the instrument is very important and useful.
Based on the Fingerprint sensor, the new Epsilon permittivity imaging system has been developed (Imhof R. E. and Xiao P., 2012), as shown in Figure 2.7(b). The Epsilon differs from other similar systems in its calibrated, linear response to near-surface dielectric permittivity. The linear response is important because hydration is linearly related to permittivity (Pan. W. et al, 2014).
The calibration ensures consistency from instrument to instrument and from time to time. With calibrated Epsilon imaging systems, we can measure the absolute dielectric permittivity of the material (Zhang. X. et al, 2016).
Epsilon shown in Figure 2.7(b) has many functions:
(1) By processing those images which generated from Epsilon using a dedicated software programme with purposely designed mathematical
algorithms, we can produce skin hydration images, skin micro relief images and skin 3D surface profile images.
(2) It can also be used for study materials.
(3) With Epsilon, we can also study membrane penetration. Apart from water, Epsilon is also sensitive to most the solvents using in pharmaceutical studies.
2.4 Corneometer
The Corneometer measures changes in capacitance using a contacting probe that forms a capacitor with the skin under the test. Since the dielectric permittivity of water is high compared with those of other skin constituents, the hydration of the skin in contact with the probe affects the capacitance sensed by the probe (Courage W, 1994).
The instrument is made up of a hand-held probe and a central processing unit, as shown in Figure 2.8 below (O`Driscol. D., 2000).
Chapter 2 Skin Measurement Instruments
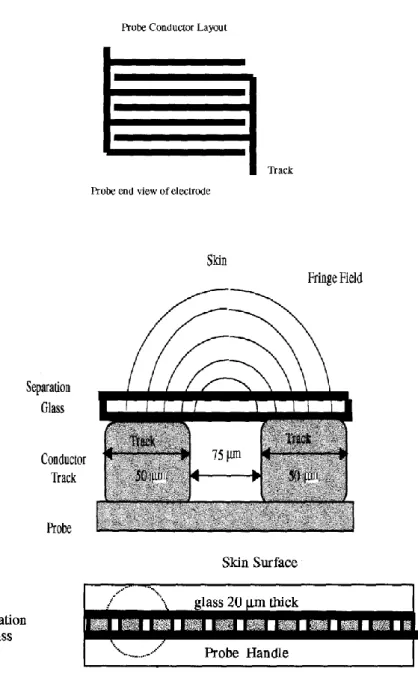
Figure 2.9 Corneometer probe head design conductor track and cross section (reproduced from O`Driscol. D., 2000).
The probe head is made-up of a 7x7-mm size ceramic base with gold-plated conductor lines forming an interlaced grid pattern with spacing of 75 and a surface area of 0.5 . A view of the probe head with a cross section view is shown in Figure 2.9. The conductor tracks are protected by a separation glass where the test skin surface will be in contact. The glass cover is of 20 thickness.
m 2 cm m
Due to the small size and lightweight of the probe, it allows quick measurement and continual measurement important to avoid occlusion, easy handling and cleaning, and measuring on all body sites.
The measurement depth is 10-20μm of the SC, to avoid the influence of dermis layer. Measurements on an only 15μm thick foil show only 20% of the original measurement value. The Corneometer measures in arbitrary units from 0 to 120. The units have been very well established as so called "Corneometer units".
2.5 Digital Camera
For this research, the digital camera used is SONY DSC-W55. The camera has a 7.2 Mega Pixels with 3X optical zoom shown in Figure 2.10.
Figure 2.10 View of the SONY DSC-W55 camera.
In this thesis, the digital images captured by the camera were used for colour image processing.
Chapter 2 Skin Measurement Instruments
2.6 ProScope HR2 Digital Microscope
The view of ProScope HR2 shows in figure 2.11 which has larger pixels that take in more light than other instruments on the market. The Bodelin engineering team customized this imager to allow extensive imaging adjustment and LED intensity control. The most impressive feature is the ability to actually stream true pixels at higher resolutions. The total effect in the ProScope HR2 is live video that appears to be 4 to 5 megapixels in clarity while only using an actual 2 megapixel imager. The ProScope products are currently used in tens of thousands of schools, universities, law enforcement forensic labs, manufacturing quality control, medical and tele-medicine since 2001. The model used in this study uses an optical lens of 30x zoom with cross polarized light that can take images from both skin surface and underneath the skin surface.
(http://www.bodelin.com/proscope/proscope-hr2)
Figure 2.11 View of ProScopeHR2 digital microscope.
In this thesis, to figure out the difference between colour image processing and grey image processing, the images taken from the ProScope HR2 are compared with Fingerprint sensor.
2.7 Summary
In summary, all the skin measurement instruments which were used in the thesis are discussed in this chapter. It has to be admitted that although all of them have great performance in skin in-vivo measurement, there are some weakness by their own.
OTTER is an infrared remote sensing technique for the Non-Destructive Examination (NDE) of sample surfaces, through their optical and thermal properties. It has advantages such as non-contact, non-invasive, work on arbitrary surfaces, in-sensitive to colour and small movements. However, due to the large size of the laser and cooling system, OTTER is not a portable instrument.
AquaFlux is a novel technology for measuring water vapour flux density from arbitrary surfaces. The closed chamber design perfectly cuts off the external facts and occlusion which influence the TEWL result on the experimental skin site. It allows quick measurement and continual measurement, easy handling, and measuring on all body sites. It is an excellent instrument of TEWL measurement with better repeatability and better precision.
Capacitive contact imaging based on Fingerprint sensor is a novel fringing field capacitive imaging technique, which can be used for skin hydration measurements. It is a quick measuring, high resolution imaging, easy handling and cleaning, and visual imaging tool for skin in-vivo measurements. It produces the raw images of the skin site which can be processed by MATLAB programme into grey images in order to figure out the difference between digital image and grey images. The only weakness is that the occlusion of skin site highly affects the skin hydration during the measurement.
Chapter 2 Skin Measurement Instruments
Corneometer is made up of a hand-held probe and a central processing unit. Due to the small size of the probe, it allows quick measurement and continual measurement easy to avoid occlusion and measuring on all body sites. The Corneometer measures in arbitrary units from 0 to 120 in a small area 7x7-mm. It is not suitable for measuring the large skin sites because of the limited size of the probe head.
Digital camera and ProScope HR2 microscope were used for capturing digital images. ProScope is preferred to measure the images by the 30x zoomed camera for comparing with the raw images from Fingerprint sensor.
Chapter 3 Skin Image Processing using
MATLAB
Image processing is very important in our skin research, as several skin imaging techniques are used in our group, such as the digital camera, ProScope HR2 digital microscope, and the latest capacitive contact imaging. This chapter first gives an overview of the imaging processing techniques and the MATLAB software, then describes the image processing work carried out in this project using MATLAB software.
MATLAB (MATrix LABoratory) is a multi-paradigm numerical computing environment and fourth-generation programming language. A proprietary programming language developed by MathWorks, MATLAB allows.
(1) Math and computation (2) Algorithm development
(3) Modelling, simulation, and prototyping (4) Data analysis, exploration, and visualization (5) Scientific and engineering graphics
(6) Application development, including Graphical User Interface building.
In computer science, a graphical user interface (GUI), is a type of user interface that allows users to interact with electronic devices through graphical icons and visual indicators such as secondary notation, instead of text-based user interfaces, typed command labels or text navigation. Its goal is to allow users implement MATLAB functions without learning any programming skills.
There are the techniques in the GUI programme presented in this thesis for image processing including:
Chapter 3 Skin Image Processing using MATLAB
(1) Noise generator: Gaussian constant, Poisson, salt&pepper, speckle. (2) Noise filters: Gaussian, average, median, unsharp, motion.
(3) Equalization: RGB components, contrast, brightness.
(4) Digital image processing: RGB components separating, image converting, image enhancing, image 3-D plot.
(5) Edge detection: Canny, Sobel, log, Prewitt, Roberts.
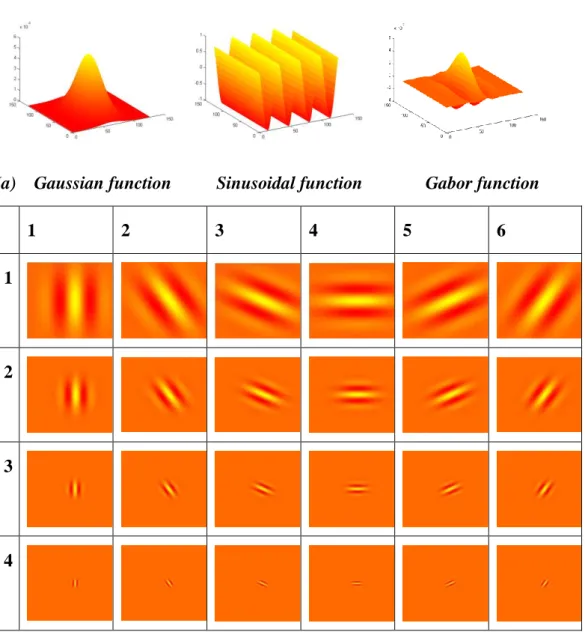
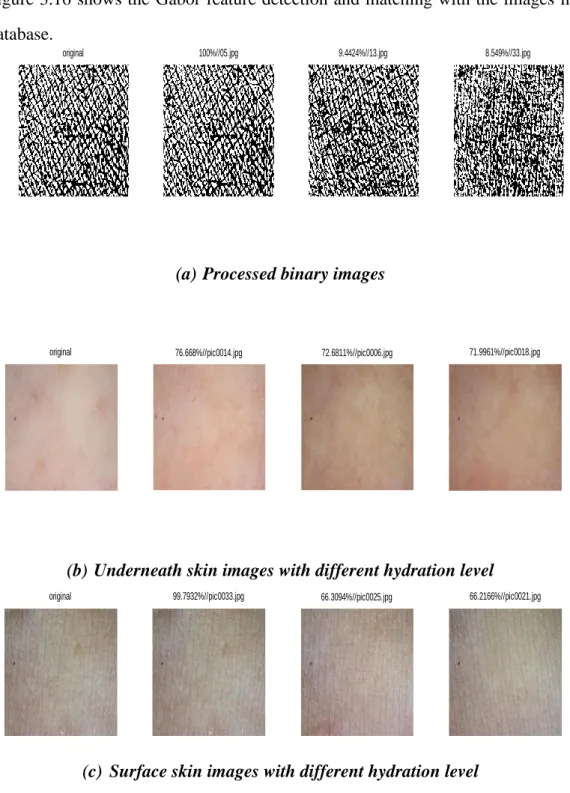
(6) Feature enhancement: Gabor feature detection and matching, dilation and erosion.
All of the functions above can be used on any types of the images.
3.1 Image processing Techniques
In imaging science, the image processing is processing of images using mathematical operations by using any form of signal processing for which the input is an image, a series of images, or a video, such as a photograph or video frame; the output of image processing may be either an image or a set of characteristics or parameters related to the image (Rafael C et.al.2008).
3.1.1 Filters
In image processing, filtering is a process that removes some unwanted components or features from the images such as background, brightness, fog and smoke etc.
To achieve this, relevant filter functions have been added to the GUI programme. The images also need to be processed into numerical or matrix. It is well known that the Fourier transform has been the most commonly used tool for analysing frequency properties of a given signal. However, it has some limitations, where the information about time is lost.
In mathematics, a wavelet series is a representation of a square-integrable (real- or complex-valued) function by a certain or thonormal series generated by a wavelet. Nowadays, wavelet transformation is one of the most popular of the time-frequency-transformations.
Wavelet transform could extract both the time (spatial) and frequency information from a given signal, and the tuneable kernel size results in different time-frequency resolution pairs. In other words, the image can be seen under the lens with a magnification given by the scale of a wavelet. This great character also makes wavelet transform suitable for applications such as image edge detection, filter