Interaction of XMAP215 with a
microtubule plus-end studied
with optical tweezers
Dissertation
zur Erlangung des akademischen Grades Doctor rerum naturalium
(Dr. rer. nat.)
vorgelegt
der Fakult¨at Mathematik und Naturwissenschaften der Technischen Universit¨at Dresden
von
Anastasiya V. Trushko
geboren am 28. April 1984in Minsk, Weißrussland
Interaction of XMAP215 with a Microtubule Plus-end Studied with Optical Tweezers Anastasiya Trushko, PhD thesis, TU-Dresden, December 2011.
Supervisors:
Prof. Dr. Jonathon Howard
Max Planck Institute of Molecular Cell Biology and Genetics (MPI-CBG) Pfotenhauerstrasse 108, 01307 Dresden, Germany
Dr. Erik Sch¨affer
Nanomechanics group, Biotechnology Center (BIOTEC),TU-Dresden Tatzberg 47-51, 01307 Dresden, Germany
Thesis Advisory Committee:
Prof. Dr. Petra Schwille
Biotechnology Center (BIOTEC),TU-Dresden Tatzberg 47-51, 01307 Dresden, Germany
Dr. Iva Tolic-Norrelykke
Max Planck Institute of Molecular Cell Biology and Genetics (MPI-CBG) Pfotenhauerstrasse 108, 01307 Dresden, Germany
This thesis was reviewed by:
Prof. Dr. Jonathon Howard Prof. Dr. Robert Cross
The work described in this thesis was performed at Prof. Dr. Jonathon Howard group, Max Planck Institute of Molecular Cell Biology and Genetics, Pfoten-hauerstrasse 108, 01307 Dresden, Germany
The author was enrolled in Technical University of Dresden
The author was enrolled in the PhD program of Dresden International Graduate School for Biomedicine and Bioengineering.
Abstract
Microtubules are a part of the cell cytoskeleton that performs different functions, such as providing the mechanical support for the shape of a cell, acting as tracks along which the motor protein move organelles from one part of the cell to another, or the form-ing mitotic spindle durform-ing the cell division. The microtubules are dynamic structures, namely they can grow and shrink. The phase of microtubule growth alternates with the phase of shrinkage that results in the dynamic microtubule network in the cell. However, to form stable and spatially well-defined structures, such as a mitotic spindle, the cell needs to control this stochastic process. This is done by microtubule associated proteins (MAPs). One class of MAPs is the proteins of XMAP216/Dis1 family, which are micro-tubule polymerases. The founding member of this family is X. laevis XMAP215. XMAP215 is a processive polymerase acting on the microtubule plus end. XMAP215 binds either directly or reaches the microtubule plus end by the diffusion along the microtubule lattice. Being at the microtubule plus-end XMAP215 stays there tran-siently and helps to incorporate up to 25 tubulin dimers into microtubule lattice before it dissociates and, therefore, it processively tracks the growing microtubule end dur-ing polymerization. There are two hypothesis of microtubule assembly promotion: (i) XMAP215 repeatedly releases an associated tubulin dimer into the microtubule growing plus end or (ii) structurally stabilizes a polymerized tubulin intermediate at the growing plus end and, therefore, preventing depolymerization events. The first way results into the increase of on-rate of tubulin dimers at the microtubule end, whereas the second way results into the decrease of off-rate of tubulin dimers at the microtubule end. Here, I show the study of the mechanism of microtubule growth acceleration by XMAP215 and the dependence of XMAP215 polymerization activity on the applied force. To answer these questions, I investigated the addition of tubulin dimers to the plus end of the mi-crotubule by XMAP215 and how this addition depends on the applied force. XMAP215 remains at the microtubule end for several rounds of tubulin addition surfing both grow-ing and shrinkgrow-ing microtubule ends. Therefore, if one could track the position of the XMAP215 molecules at the very tip of a microtubule with sufficient resolution, it would provide the information about the dynamics of the microtubule end. The technique, which can detect the position of the object of interest with high spatial and temporal resolution in addition to being able to exert a force, is an optical trap. A calibrated optical trap not only provides a good measure of displacement but also enables force measurements. To monitor the position of the molecules of interest, the molecules of interest are usually attached to a microsphere. Hence, I tethered XMAP215 to a mi-crosphere held by an optical trap, and used XMAP215 as a handle to interact with the microtubule tip. When the microtubule grows, the XMAP215 coated microsphere will move in the optical trap and this movement can be detected with high temporal and spatial resolution.
My work demonstrates that cooperatively working XMAP215 molecules can not only polymerize microtubule but also harness the energy of microtubule polymerization or depolymerization to transport some cargo. There is an evidence that orthologues of XMAP215 in budding yeasts, fission yeasts andDrosophila localize on the kinetochores. Therefore, the ability of the bearing some load during microtubule polymerization could be potentially important for the XMAP215 functioning during cell division.
I also showed the influence of external force applied to the XMAP215 molecules. Point-ing toward microtubule growth, a force of 0.5 pN applied to the microtubule tip-coupled XMAP215-coated microsphere increases XMAP215 polymerization activity. However, the force of the same magnitude but applied against microtubule growth does not af-fect XMAP215 polymerization activity. This result can be explained by the fact, that the force acting in the direction of microtubule growth constrains XMAP215 to be at the very microtubule tip. Hence, XMAP215 can not diffuse away from plus-end and there is higher chance to incorporate tubulin dimers into the microtubule plus-end. The on- and off-rate of tubulin dimers at the microtubule end are both decreased when the external force applied either in direction of microtubule growth or opposite to it. The external force affects the off-rate slightly stronger than on-rate of tubulin dimer. Taking together, my study gives new insights into the mechanism of microtubule polymerization by XMAP215 and show some novel properties of this protein.
Contents
1 Introduction 5
1.1 Microtubules form different cellular structures to perform their functions
in a cell . . . 5
1.2 Microtubule Structure and Dynamics . . . 5
1.2.1 Microtubules are Polymers Consisting of Tubulin Dimers . . . 5
1.2.2 Microtubules are Dynamic Structures . . . 6
1.2.3 Microtubule dynamic instability is coupled to the GTP hydrolysis 7 1.2.4 Dynamic microtubules exert forces and move the cellular structures 7 1.3 Factors Regulating Microtubule Dynamics . . . 9
1.3.1 Microtubule Disassembly Promoters . . . 10
1.3.2 Microtubule Stabilizers . . . 11
1.3.3 Microtubule Assembly Promoters . . . 11
1.4 XMAP215/Dis1 proteins catalyze microtubule growth . . . 12
1.5 Motivation of my PhD Thesis . . . 15
2 Protein expression, purification and labeling 17 2.1 Tubulin Purification and Labeling . . . 17
2.1.1 Purification of Tubulin from Porcine Brain . . . 17
2.1.2 Cycling of Purified Tubulin . . . 17
2.1.3 Labeling PC-Tubulin with TAMRA . . . 19
2.2 XMAP215 Expression and Purification . . . 22
2.2.1 Over-expression System for XMAP215 Tagged with GFP and His7 22 2.2.2 Purification of Recombinant Protein XMAP215 Tagged with GFP and His7. . . 22
3 Optical Tweezers 25 3.1 Theoretical Background of Optical Trapping. . . 25
3.2 Optical trap: a Hookean spring in three dimensions . . . 27
3.3 Optical tweezers is a tool to apply piconewton forces and detect nanometer displacement . . . 27
3.4 Optical tweezers setup used for the DIC imaging and the experiment with stationary optical trap . . . 28
3.5 Optical tweezers setup used for the experiment with a force feedback . . 28 3
3.6 Calibration of Optical Tweezers . . . 29
3.7 Force feedback . . . 31
3.7.1 PID controller method. . . 31
3.7.2 Tuning the feedback parameters. . . 32
4 Experimental setup and conditions 34 4.1 Coupling XMAP215-GFP-His7 to Polystyrene Microspheres . . . 34
4.1.1 Covalent Binding of PEG Molecules and GFP Antibodies to the Surface of a Polystyrene Microsphere . . . 34
4.1.2 Concentration Measurements of the XMAP215-coated Microspheres 38 4.2 In vitro reconstitution of the interaction of dynamic microtubules with XMAP215 molecules . . . 38
4.2.1 Treatment of the Cover-glasses . . . 38
4.2.2 Chamber Preparation . . . 39
4.2.3 Growing GMPCPP Stabilized Rhodamine labeled Microtubules . . 40
4.2.4 Dynamic Microtubule Assay. . . 40
5 Results 42 5.1 XMAP215 harnesses microtubule growth and shrinkage energy to move a cargo . . . 42
5.2 XMAP215 molecules coupled to the polystyrene bead facilitate micro-tubule growth . . . 45
5.3 Being under load, XMAP215 molecules are able to harness microtubule energy of polymerization and depolymerization . . . 49
5.4 The force, applied towards microtubule growth, assists microtubule poly-merization . . . 50
5.5 The force, applied in the direction of microtubule growth, decreases both the on-rate and off-rate of tubulin dimers at the microtubule end . . . 53
5.6 A force opposing microtubule growth, does not affect microtubule poly-merization rate . . . 56
5.7 A force opposing microtubule growth decreased both the on-rate and off-rate of tubulin dimers at the microtubule end . . . 57
6 Discussion, Conclusions and Outlook 59
Glossary 65
List of Figures 68
List of Tables 69
Chapter 1
Introduction
1.1
Microtubules form different cellular structures to
per-form their functions in a cell
Microtubules are a part of the eukaryotic cytoskeleton. They are long polymers in a shape of hollow tubes, which form different structures in the cell. In the animal cell mi-crotubules grow out of an organizing center, thecentrosome. When a cell does not divide the microtubules form a network, which provides anchoring for the organelles in certain cell regions and also serves as a system of tracks for the intracellular trafficking. These microtubules can assemble and disassemble quickly to rearrange the whole microtubule network. When the cell starts to divide the microtubules are reorganized into a special structure called the mitotic spindle, which pulls apart the chromosomes and segregates them equally into two daughter cells. Microtubules can form also stable structures such as cilia and flagella. These appear on the cell surface as hair-like structures that beat rhythmically. They serve for the movement of the cells or sweeping fluid over the cell surface.
1.2
Microtubule Structure and Dynamics
As it was mentioned above, microtubules are involved in a variety of cellular processes. To fulfill these rather different functions the microtubule network, also called the mi-crotubule cytoskeleton, has to be able to rearrange itself in size and shape. Moreover, this has to happen over a short time. To understand how this microtubule network rearrangement occurs, one needs to understand the structure and properties of a single microtubule.
1.2.1 Microtubules are Polymers Consisting of Tubulin Dimers
Microtubules are polymers consisting of tubulin heterodimers. The tubulin heterodimers consist of globular α- and β-tubulin subunits (Fig.1.1 (A)). They have the molecular mass of ∼ 100 kDa and are 8 nm long. The microtubules assemble by addition of the
CHAPTER 1. INTRODUCTION 6
+
End
-
End
β αTubulin dimer
Protofilament
8nm 25nmMicrotubule
B
A
C
Figure 1.1: Microtubule structure. A.Tubulin dimer consist ofα- andβ- tubulin subunits. B.Tubulin dimers are sticking to each other in the head-to-tail manner and form a protofilament. Because of such arrangement of tubulin dimers, each protofila-ment has a polarity: one end capped byα- tubulin and other byβ- tubulin subunit. C. The cylindrical and helical microtubule wall typically is formed by 13 parallel protofil-aments. Because of the parallel arrangement the whole microtubule has a polarity: at one endα- tubulin subunits are exposed and at otherβ- tubulin subunits.
αβ-tubulin heterodimers at either end and disassemble by loss of them. The tubulin dimers stick to each other in a head-to-tail manner and form a protofilament (Fig.1.1
(B)). Because of such an arrangement of tubulin dimers, the whole protofilament has a polarity: at one end theα- tubulin subunit is exposed and at the other theβ- tubulin subunit. The protofilaments form the wall of the microtubule. The number of the protofilaments in the microtubule wall varies from 10 to 15, but the most common number in the cell is 13, which sets the microtubule diameter to 25 nm (Fig.1.1 (C)). All protofilaments are oriented in the same fashion in the microtubule wall. This gives the polarity to the whole microtubules with one end capped with α-tubulin subunits and the other end with β-tubulin subunits. The latter end grows faster in vitro and is named plus end, the other, slower growing, is the minus end. In the animal cell, the microtubule minus ends are embedded into organizing center calledcentrosome and the plus ends are exposed to the cytosol. In yeasts, the assembling structure is the spindle pole body.
1.2.2 Microtubules are Dynamic Structures
Microtubules are dynamic structures. In vivothey grow slowly and then abruptly shrink quickly. The phase of growth alternates with the phase of shrinkage continuously. This behavior is calleddynamic instability [84]. The switch between the microtubule growth
7 1.2. MICROTUBULE STRUCTURE AND DYNAMICS
to the shrinkage is called a catastrophe event and the switch between the microtubule shrinkage back to the growth is a rescue event (Fig.1.2(B)).
1.2.3 Microtubule dynamic instability is coupled to the GTP
hydrol-ysis
Dynamic instability arises from the intrinsic property of the tubulin protein and it can be easily reconstituted in vitro by mixing guanosine triphosphate (GTP) nucleotide and tubulin molecules in the presence of the nucleating centers. The dynamic instability is a result of the capability of tubulin dimers to hydrolyze GTP to guanosine diphosphate (GDP).
Each α- and β-tubulin monomer binds one GTP nucleotide. The one bound to the
α-tubulin is positioned at the interface ofα-β monomers and is non-exchangeable and non-hydrolyzable. The other, bound to the β- tubulin, is accessible for hydrolysis and can be exchanged. The GTPase activity of a free tubulin dimer is very low, but it can be stimulated by binding to other tubulin dimers. When another tubulin dimer is bound, the necessary residues for the hydrolysis are provided by the new α-tubulin subunit and the exposed GTP nucleotide on theβ-tubulin surface is hydrolyzed to the GDP. Therefore, when a microtubule is built up by the tubulin dimers binding at either of its end, most of the tubulin dimers contain GDP. Only the tubulin dimers at the leading edge of the microtubule have still GTP nucleotides. If the addition of tubu-lin dimers to the microtubule end is faster then the GTP hydrolysis rate, the layer of the GTP containing tubulin dimers will grow, forming a so-calledGTP cap(Fig.1.2(B)). The hydrolysis of GTP affects the structure of the tubulin dimer. The tubulin dimer containing the GDP nucleotide experiences a mechanical strain that leads to a kink in the α-β- tubulin interface, when the GTP containing tubulin dimer remains straight (Fig.1.2 (A)). This change in tubulin dimer structure, in turn, gives the curved shape to the whole protofilament. In the microtubule lattice, however, the protofilaments are forced to be straight by the lateral bonds between them. And they are additionally stabilized by the GTP cap. When the GTP cap is lost because of the hydrolysis or other depolymerizing factors, the protofilaments start to curve at the ends and the microtubule undergoes depolymerization releasing the stored energy of mechanical strain.
1.2.4 Dynamic microtubules exert forces and move the cellular
struc-tures
Due to the dynamic instability of the microtubules a cell can quickly rearrange its mi-crotubule network. This is crucial for the formation of differently, spatially organized structures from the same tubulin pool. Furthermore, rapidly assembling and disas-sembling microtubules can perform a three-dimensional search in the cytosol, which is important, for example, for the kinetochore capturing of the chromosomes by the mi-crotubule plus tips during the cell division. When interacting with cellular structures,
CHAPTER 1. INTRODUCTION 8
catastrophe
rescue
gr
owth
shr
ink
age
assembly
disassembly
GTP
GDP
Pi
GTP
tubulin
α
α
GDP
tubulin
β
β
A
B
GTP cap
Figure 1.2: Microtubule assembly and disassembly. A.Conformational change of tubulin dimer accompanying GTP hydrolysis. B. Microtubule dynamic instability. Polymerization is typically initiated from the pool of GTP-containing tubulin. Many GTP-tubulin dimers encounter the growing microtubule tip, however, only a small frac-tion of them are incorporated into the microtubule wall. Shortly after incorporafrac-tion, the GTP of a β-tubulin subunit gets hydrolyzed to GDP. This induces a kink in the tubulin dimer. Because the tubulin dimers are aligned in the protofilament, the lat-ter will also get curled if the containing tubulin dimers have bound GDP. However, the protofilaments are forced to be straight in the microtubule wall and additionally stabilized by the GTP cap. During microtubule assembly, microtubule plus-ends form a sheet-like structure [30][75]. Once the GTP cap is lost the protofilaments peel off and the microtubule undergoes a catastrophe, releasing GDP-tubulin dimers. The assembly-disassembly cycle is completed by exchanging GDP of the disassembly prod-ucts with GTP.
9 1.3. FACTORS REGULATING MICROTUBULE DYNAMICS
the dynamic microtubules can exert forces, pushing when they assemble and pulling when they disassemble (rev. [54, 39]). Because of these forces, microtubules can move cellular structures inside the cell if the attachments is maintained during their growth and shrinkage. In such a way, during the cell division, after establishing the chromosome attachments to the microtubule tips via the kinetochores, the chromosomes are moved either towards or away from the spindle pole, following the shrinking or growing micro-tubule tip respectively [31,58].
Other examples are the movement of the nucleus or the mitotic spindle because of the interaction of the microtubules and the cell cortex. Thus, for example, in the fission yeast S. pombe, microtubules attach to the nucleus via spindle pole bodies. They grow against the cell cortex and exert pushing forces on the nucleus from both sides and center it [117,34]. In budding yeasts S. cerevisiae, after the formation of the mitotic spindle, the microtubules grow out of the spindle poles and enter the bud. Upon attachment to the bud cortex the microtubule start to depolymerize maintaining attachment and pull the mitotic spindle towards the bud. Because of these pulling forces, the mitotic spindle is properly centered between the mother and daughter cell [71,129].
In vitro studies with purified tubulin confirmed that the polymerizing and depolymer-izing microtubule end can exert pushing and pulling forces, respectively [37,72]. Thus, the assembling microtubules can deform the membranes or induce microtubule buckling. And the disassembling or assembling microtubule tip can move a microsphere attached to it [49,10,96,41].
1.3
Factors Regulating Microtubule Dynamics
Due to the dynamic instability, a cell can quickly rearrange its microtubule network. However, the dynamic instability is a stochastic process, and to form stable and spa-tially well-defined structures, such as a mitotic spindle, the cell needs to tightly regulate both the microtubule assembly and their disassembly. This regulation is done by micro-tubule associated proteins (MAPs) that falls into several classes: micromicro-tubule assembly promoters, disassembly promoters, and stabilizers [55,1,4].
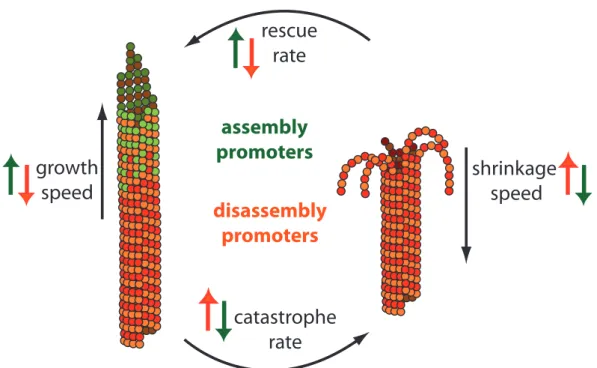
Microtubule dynamic instability can be characterized by four parameters: microtubule growth speed, microtubule shrinkage speed, frequency of the rescue events, also called rescue rate, and frequency of the catastrophe events, catastrophe rate. Most of the MAPs that modulate microtubule dynamics alter one or several of these parameters. Thus, the assembly promoting factors may suppress microtubule catastrophes or favor microtubule rescues, increase growth speed and decrease shrinkage speed. The micro-tubule destabilizing factors, on the contrary, may decrease growth speed and increase shrinkage speed, as well as facilitate catastrophes and prevent rescues events (Fig.1.3).
CHAPTER 1. INTRODUCTION 10
catastrophe
rate
rescue
rate
shrinkage
speed
assembly
promoters
disassembly
promoters
growth
speed
Figure 1.3: Microtubule Dynamic Instability is regulated by assembly and disassembly promoters. The microtubule dynamic instability can be described by four parameters: growth speed, shrinkage speed, catastrophe rate and rescue rate. Assembly promoters suppress microtubule catastrophes and decrease shrinkage speed (denoted by green arrows pointing downwards), favor microtubule rescues and increase growth speed (denoted by green arrows pointing upwards). Disassembly promoters decrease growth speed and prevent rescue events (denoted by orange arrows pointing downwards), and increase shrinkage speed, as well as facilitate catastrophes (denoted by orange arrows pointing upwards).
1.3.1 Microtubule Disassembly Promoters
In opposition to the assembly promoters, microtubule disassembly promoters induce mi-crotubule catastrophes, promote disassembly, and inhibit depolymerization. They are represented by proteins of kinesin-8, kinesin-13, kinesin-14, and Op18/Stathmin families. The kinesin-8 motors are depolymerases destabilizing microtubules exclusively from the microtubule plus-end [50, 121], whereas proteins of the kinesin-13 family destabilize microtubules from both plus-end and minus-end [52, 35, 82, 128, 85]. The kinesin-8 proteins reach the plus-end by directed movement along the microtubule lattice powered by adenosine triphosphate (ATP) hydrolysis. Once at the microtubule plus-end, kinesin-8 proteins depolymerize the microtubules in a length-dependent manner [121, 114]. Kinesin-13 proteins get to the microtubule ends by one-dimensional diffusion over the microtubule lattice [52]. However, kinesin-13 needs ATP hydrolysis to curl out the
mi-11 1.3. FACTORS REGULATING MICROTUBULE DYNAMICS
crotubule protofilaments and induce their depolymerization [57,42, 91]. Some proteins of the kinesin-14 family, S. cerevisiae Kar3, D. melanogaster Ncd, and S. pombe Klp2, have depolymerization activity, however, it remains unclear whether the depolymeriza-tion activity is conserved for all family members [109,118].
In contrast to kinesins, the proteins of the Op18/Stathmin family do not use the energy of ATP hydrolysis to induce microtubule catastrophes. Stathmin, the founding member of the family, promotes microtubule depolymerization in two ways. One is by sequestra-tion of tubulin via binding to it and forming a complex that is not able to bind to the microtubule end [62, 15,33,73,110, 98]. The second way is the direct binding to the microtubule plus-end and kinking the tubulin dimer at the microtubule tip; this makes the microtubule undergo catastrophe [15,56,126,81].
1.3.2 Microtubule Stabilizers
Microtubule stabilizers are represented by proteins of the MAP1, MAP2/Tau and Dou-blecortin families. These proteins are mainly expressed in neurons where long stable microtubules are essential for proper neuronal functions. The proteins of these families do not interact with the microtubule plus-end, but rather bind along the microtubule lattice. The MAP1 and MAP2/Tau proteins are known to stabilize microtubules and reduce their depolymerization rate by binding along the microtubule lattice and rein-force longitudinal bonds between tubulin dimers [120, 97, 66, 26]. Doublecortin favors 13-protofilament microtubules and binds between the protofilaments stabilizing the lon-gitudinal bonds between tubulin dimers [86]. It decreases catastrophe rate, although it does not affect microtubule growth rate [86,87].
1.3.3 Microtubule Assembly Promoters
Microtubule assembly promoters are represented by XMAP215/Dis1 proteins, end bind-ing proteins (EBs), cytoplasmic linker proteins (CLIPs), Cytoplasmic linker associated proteins (CLASPs), and adenomatous polyposis coli (APC). All these proteins prefer-entially localize at microtubule plus-end. Because of this ability, they are also called
+TIPs. Associated with the plus-end, all these proteins modulate different parameters of the microtubule growth to promote the microtubule assembly.
For example, XMAP215/Dis1 proteins are shown to increase the microtubule growth rate, whereas EBs mainly function as a platform for binding other MAPs modulating microtubule dynamic instability such as APC, kinesin-13 (MCAK), CLIPs, CLASPs and etc [3,61]. There is some evidence that EBs also inhibit catastrophes, promote rescues, and stimulate the microtubule growth rate on its own. However, the results of studies of EB modulation of microtubule dynamics directly are controversial and vary between different experimental systems. InSaccharomyces cerevisiae and in culturedDrosophila
CHAPTER 1. INTRODUCTION 12
EB1 stimulates microtubule growth, facilitates rescues and inhibits catastrophes [112]. In Schizosaccharomyces pombe, EB1 also inhibits catastrophes and promotes the initi-ation of microtubule growth [24]. However, in vitro studies of EB1and Mal3 effect on microtubule dynamics polymerized from purified tubulin suggest that these proteins fa-cilitate not only rescues but also catastrophes [17,122], although anotherin vitrostudies of microtubule dynamics showed catastrophe suppression by EB1 [80] and no effect of EB1 on the catastrophes was observed in [36].
CLIPs are thought to be factors promoting microtubule rescues. CLIPs localize dur-ing interphase at microtubule plus tips [95] and on microtubule lattice in ”patches” [99] and during prometaphase at the kinetochores [38]. In vivo in fission yeast [23] and in budding yeast [16], as well as in mammals [70] CLIPs were shown to be the factors pro-moting microtubule rescues. In vitro studies of interaction of dimeric head domain of CLIP170 with dynamic microtubules grown from purified tubulin shows the microtubule rescues promotion [9].
CLASPs not only promote rescues, but also suppress catastrophes and stabilize micro-tubules [78,79,59,83,19]. They are recruited to the microtubule plus end by binding to the +TIP proteins EBs and CLIP170 [2,83]. In vitrostudies of the fission yeast CLASP, Cls1p, showed that it decreases the frequency of microtubule catastrophes and increases the frequency of microtubule rescues [7]. Cls1p diffuses on the microtubule lattice but can not track the microtubule growing plus end. The microtubule rescue occurs at sites of an accumulation of Cls1p molecules [7].
APC was reported to stabilize microtubules, increase the time of their growth and de-crease their shortening time, shrinkage rate and catastrophe frequency [68,88,89]. It is a +TIP protein. In interphase it accumulates at the microtubule plus-end as round clusters [90], whereas during mitosis APC localizes to chromosomes at kinetochore-microtubule attachment sites [40,63,48]. APC interacts with EB1 that facilitates APC localization on the growing microtubule plus-end (Su 1995), although APC can bind to the micro-tubule plus-end directly [107,130].
In the following section I describe the structure, localization, functions and influence on microtubule dynamics of the XMAP215 protein since it is the protein of my study.
1.4
XMAP215/Dis1 proteins catalyze microtubule growth
Family members. XMAP215/Dis1 proteins promote microtubule assembly by in-creasing microtubule growth speed. The members of this family include H. sapiens
chTOG [29],D. melanogaster Msps [32],C. elegans ZYG9,X. laevis XMAP215 [44], A. thaliana MOR1 [124], S. cerevisiae Stu2 [123] and S. pombe Dis1 [100], Alp14 [43].
13 1.4. XMAP215/DIS1 PROTEINS CATALYZE MICROTUBULE GROWTH
Localization and functions in vivo. The proteins of XMAP215/Dis1 family local-ize at the microtubule plus ends and to varying degrees along the microtubule lattice, centrosomes, and kinetochores. The loss of functions of this protein in a cell leads to short interphase microtubules because of their reduced growth speed and increased fre-quencies of catastrophe and pause events [43,32,123,116,21,64]. In mitotic cells, the disruption of the XMAP215/Dis1 protein function leads to small, abnormally organized mitotic spindles and short astral microtubules [32, 47, 28]. At the kinetochores, these proteins are required for the regulation of the attachment of microtubule to the kine-tochores [43,111]. In budding yeasts, Stu2 mediates formation of microtubules at the kinetochores, which are attached afterwards to the mitotic spindle [69]. This facilitates correct attachment of the chromosomes. At the centrosome in D. melanogaster [74],X. laevis [67], and C. elegans [14], XMAP215/Dis1 proteins are shown to interact with transforming acidic coiled-coil (TACC) proteins and increase the number and the length of the centrosomal microtubules during mitosis. However, it remains unclear whether XMAP215/Dis1 proteins act at the centrosomes as microtubule plus end polymerases or have other functions at the microtubule minus end.
XMAP215 is a processive polymerase. The first identified member of this fam-ily was X. laevis XMAP215 isolated from egg extracts as a growth promoting factor [44]. It was reported that XMAP215 accelerates the microtubule growth rate tenfold [44]. In vitro studies of the interaction of recombinant XMAP215 with purified tubulin showed that oligomers of tubulin are added to the growing plus end of the microtubule both in the presence and absence of XMAP215 [65]. They used an optical trap that held a microsphere attached to a microtubule. The plus end of the microtubule grew against a solid substrate. The growing microtubule pushed the microsphere from the focus of the optical trap. A weakness of the experiment was that the temporal resolu-tion in their experiments was low (25 Hz). Scheck et al. [104] used a similar assay but without the presence of XMAP215. In their experiments, the temporal resolution was higher (5 kHz). They saw no evidence for individual steps that correspond to addition of oligomers. Thus, they argued that the Kerssemakers [65] length variation was not due to a small number of large steps but due to a large number of fast small steps. These fast steps were below the resolution limit with respect to both time and position, which was 10 nm in these experiments. Kerssemakers et al. additionally saw an increase in microtubule growth steps in the presence of XMAP215. They interpreted this as an evidence for a shuttle model. In this model, each XMAP215 chaperons several tubulin dimers to the microtubule end. Slep and Vale proposed a similar model [106].
Evidence from Brouhard et al. [22], however, shows that this model cannot be correct: (i) XMAP215 only binds one tubulin dimer both in solution (by ultracentrifugation and gel filtration studies) and on the microtubule lattice under growth conditions (by single molecule experiments). (ii) The rate of XMAP215 binding to ends is too slow to account for the high growth rates even if it brought several tubulin dimers with it each time it bound to the end. (iii) XMAP215 remains at the end for too long - a shuttle must
CHAPTER 1. INTRODUCTION 14
rapidly deposit its cargo before going back for more.
Based on their experimental data, Brouhard et al. proposed that XMAP215 is a proces-sive polymerase acting on the microtubule plus end. XMAP215 binds it either directly or reaches the microtubule plus end by the diffusion along the microtubule lattice. Once at the microtubule plus end, XMAP215 stays there transiently and helps to incorporate 25 tubulin dimers into the microtubule lattice before it dissociates and, therefore, it processively tracks the growing microtubule end during polymerization. XMAP215 can promote microtubule assembly either (i) by repeated addition of a tubulin dimer into the microtubule growing plus end or (ii) by structural stabilization of a polymerized tubulin intermediate at the growing plus end and, therefore, prevention of depolymer-ization events. This model was also recently confirmed by structural analysis ofXenopus
XMAP215 [125].
XMAP215 also tracks the depolymerizing microtubule end. It was shown in vitro that XMAP215 and Stu2 can catalyze the reverse reaction, namely the microtubule depoly-merization, at low concentration of tubulin protein added to the GMPCPP-stabilized microtubule seeds [22,20]. Therefore, XMAP215 and its orthologs are catalysts, which act either as polymerases or depolymerases depending on which reaction direction the experimental conditions favor. However, it remains unclear whether all the members of the XMAP215/Dis1 family are polymerases or have other functions.
Structure of XMAP215/Dis1 proteins. The hallmark of XMAP215/Dis1 family is tumor overexpressed gene (TOG) domains [8, 6]. Depending on the species, the or-thologs of this family have different number of TOG domains. For example, Xenopus
XMAP215, as well as fly Msps, human chTOG and plant MOR1, is monomeric and has five TOG domains, whereas in C. elegans ZYG9 is also monomeric but has three TOG domains and budding yeast Stu2 and fission yeast Dis1 are dimeric and each monomer has only two TOG domains. The TOG domain contains a highly conserved α-helical fold consisting of six conserved HEAT repeats that form a paddle-like structure [8]. The TOG domains have high affinity to the soluble tubulin dimer and poorly interact with the microtubule lattice [8, 5, 108, 93]. Each monomeric and dimeric XMAP215/Dis1 protein binds one tubulin dimer at a time [22,5]. In case of monomeric proteins, namely XMAP215 (Xl), chTOG (Hs), Msps (Dm), the molecule is flexible [27] and wraps around the outer surface of the tubulin dimer [22], while the dimeric proteins Stu2 (Sc) and Dis1 (Sp) clutch the tubulin dimer between TOG domains of two monomers [5].
Recently, it was shown that TOG domains are essential for theXenopus XMAP215 poly-merization activity [125]. Upon inactivation of high tubulin affinity TOG1 and TOG2 XMAP215 polymerization activity drops by 75%, whereas inactivation of low-affinity TOG3 and TOG4 results in reduction of 25% of polymerization activity. Although an XMAP215 mutant containing only TOG1 and TOG2 is functional, the polymerization activity of this construct is lower than one of the full-length protein, pointing to the fact
15 1.5. MOTIVATION OF MY PHD THESIS
that all XMAP215 TOG domains are necessary for full protein functionality. However, the dimeric yeast proteins Dis1 and Stu2 contain only two pairs of TOG1 and TOG2 domains [119]. A different part of XMAP215 molecule is responsible for the micro-tubule lattice binding and diffusion. For XMAP215, it is the region between TOG4 and TOG5[125]. This region is positively charged and possibly interacts with the E-hooks of the microtubule. It is called S/K-rich domain because it contains the stretches of serine, glycine, and lysine residues [5,6].
1.5
Motivation of my PhD Thesis
Microtubules are a part of the cell cytoskeleton that perform different functions, such as providing the mechanical support for the shape of the cell, acting as tracks along which the motor protein move organelles from one part of the cell to another, or form-ing mitotic spindle durform-ing the cell division. The microtubules are dynamic structures, namely they can grow and shrink. The phase of microtubule growth alternates with the phase of shrinkage that results in the dynamic microtubule network in the cell. However, to form stable and spatially well-defined structures, such as a mitotic spindle, the cell needs to control this stochastic process. This is done by microtubule associated proteins (MAPs). One class of MAPs is the proteins of XMAP215/Dis1 family, which are micro-tubule polymerases. The founding member of this family is X. laevis XMAP215. Based on their experimental data, Brouhard et al. [22] proposed that XMAP215 is a processive polymerase acting on the microtubule plus end. XMAP215 binds either directly or reaches the microtubule plus end by diffusion along the microtubule lattice. While at the microtubule plus end, XMAP215 stays there transiently and helps to incor-porate 25 tubulin dimers into microtubule lattice before it dissociates and, therefore, it processively tracks the growing microtubule end during polymerization. XMAP215 can promote microtubule assembly either (i) by repeated releasing associated tubulin dimer into the microtubule growing plus end or (ii) by structural stabilization of a polymerized tubulin intermediate at the growing plus end and, therefore, preventing depolymeriza-tion events.
The question which I would like to address here is how XMAP215 accelerates micro-tubule growth. Does it increase the on-rate of tubulin dimers, kon, or decrease off-rate kof f? Is the XMAP215 polymerization activity dependent on an applied force? To an-swer these questions, I need to investigate the addition of tubulin dimers to the plus end of the microtubule by XMAP215 and how this addition depends on the applied force. XMAP215 remains at the microtubule end for several rounds of tubulin addition surfing both growing and shrinking microtubule end [22]. Therefore, if one could track the position of the XMAP215 molecules at the very tip of a microtubule with sufficient resolution, it would provide the information about the dynamics of the microtubule end. The technique, which can detect the position of the object of interest with high spatial and temporal resolution in addition to being able to exert a force, is an optical trap. A
CHAPTER 1. INTRODUCTION 16
calibrated optical trap not only provides a good measure of displacement but also enables force measurements. To monitor the position of the molecules of interest, the molecules of interest are usually attached to a microsphere. Hence, I tethered XMAP215 to a microsphere held by an optical trap, and used XMAP215 as a handle to interact with the microtubule tip. When the microtubule grows, the XMAP215 coated microsphere will move in the optical trap and this movement can be detected with high temporal and spatial resolution.
Chapter 2
Protein expression, purification
and labeling
This chapter provides the description of the procedures of tubulin purification, the labeling with fluorescent dye, as well as the procedures of expression and purification of XMAP215 fused with GFP and His7.
2.1
Tubulin Purification and Labeling
2.1.1 Purification of Tubulin from Porcine Brain
To study the microtubule growth and shrinkage in vitro, one needs to assemble micro-tubules out of purified heterodimericαβ- tubulin to reconstitute dynamic microtubules. For this purpose, purified tubulin from porcine brain is used. The purification protocol consists of homogenization of the brains followed by two steps of clarification of the homogenate and cycles of tubulin polymerization in the presence of GTP, centrifuga-tion, and depolymerization [46]. The idea is that the soluble molecules of heterodimeric tubulin within a certain concentration range form microtubules in the presence of GTP. These assembled microtubules can be spun down using high-speed centrifugation and separated from cell membranes and other non-microtubule-associated proteins (non-MAPs). The final solution contains the soluble molecules of heterodimeric αβ-tubulin and microtubule-associated proteins (MAPs). To purify the tubulin protein from MAPs one passes the above mentioned solution through a phosphocellulose (PC) column, in which the MAPs bind and tubulin molecules pass through. Then the purified protein is frozen in liquid nitrogen for long-term storage (Fig. 2.1).
2.1.2 Cycling of Purified Tubulin
Before usage for in vitro studies, the purified porcine tubulin has to undergo a final cycling, the process of additional polymerization, centrifugation, depolymerization of the microtubules. This step ensures the presence of only tubulin that is able to
CHAPTER 2. PROTEIN EXPRESSION, PURIFICATION AND LABELING 18
Collection of fresh pig brains
(brains straight from pig to polythene bags filled with cold PBS/PBS ice cubes)
Brain homogenization
(100mM PIPES/KOH, EDTA, EGTA, MgCl2, ATP, BME, PI )
1st Clarification (coarse) (Beckman JLA- 8.1000 at 7,000 rpm, 4 ˚C, for 15 min)
Discard pellet
Supernatant (coarse clarified brain homogenate) - filter through cloth
2nd Clarification (coarse) (Beckman JLA 16.250 at 7,000 rpm, 4 ˚C, for 60 min)
Supernatant (clarified brain homogenate) (add 1/2 vol. glycerol, GTP, ATP, MgCl2)
polymerise microtubules at 37 ˚C for 60 min
1st Warm spin (Pellet microtubules, Beckman Type 19 at 19,000 rpm, 37 ˚C, for 120 min)
Discard pellet
Discard supernatant
Pellet (microtubules + MAPs) (100mM PIPES/KOH, EDTA, EGTA, MgCl2, BME)
resuspend microtubules and depolymerise in ice cold buffer, leave on ice for further 30 min
1st Cold spin (Clarification, Beckman Type 45-Ti at 45,000 rpm, 37 ˚C, for 60 min) Discard pellet
Supernatant (soluble tubulin + MAPs) (add 1/2 vol. glycerol, GTP, ATP, MgCl2)
polymerise microtubules at 37 ˚C for 60 min
2nd Warm spin (Pellet microtubules, Beckman Type 45-Ti at 45,000 rpm, 37 ˚C, for 60 min)
Discard supernatant
Pellet (microtubules + MAPs)
freeze pellets in their tubes, in liquid nitrogen, store at -80 ˚C, until ready to perform phosphocellulose purification
...
Pellet (microtubules + MAPs) (50mM PIPES/KOH, EGTA, MgCl2)
resuspend microtubules and depolymerise in ice cold buffer, leave on ice for further 30 min
2nd Cold spin (Clarification, Beckman Type 45-Ti at 45,000 rpm, 4 ˚C, for 30 min) Discard pellet
Supernatant (soluble tubulin + MAPs)
phosphocellulose column (PC) to remove MAPs, flow-through aliquotted, stoter at -80 ˚C for several years
Column flow-through (”PC-tubulin”)
final cycling of individual PC-tubulin aliquots to isolate polymerisation-competent tubulin
Da y 2 Da y 3 Da y 1
Figure 2.1: Outline of steps of purification αβ-tubulin from porcine brains Figure style based on [46]
19 2.1. TUBULIN PURIFICATION AND LABELING
ble microtubules. During the cycling process, polymerized microtubules are spun down through a glycerol cushion. The microtubules are heavy enough to pass through the cushion, but non-polymerized heterodimeric αβ-tubulin is not (Fig. 2.2). After the cy-cling, the tubulin protein is aliquoted and snap frozen in liquid nitrogen for subsequent long-term storage at -80 ℃.
The tubulin concentration is measured by a NanoDrop spectrometer. The tubulin concentration is measured at 280 nm, using a dilution series in 1x BRB80 (80 mM PIPES/KOH, 4 mM MgCl2), with blank being 1x BRB80. One can calculate the final
concentration from Atub =I×Ctub×ε, where Atub denotes the absorption, I the path length of the cuvette,Ctubthe concentration in mol/L, andεis the extinction coefficient equal to 115,000M−1cm−1.
Thaw PC-tubulin Polymerisation
add thawed tubulin to the reaction mix for the final concentration 80 mM PIPES/KOH, 4 mM MgCl2, 1 mM GTP, 30% Glycerol
polymerise microtubules at 37 ˚C for 60 min
Discard supernatant
Warm spin (Pellet microtubules through
prewarmed 60% glycerol cushion (ratio 1:1), Beckman MLA-80 at 50000 rpm, 37 ˚C, for 60 min)
Pellet (microtubules)
resuspend microtubules and depolymerise in ice cold
80mM PIPES/KOH, 4 mM MgCl2, 0.1% BME, leave on ice for further 30 min
Discard pellet Cold spin (Clarification, Beckman MLA-80
at 50000 rpm, 4 ˚C, for 15 min)
Supernatant (soluble tubulin)
Aliquote the tubulin protein and snap freeze in liquid nitrogen for further long-term storage at -80 ˚C
Concentartion measurement of cycled PC-tubulin
Figure 2.2: Outline of steps of PC-tubulin cycling
2.1.3 Labeling PC-Tubulin with TAMRA
The PC-tubulin is labeled with TAMRA (Invitrogen), a rhodamine fluorescent dye. This dye binds fluorophores covalently to primary amines, the N-terminus, or cysteine groups of tubulin. The protocol of tubulin labeling consists of the step of microtubule polymer-ization, then microtubule centrifugation through a glycerol cushion to remove all non-polymerized tubulin, followed by microtubule labeling with fluorescent dye, spinning
CHAPTER 2. PROTEIN EXPRESSION, PURIFICATION AND LABELING 20
down the labeled microtubules though the glycerol cushion to get rid off non-reacted fluorescent dye, with subsequent microtubule depolymerization to get soluble labeled heterodimeric tubulin. The second microtubule polymerization ensures that the labeled tubulin is able to form microtubules. The final step of depolymerization results in solu-ble labeled tubulin, which can be snap frozen in liquid nitrogen for long-term storage at -80℃ (Fig. 2.3).
The quantification of the labeled tubulin concentration and labeling stoichiometry is based on the measure of both absorption of tubulin protein at 280 nm and of TAMRA at 555 nm obtained with the NanoDrop spectrometer. The concentration of tubulin in mg/mL is given by:
Ctub =
Atub−Adye·CF 1.15 ,
whereAtub is the tubulin absorbance at 280 nm,Adye is the dye absorbance at 555 nm, CF is a correction factor to account for dye absorbance at 280nm (for TAMRA CF = 0.3).
The stoichiometry of labeling is then given by:
Dlab =
Adye·110,000 Ctub·εdye
,
21 2.1. TUBULIN PURIFICATION AND LABELING
CHAPTER 2. PROTEIN EXPRESSION, PURIFICATION AND LABELING 22
2.2
XMAP215 Expression and Purification
2.2.1 Over-expression System for XMAP215 Tagged with GFP and
His7
The coding gene of XMAP215 was modified by sequential addition of a C-terminal en-hanced green protein (GFP) and a C-terminal His7 tag cloned into pFastBac1 vector. Then, a baculovirus was generated from this construct for the BAC-to-BAC baculovirus expression system (Invitrogen) [22]. For this purpose, I have done a transposition of pFastBac1 into the baculovirus genome ofE.coli strain DH10BAC.
Then the antibiotic selection of the recombinant virus bacmid shuttle vector was per-formed. The cells with the recombinant virus bacmid grew white in a background of blue cells. I picked up seven white colonies and one blue for the control and performed the second round of antibiotic selection (the ”back-up plate”). I also checked selected colonies with PCR to verify the presence of the bacmid transposed with pFastBac1 with the inserted gene of interest. The idea of PCR screening is that the virus bacmid with pFastBac1 and the inserted gene of interest is heavier than just the bacmid alone or the bacmid with an empty pFastBac1.
After PCR screening, I picked up four colonies from the ”back-up plate” and purified the bacmid DNA with the Perfectprep BAC kit 96 (5 PRIME). Then I transfected 400
µL of insect SF+ cells with 5 µL of the purified virus bacmid in the presence of Escort IV reagent and after four days harvested the passage 1 (P1) virus.
For the large-scale expression of XMAP215-GFP-His7, I prepared baculovirus infected insect cells (BIIC) stock. For that, I infected 50mL of SF+ cells with 50µL of P1 virus and after 24 hours pelleted the cells with subsequent snap freezing for storage in liquid nitrogen. Then I performed a time-coarse of protein XMAP215-GFP-His7 full-length expression. I observed the peak of the expression after 85 hours.
Finally, for large-scale expression, 2x500 mL of SF+cells were infected with 2x100 µL of BIIC. After 85 hours the cells were pelleted, resuspended in ice-cold lysis buffer (50 mM Hepes pH 7.5, 200 mM NaCl, 5% glycerol, 0.1% Triton X-100), frozen as pearls in liquid nitrogen and stored at -80 ℃for subsequent purification.
2.2.2 Purification of Recombinant Protein XMAP215 Tagged with GFP
and His7
The purification of the recombinant protein was done in three steps. For the first step, the cation exchange column was used to get rid of all negatively charged proteins. For the second step, I used a Ni-affinity column to which the His7-tag binds strongly and all other proteins lacking the His repeats pass thought the column. Finally, for the last step, I used a size exclusion chromatography column.
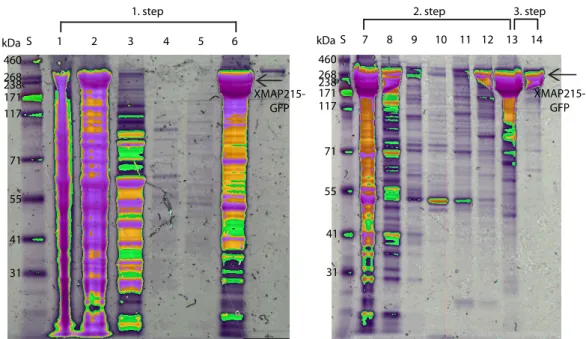
23 2.2. XMAP215 EXPRESSION AND PURIFICATION 460 268 238 171 117 71 55 41 31 kDaS 1 2 3 4 5 6 1. step 460 268 238 171 117 71 55 41 31 kDaS 7 8 9 10 11 12 13 14 2. step 3. step XMAP215-GFP XMAP215-GFP
Figure 2.4: SDS-Page gels of XMAP215 purification. The XMAP215 purifica-tion is done in three steps. For the first step, the capurifica-tion exchange column is used. The progression of this step can be seen in the SDS-Page gel in the following order: 1. cell lysate before centrifugation, 2. supernatant of the centrifuged cell lysate loaded onto the cation exchange column, 3. the flow through, 4. wash with 75 mM NaCl, 5. wash with 150 mM NaCl, 6. elution with 600 mM NaCl. The second step is the purification with the Ni-affinity column. The progression of this step is the following: 7. load onto the Ni-affinity column, 8. flow through, 9. wash with 9mM Imidazole, 10. wash with the high salt buffer, 11. wash with 60mM Imidazole, 12. wash with 120mM Imidazole, 13. elution of XMAP215 with 300mM Imidazole. The third step is a size exclusion chromatography column. 14. peak fractions of XMAP215 after passing through the size exclusion chromatography column. The protein standard was HiMark™prestained (Invitrogen) (denoted as S on the gel pictures).
The frozen cells were thawed on ice. After addition of 1mM CaCl2, 1x protease
in-hibitors mix (1µg/mL AMPSF, 10µg/mL antipain-HCl, 6µg/mL chymostatin, 2µg/mL aprotinin, 0.7µg/mL pepstatin A, 0.5 µg/mL leupeptin and 10µM E64) the cells were homogenized with a pre-chilled douncer. The lysed cells were centrifuged in MLA80 rotor at 80,000rpm, 4℃ for 45 min. The pellet was discarded. To the supernatant I added Lysis buffer without salt (50 mM Hepes pH 7.5, 5% glycerol, 0.1% Triton X-100) to lower the NaCl concentration to 100mM. The obtained supernatant was loaded onto a SP-sepharose column (5 mL HiTrap SP HP, Pharmacia) equilibrated with cation buffer containing 75 mM NaCl (6.7 mM MES, 6.7 mM HEPES pH 7.2, 6.7 mM C2H3NaO2,
75 mM NaCl). The column was washed with a cation buffer containing 75 mM NaCl and subsequently with one containing 150 mM NaCl. The protein was eluted from the
CHAPTER 2. PROTEIN EXPRESSION, PURIFICATION AND LABELING 24
column with cation buffer containing 600 mM NaCl. The peak fractions were pooled, brought to 9 mM Imidazole, and loaded onto a Ni2+- sepharose column (1 mL HisTrap, Pharmacia) equilibrated with a Ni-affinity buffer (25 mM Tris-HCl pH 8.0, 300 mM NaCl, 20% glycerol, 9 mM imidazole). The column was washed with 9mM imidazole, a high salt buffer (Ni-affinity buffer with 60 mg/mL NaCl), and with a Ni-affinity buffer containing 60mM Imidazole and 120mM Imidazole . XMAP215-GFP-His7 was eluted at 300mM Imidazole. The peak fractions were pooled and loaded onto a size exclusion chromatography column (GE Healthcare Superdex 200 16/60, 24 mL) pre-equilibrated with gel filtration buffer (10 mM Tris Base, 10mM Bis-Tris, 100mM KCl). The peak fractions were chosen and pooled (Fig. 2.4).
The concentration of the protein was measured with the NanoDrop spectrometer. For this purpose, the protein was degraded in 4 M urea. The Nanodrop was blanked against 4 M urea. Based on the absorption at 280nm, the concentration of the protein was calcu-lated. The concentration of the protein in M is given by: A=I×c×ε, whereAdenotes the absorption, I the path length of the cuvette equal to 1 cm, c the concentration in mol/L, and ε the extinction coefficient equal to 154,900 M−1cm−1. After addition of 1mM DTT and 10% glycerol, the protein was snap frozen in liquid nitrogen and stored at -80℃.
Table 2.1: Buffers used for the purification of XMAP215-GFP
Buffer Discription
Lysis buffer 50 mM Hepes pH 7.5, 5% glycerol, 0.1% Triton X-100, 200mM NaCl
Lysis buffer w/o NaCl 50 mM Hepes pH 7.5, 5% glycerol, 0.1% Triton X-100 Cation buffer w/o NaCl 6.7 mM MES, 6.7 mM HEPES pH 7.2, 6.7 mM
C2H3NaO2
Ni-affinity buffer w/o Imidazole
25 mM Tris-HCl pH 8.0, 300 mM NaCl, 20% glycerol
Chapter 3
Optical Tweezers
This chapter provides an explanation of the optical trapping phenomenon, a description of the apparatus, and the calibration of the optical tweezers used for my experiments. Here, I also explain the feedback technique to keep a force constant, which is essential for the applied-force experiments
3.1
Theoretical Background of Optical Trapping
In 1970 A. Ashkin et al. [11] showed that small dielectric objects can be trapped in a tightly focused laser beam. Based on this effect, an apparatus was constructed that can manipulate nanometer- and micrometer-sized dielectric particles by changing the lateral and axial position of the trapping laser focus. Because of this capability, the device was named optical tweezers. A micrometer-sized dielectric object can be trapped because of the interaction with the incident tightly focused laser light. This phenomenon can be explained by different theories depending on the size of the dielectric object Drelative to the wavelengthλof the trapping laser. If the size of the object is much large than the laser wavelength (Dλ) thengeometric optics can be used, if the size of the object is much smaller than the laser wavelength (Dλ) then theRayleigh theory is valid, and if the size of the object is comparable with the laser wavelength (D ≈λ/2π) then the exact electromagnetic theory is needed.
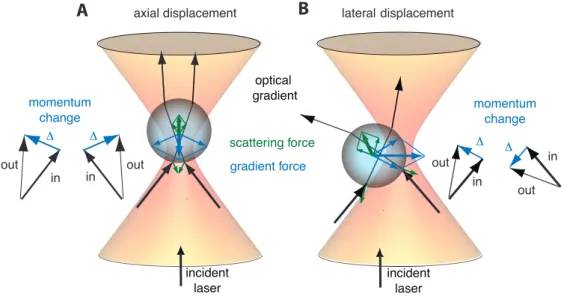
Geometric optics. According togeometric optics, light can be represented as a bundle of the rays. Each ray has a momentum proportional to its intensity. When a light ray encounters a dielectric object (from now onwards referred to as a polystyrene microsphere or bead), it is reflected and refracted at the interface between the object and the medium according to Snell’s law: nmsinθi = nosinθr, where nm is the refractive index of the medium,nothe refractive index of the object,θithe incident angle of the light ray, andθr the refractive angle. If the refractive indexes of the medium and the microsphere differ, then the light ray will deviate from the initial path causing a change in its momentum. Because of momentum conservation, the microsphere experiences an equal and opposite momentum change. The net momentum change of all rays in the light beam gives a rise
CHAPTER 3. OPTICAL TWEEZERS 26 incident laser optical gradient gradient force scattering force momentum change in out Δ momentum change incident laser in Δ out in Δ out in out Δ
axial displacement lateral displacement
A
B
Figure 3.1: Geometric optics description of the scattering and gradient forces. A polystyrene bead is trapped in the tightly focused laser beam. The incident laser light is represented by two rays (black lines with different thickness representing the light intensity). The incoming rays are refracted two times passing through the bead, and, therefore, their momentum is changed. This is illustrated by the difference ∆ of the momentum of the entering (in) and leaving ray (out) at the vector diagrams (A) and (B). Because of momentum conservation, the bead will experience an equal and opposite momentum change, which results inthe gradient force shown as a blue arrow. In (A), the bead is displaced above the laser focus. The moment change leads to the gradient force pointing down towards the focus and resulting in axial movement of the bead into the laser focus. In (B), the bead is displaced to the left from the focus. The momentum change leads to the gradient force pointing to the right, and, thereby, displacing the bead laterally into the laser focus. The incident light is also reflected by the bead (depicted by green arrows). This leads to the scattering force that acts in the propagation of the direction and, hence, tends to destabilize the optical trap.
to a gradient force pushing the object towards the region of highest light intensity. On the other hand, some of the light rays are reflected by the microsphere. When a light ray is reflected, it changes the direction of the initial path and hence its momentum is changed as well. Therefore, the equal and opposite momentum change is transferred to the microsphere. The net momentum change of the reflected rays give rise to ascattering forcepushing the bead out of the region of highest light intensity. As a result, these two forces compete with each other. And the dielectric object can be trapped if thegradient force is higher than the scattering force (Fig. 3.1) [12].
Rayleigh approximation Electromagnetic fields induce a polarization of dielectric objects. If the microsphere is much smaller than the wavelength of the trapping laser then it can be treated as a point dipole. In an electromagnetic field with an intensity
27 3.2. OPTICAL TRAP: A HOOKEAN SPRING IN THREE DIMENSIONS
gradient, the point dipole experiences a force that can be decomposed into two forces: a
gradient force and a scattering force. The gradient force results from the Lorentz force acting on an induced dipole in an electromagnetic field with an intensity gradient. It scales with Fgrad ∝ R3∇E2, where E is the magnitude of electric field and R is the radius of a microsphere. This force brings the microsphere towards the region of highest intensity of the electromagnetic field. Thescattering force is due to the scattering of an electromagnetic wave by a point dipole. This force scales withFscat∝R6E2 [51].
Electromagnetic theory If the size of a microsphere is comparable with the wave-length of the trapping laser then it is necessary to use the exact electromagnetic theory to explain the phenomenon of trapping. In this case, it is treated as a scattering problem. The analytical solution for the scattering of a light plane wave by a sphere is provided by the Lorenz-Mie theory. However, the laser light in optical tweezers is not a plane wave, but a tightly focused beam. This causes certain difficulties for the mathematical description of it. Nevertheless, forces can be calculated numerically [92].
3.2
Optical trap: a Hookean spring in three dimensions
The microsphere trapped in a tightly focused laser beam is located in a three-dimensional potential well. For small displacements of the bead, the potentials are quadratic, for the x-direction, e.g. given by:
U = κx
2
2 .
The force keeping the microsphere in the potential results from:
−dU
dx =F =−κx.
Hence, if the bead is displaced from the laser focal spot, a restoring force brings the bead back to the focus. The magnitude of the restoring force is proportional to the displacement from the focal spot. This is nothing else, but Hooke’s law. Therefore, the optical trap can be represented as a Hookean spring in three dimensions.
3.3
Optical tweezers is a tool to apply piconewton forces
and detect nanometer displacement
Optical traps are very sensitive instruments and are able to detect a sub-nanometer displacement of a sub-micrometer dielectric particle, usually a polystyrene microsphere, with high temporal resolution. Because of this optical tweezers are widely used in biology to measure the interaction of e.g. kinesin proteins, DNA machinery proteins, kinetochore proteins, microtubule associated proteins with their respective substrates.
CHAPTER 3. OPTICAL TWEEZERS 28
3.4
Optical tweezers setup used for the DIC imaging and
the experiment with stationary optical trap
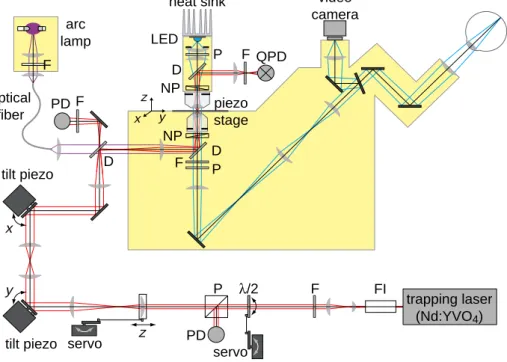
x y x y piezo stage video camera heat sink arc lamp tilt piezo tilt piezo PD QPD NP NP P P λ/2 F F F D D D F P z servo servo PD F LED z optical fiber trapping laser (Nd:YVO4) FI
Figure 3.2: Schematic drawing of the optical tweezers setup. All the optical components are shown. The trapping laser path is depicted in red and the image path is blue. The labeled components of optical tweezers are: Faraday isolator (FI), filter (F), half-wave plate (λ/2), polarizer (P), photo-diode (PD), dichroic mirror (D), Nomarski prism (NP), light emitting diode (LED), quadrant photo- diode (QPD). (Adopted from [103])
The optical tweezers setup was built around an inverted microscope (Zeiss Axiovert 135 TV) on an optical table. The schematic drawing with all elements and the light path is shown in Fig. 3.2. For a detailed description see [103], [18].
3.5
Optical tweezers setup used for the experiment with a
force feedback
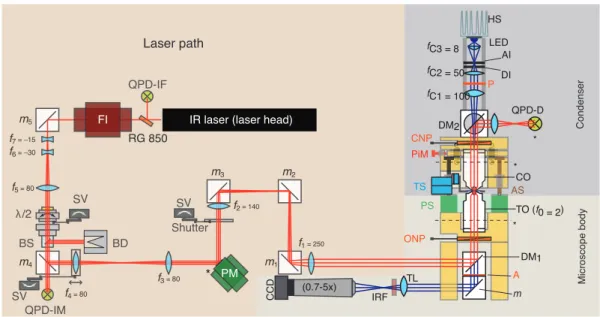
For constant force measurements another setup was used, which is described in detail in [77]. The setup is schematically depicted in Fig. 3.3.
29 3.6. CALIBRATION OF OPTICAL TWEEZERS
Microscope body
Condenser
Laser path LED
HS P QPD-D CNP ONP PS A (0.7-5x) CCD AS PiM TS TL DI AI IRF TO (f0 = 2) CO * * * DM1 DM2 fC1 = 100 fC2 = 50 fC3 = 8 m f3 = 80 PM BS SV
FI IR laser (laser head)
Shutter BD QPD-IM QPD-IF SV f4 = 80 f7 = −15 f6 = −30 f5 = 80 f2 = 140 f1 = 250 SV λ/2 RG 850 m2 m1 m3 m4 m5 *
Figure 3.3: The schematic drawing of optical tweezers setup. All the optical components are shown. The trapping laser path is depicted in red and the image path is in blue. The labeled components of optical tweezers are: quadrant photo- diode for intensity feedback (QPD-IF), Faraday isolator (FI), laser mirrors (m1−5), lenses (f1−
7), half-wave plate (λ/2), servo(SV), beam splitter (BS), beam dump (BD), quadrant photo-diode for intensity monitoring (QPD-IM), piezo mirror (PM), piezo translation stage (PS), S, stage; PSD, position sensitive diode. All focal length are in mm. The parts of a home-built microscope: heat sink (HS), light emitting diode (LED), lens (fc1−3), aperture iris (AI), field diagram iris (DI), polarizer (P), condenser Nomarski
prism (CNP), quadrant photo- diode for detection (QPD-D), dichroic mirror (DM1−2),
condenser objective (CO), pico motor (PiM), traveling stage (TS), adjustment screw (AS), piezo stage (PS), trapping objective (TO), objective Nomarski prism (ONP), analyzer (A), mirror (m), tube lens (TL), infrared blocking filter (IRF), charge-coupled device (CCD).The dashed lines across the trapping and condenser objectives indicate the back focal plane. The asterisks indicate conjugate planes. (Adopted from [76])
3.6
Calibration of Optical Tweezers
In the optical trap, the microsphere is held by the trapping force. This force balances the thermal force, causing Brownian motion, damped by the drag force due to the viscosity of the medium. Since the trapping force can be described by Hooke’s law:
Ftrap=κ·∆x,one can measure the trapping force if the trap stiffness κand the micro-sphere displacement from the laser focus ∆x are known. The lateral and axial position of the microsphere are monitored by a quadrant photo diode (QPD). The read out from the QPD is in volts. To get the position of the trapped microsphere in nanometers one needs to calculate the conversion factor β in nm/V, also called sensitivity factor, or, in other words, calibrate the detection system. The trap stiffnessκ can be calculated from
CHAPTER 3. OPTICAL TWEEZERS 30 10−7 10−6 10−5 Frequency (Hz) 10 102 103 104 1 10−8 10−4 10−3 10−2 x y z P ow er spectr al density (nm 2 /Hz 1/2 ) rms fc S0
Figure 3.4: Optical trap calibration. Example of a calibrated power spectral density of a trapped 0.528µm microsphere forx-,y-, andz-directions. The calibration spike on they-direction atfstage= 32 Hz results from oscillating the stage at the same frequency. Each power spectrum is an average of 40 independent spectra. The vertical dashed line indicates the corner frequency fcand the horizontal dashed line indicates the plateauS0for the axial direction. The sampling rate was 102400 Hz at a resolution
of 1 Hz. Each spectrum is fitted with a Lorentzian (bright line). (Taken from [76])
the forces acting on the trapped microsphere.
In our setup we use the calibration method described in [115], in which the displace-ment of a trapped bead is measured in response to a known flow. In this method, the sample is moved by a piezo-stage sinusoidally with known amplitude (0.5 - 1 µm) and frequency (32 Hz) relative to the optical trap. In a power spectrum, this motion results in a Lorentzian-type power spectrum, characterized by a plateau value S0 and corner
frequencyfc, with an additional spike at the oscillation frequency (32 Hz). The height of this spike serves as a scale bar for the sensitivity factorβ:
β =A s 2Pspike∆f(1 + f2 c foscil2 ),
where A is the amplitude of the oscillations, Pspike∆f is the measured power in the spike, fc is a corner frequency of the Lorentzian-type power spectrum and foscil is the frequency of the oscillations.
Knowing the displacement sensitivity β, one can calculate the trap stiffness κ using
31 3.7. FORCE FEEDBACK
D = kbT
γ , where the diffusion coefficient in nm
2/V is equal to D =β2 ·2π2S
0fc2. The trap stiffness is given by:
κ= kbT
πβ2S
0fc
.
3.7
Force feedback
In a dynamic microtubule assay, a microsphere, covered with XMAP216-GFP-His7, is positioned at the growing microtubule tip by the optical trap. If the optical trap is stationary then the microsphere following the microtubule growth will move away from the laser focus after some time. This will give rise to a restoring force proportional to the microsphere displacement from the laser focus. At a certain displacement, the force will become large enough to detach the microsphere from the microtubule tip and bring it back to the optical trap center. On the other hand, if the optical trap can follow the bead movement with a fixed offset between the center of the microsphere and the laser focus then a constant trapping force will act on the microsphere. If the offset is equal to zero then the trapping force is equal to zero and one can follow the movement of the microsphere with optical trap without any force applied. However, in practice it is not possible to keep the offset equal to zero, therefore a certain small offset is kept to give rise to a small constant trapping force (∼0.1 pN). By increasing the offset between the
microsphere center and the laser focus, one can set the desired constant force acting on it. Depending on where the optical trap is with respect to the bead center the applied force can be pushing or pulling. To follow the position of the microsphere with the constant force a feedback is required, which will maintain the same offset between the bead center and the optical trap canter over time. In our setup, we used a feedback based on a proportional-integral-derivative (PID) controller.
3.7.1 PID controller method.
To maintain the same offset between the laser focus and the center of the bead, the feedback loop needs to read a process variable, the actual position of the bead with respect to the optical trap position, calculate the difference between it and a set point, the desired offset, and give an output to compensate for any error. The error is the difference between the desired offset and actual position. The output signal according to the PID controller method can be represented as a sum ofproportional, integral and
derivative terms: U(t) =P e(t) +I Z t 0 e(τ)dτ+Dde(t) dt ,
whereP is the proportional gain, I the integral gain,D the derivative gain,ethe error and ttime [60], [13].
The proportional gain P makes the feedback output proportional to the error mag-nitude e. Used alone, the proportional gain gives rise to a finite difference between set point and a process variable, a so-called steady-state error. The integral gain I sums
CHAPTER 3. OPTICAL TWEEZERS 32
the error term over time and, hence, proportional to both the error magnitude e and the duration of the error τ. This term accelerates the process of reaching the desired set point and removes the residual steady-state error from the feedback output signal, although it may give rise to the so-called overshoot error, when the output feedback sig-nal overshoots the set point. To eliminate the overshooting problem, thederivative gain
D is used. It is proportional to the rate of change of the process variable. One needs to use it carefully because, in very noisy systems, this term can add noise or destabilize the feedback.
3.7.2 Tuning the feedback parameters.
In our setup, a two-dimensional PID feedback is implemented in Labview. The feedback calculates the proportional, integral and derivative gains separately. The laser focus is moved by a piezo tilt mirror in thex- andy- directions according to the output signal of the feedback. Therefore, the QPD signal of the bead position remains close to constant and the main information about the trapped microsphere position is contained in the mirror sensor signal: xbead=−(xmirror+xQP D). During the measurements, we acquired eight signals: three signals from the QPD of the x,y and z position of the trapped mi-crosphere, the three monitor signalsx,y and zof the piezo stage and two signals xand
y of the piezo tilt mirror.
In my experiment, I want to follow XMAP215 attached to the microsphere surfing a dynamic microtubule end. Is microtubule growing stepwise by the addition of the 8 nm tubulin dimers? To answer this question, my ultimate goal is to resolve 8 nm steps. To tune the feedback parameters, I used the so-called trial and error method. According to it, the P value needs to be increased until oscillations occur and then decreased again for a suitable fast response. Then, theI parameter is optimized to minimize the steady-state error and avoid overshoot. Finally, theD parameter is increased until the loop is quick to reach the set point.
First, I immobilized carboxyl-modified polystyrene microspheres of 0.59 µm in diam-eter on the glass surface of my flow cell. Then I simulated 8 nm steps with a frequency of 3 Hz by a random stepwise movement of the piezo stage. To tune the feedback pa-rameters, I followed this simulated movement with the mirror feedback until the 8 nm steps were clearly resolved. The feedback rate, how many times per second the feedback updates the microsphere position, was chosen to be 1000 Hz. The feedback rate has to be lower than the corner frequencyfcof the power spectrum of the trapped microsphere to avoid amplification of the Brownian motion.
Then, to make the situation resemble to my experimental conditions, I attached an antibody specific to the C-terminus of XMAP215 to the glass surface of the flow cell and blocked the remaining surface with Pluronic F-127 to prevent non-specific interactions. When the XMAP215-GFP-His7-coated microsphere was brought into contact with the flow cell surface, the antibody reacted with XMAP215 and the microsphere became
at-33 3.7. FORCE FEEDBACK
tached. Then, I simulated the 8 nm steps with the piezo stage and followed the position of the attached microsphere with the mirror feedback. Because of the long PEG linker (see below), I could not resolve 8 nm steps. However, 20 nm steps at 3 Hz were clearly resolved with fine-tuned PID parameters and 1000Hz feedback rate.


![Figure 2.1: Outline of steps of purification αβ-tubulin from porcine brains Figure style based on [46]](https://thumb-us.123doks.com/thumbv2/123dok_us/9623961.2841483/26.892.212.734.149.991/figure-outline-steps-purification-tubulin-porcine-brains-figure.webp)