econ
stor
Der Open-Access-Publikationsserver der ZBW – Leibniz-Informationszentrum Wirtschaft
The Open Access Publication Server of the ZBW – Leibniz Information Centre for Economics
Nutzungsbedingungen:
Die ZBW räumt Ihnen als Nutzerin/Nutzer das unentgeltliche, räumlich unbeschränkte und zeitlich auf die Dauer des Schutzrechts beschränkte einfache Recht ein, das ausgewählte Werk im Rahmen der unter
→ http://www.econstor.eu/dspace/Nutzungsbedingungen nachzulesenden vollständigen Nutzungsbedingungen zu vervielfältigen, mit denen die Nutzerin/der Nutzer sich durch die erste Nutzung einverstanden erklärt.
Terms of use:
The ZBW grants you, the user, the non-exclusive right to use the selected work free of charge, territorially unrestricted and within the time limit of the term of the property rights according to the terms specified at
→ http://www.econstor.eu/dspace/Nutzungsbedingungen By the first use of the selected work the user agrees and declares to comply with these terms of use.
zbw
Leibniz-Informationszentrum Wirtschaft Leibniz Information Centre for EconomicsBach, Stefan; Grabka, Markus; Tomasch, Erik
Article
Tax and transfer system: Considerable redistribution
mainly via social insurance
DIW Economic Bulletin
Provided in Cooperation with:
German Institute for Economic Research (DIW Berlin)
Suggested Citation: Bach, Stefan; Grabka, Markus; Tomasch, Erik (2015) : Tax and transfer
system: Considerable redistribution mainly via social insurance, DIW Economic Bulletin, ISSN
2192-7219, Vol. 5, Iss. 8, pp. 103-111
This Version is available at:
http://hdl.handle.net/10419/107608
Overall monetary redistribution via the tax and transfer system
leads to net incomes being much more evenly distributed in
Ger-many than market income. As a result, in 2011, the Gini coefficient
decreased from 0.5 for market income to 0.29 for household
dis-posable income. The social security system has a significant share
in total income redistribution by the government, making up more
than half of the inequality reduction. As far as there are equivalent
insurance contributions for social security benefits, there is,
howev-er, no redistribution between individuals or generations over time.
This shows that, in terms of how well public transfers are targeted,
the most financially needy households are benefitting most from
means-tested basic social security payments. Other public
ben-efits such as the child benefit, however, are granted to all income
groups. It was primarily the upper income brackets that benefitted
from the now expired housing support for owner-occupiers
(Eigen-heimzulage)
.
Tax and Transfer System:
Considerable Redistribution
Mainly Via Social Insurance
By Stefan Bach, Markus Grabka and Erik Tomasch
The German tax and transfer system redistributes citi-zens’ income effectively. Taxes and social security con-tributions redirect a share of generated income into government coffers, a substantial portion of which is given directly to citizens in the form of monetary gov-ernment benefits. In international terms, Germany is regarded as a country with a high level of income re-distribution by the government.1 This is primarily due
to its broad-based social security systems that lead to intra- and intergenerational redistribution. Social se-curity benefits, for which equivalent insurance contri-butions are levied (retirement pensions from statuto-ry pension insurance (gesetzliche Rentenversicherung,
GRV), unemployment benefit), however, are not ulti-mately redistributed between individuals or genera-tions over time.
In this study, we examine the redistributive effects of the German tax and transfer system on individual house-holds. First, the study will show the overall economic dimensions of all social security benefits based on Ger-many’s national accounts from 2005 to 2013.2 Then, the
impact of monetary social benefits on personal income distribution is analyzed using data from the Socio-Eco-nomic Panel (SOEP) study collected on behalf of DIW Berlin by TNS Infratest Sozialforschung.3
1 See OECD, Growing Unequal? Income Distribution and Poverty in OECD Countries (2008); Scientific Advisory Board at the Federal Ministry of Finance, Besteuerung von Vermögen – eine finanzwissenschaftliche Analyse (2013); Judith Niehues, “Staatliche Umverteilung in der Europäischen Union,” IW-Trends, no. 1 (2013); OECD StatExtracts, Income Distribution and Poverty, 2014.
2 Here, calculations of the national accounts from May 2014 are used, prior to German national accounts being revised in line with the European System of Accounts 2010 (ESA 2010).
3 SOEP is a representative longitudinal survey of individual households conducted annually in West Germany since 1984 and in eastern Germany since 1990, see G. G. Wagner, J. Göbel, P. Krause, R. Pischner, and I. Sieber, “Das Sozio-oekonomische Panel (SOEP): Multidisziplinäres Haushaltspanel und Kohortenstudie für Deutschland – Eine Einführung (für neue Datennutzer) mit einem Ausblick (für erfahrene Anwender),” AStA Wirtschafts- und Sozialstatis-tisches Archiv, vol. 2, no. 4 (2008): 301–328.
These also include family-related benefits, such as child benefit and parental allowance.5
The national accounts record the following employer-side and private funded security scheme benefits: ben-efits from company pension schemes, additional fund-ed pensions (Riester pension), the civil pension scheme, pension plans for the self-employed, as well as private health and long-term care insurance. These benefits ac-count for a good four percent of GDP.
The share of total monetary social security benefits in GDP fell slightly during the observation period 2005 to 2013. This development was largely due to the relative decline in pension spending. Unemployment benefits have also dropped considerably in line with this trend. Here, the significant decrease in unemployment since 2005 comes into play. These developments were only briefly interrupted by the impact of the financial and economic crisis of 2009/10 and the unemployment and short-time working benefits that had to be paid as a re-sult. The disposable incomes of individual households are reduced by income tax and other direct taxes and contributions, which, most recently (2013), accounted for 9.4 percent of GDP and have increased in recent years. At the same time, total social security contribu-tions (including employer contribucontribu-tions, contribucontribu-tions to private funded social security systems, and imput-ed social security contributions for civil servants) have remained constant at 20 percent of GDP, with employ-er-side social security contributions and those to pri-vate funded social security systems gaining in impor-tance somewhat .
Including other paid and received transfers, which, in addition to private transfers such as life insurance pay-ments and premiums or cross-border credit transfers, encompass other government grants and support pro-grams or fines, the disposable income of individual households in 2013 was just under 63 percent of GDP. Notwithstanding a brief interruption by the econom-ic crisis of 2009/10, this proportion has declined in re-cent years, because social security benefits (in particu-lar, pension and unemployment insurance payments) have fallen and direct taxes have increased.
5 In the national accounts, child benefit is only recorded as a social security benefit to the extent that it exceeds the fictitious tax relief effect of allowances for dependent children in income tax assessment. Here, total child benefit (2013: 38.5 billion euros) is divided into family support components (18 billion euros) and a tax exemption component (20.5 billion euros), which reduces income tax revenues; see Norbert Räth i.a., “Revision der Volkswirtschaftlichen Gesamtrechnungen 2011 für den Zeitraum 1991 bis 2010,” Federal Statistical Office, Economic and Statistics (September 2011): 862 ff.; Federal Ministry of Finance, Datensammlung zur Steuerpolitik 2013 (2011): 49.
Government Redistribution
from a Macroeconomic Perspective
Social spending plays a dominant role on the expendi-ture side of Germany’s national budget. In 2013, mon-etary and non-monmon-etary social benefits provided by the government made up 24 percent of gross domestic prod-uct (GDP), a total of 665 billion euros. This represents more than half of all government spending. Monetary social benefits alone total 16 percent of GDP or more than one-third of all government expenditure.
In Germany, taxes and social security contributions make up 90 percent of government revenues (see Ta-ble 1). In international comparison, the aggregate tax rate is rather low at 23.5 percent of GDP (2013).4 In
con-trast, social security contributions paid to the govern-ment amounting to almost 17 percent of GDP (2013) are instrumental in financing social security in Ger-many. Including social security contributions to pri-vate funded social security schemes (see below), so-cial security contributions actually make up 20 per-cent of GDP.
In addition, Table 1 shows the direct monetary redistri-bution of income via social security benefits, direct tax-es, social security contributions, and other transfers at the individual household level. The present study con-siders solely monetary redistribution and its distribu-tional effects, rather than non-monetary social benefits, i.e., primarily public health services provided by govern-ment authorities and public health insurance. Monetary social benefits in the national accounts include both government benefits and social security payments made by employers and private funded security systems. Overall, they increase household income by 18 percent of GDP (2013), equivalent to 490 billion euros. The largest item is monetary social security benefits at almost 11 percent of GDP. The majority of this share is spent on public pensions, the remainder goes on wage-replacement benefits for unemployment and health in-surance, and statutory accident and nursing benefits, which are included in the item “Other”. Since 2005, the share of monetary social security benefits in GDP has declined by two percentage points from 12.9 per-cent to 10.9 per12.9 per-cent.
Monetary social security benefits from government au-thorities include means-tested basic social security ben-efits, including housing benefits and training grants.
ty contributions. For the most part, this is down to the government’s tax and transfer system, since the trans-fer relationships between individual households and Overall, around 11 percent of GDP are redistributed at
individual household level through the balance of pub-lic and private transfers, direct taxes, and social securi-Table 1
Revenue and expenditure of general government and primary income, disposable income of households in national accounts
as percent of gross domestic product (GDP)
2005 2006 2007 2008 2009 2010 2011 2012 2013
Revenue and expenditure of general government
Expenditure 46.9 45.3 43.5 44.1 48.3 47.9 45.2 44.7 44.5
Social benefits other than social transfers in kind 18.5 17.7 16.5 16.3 18.0 17.2 16.3 16.1 16.1 Social benefits in kind 7.5 7.4 7.3 7.5 8.3 8.1 7.9 8.0 8.2
Subsidies 1.1 1.1 1.0 1.0 1.2 1.2 1.0 0.9 0.9
Other 19.7 19.1 18.6 19.2 20.8 21.3 19.9 19.6 19.3
Revenue 43.6 43.7 43.7 44.0 45.2 43.7 44.3 44.8 44.7
Taxes 21.9 22.6 23.5 23.7 23.5 22.4 23.1 23.6 23.6
Taxes on products 10.8 10.8 11.3 11.2 11.8 11.3 11.5 11.4 11.3 Taxes on income, other current taxes 11.1 11.9 12.2 12.4 11.8 11.2 11.7 12.1 12.4 Social contributions 17.9 17.3 16.5 16.5 17.3 16.9 16.7 16.8 16.8
Other 3.9 3.7 3.7 3.8 4.4 4.4 4.5 4.4 4.3
Primary income of housholds and redistribution by social benefits of the goverment and private funded security systems, current taxes on income and wealth, social contributions
Primary income 73.7 73.4 72.0 73.3 74.7 73.1 73.4 74.1 74.1 Compensation of employees 51.1 50.0 48.9 49.7 51.9 50.9 50.8 51.7 51.7 Property and entrepreneurial income 22.6 23.5 23.2 23.6 22.8 22.2 22.6 22.4 22.3 Social benefits other than social transfers in kind, recieved 19.8 19.0 17.7 17.6 19.9 19.1 18.1 18.0 17.9 Social security benefits of statutory social insurance 12.9 12.1 11.3 11.1 12.2 11.6 11.0 10.9 10.9
Pensions 10.2 9.8 9.4 9.4 10.0 9.6 9.3 9.2 9.1
Unempoloyment benefit 1.3 1.0 0.7 0.6 0.8 0.7 0.6 0.5 0.6 Cash benefits of health insurance 0.3 0.3 0.3 0.3 0.3 0.3 0.4 0.4 0.4
Other 1.1 1.0 0.9 0.9 1.1 1.0 0.9 0.8 0.8
Social benefits of government bodies 3.3 3.3 3.0 2.9 3.3 3.2 2.9 2.8 2.8
Social assistance 0.9 0.9 0.9 0.9 0.9 0.9 0.9 0.9 0.9
Social assistance for unemployed 1.1 1.2 1.0 0.9 1.0 0.9 0.8 0.7 0.7
Other 1.3 1.2 1.1 1.1 1.4 1.3 1.3 1.2 1.2
Private funded social benefits and unfunded employee social benefits 3.6 3.6 3.4 3.5 4.4 4.3 4.2 4.2 4.2
Company pensions 1.3 1.3 1.2 1.3 1.3 1.3 1.2 1.2 1.2
Civil servants’ pensions 2.0 1.9 1.9 1.9 2.1 2.1 2.0 2.0 2.1
Other 0.3 0.3 0.3 0.3 1.0 0.9 0.9 0.9 0.9
Current taxes on income, wealth, etc., payed 8.3 8.6 8.9 9.3 9.4 8.6 8.7 9.1 9.4
Taxes on income 8.0 8.2 8.6 9.0 9.1 8.3 8.4 8.8 9.1
Other current taxes 0.3 0.3 0.3 0.3 0.3 0.3 0.3 0.3 0.3
Social contributions, payed 20.1 19.7 18.9 19.1 20.8 20.3 20.1 20.2 20.1
thereof: payed to private funded social benefits 2.2 2.4 2.3 2.6 3.4 3.4 3.3 3.3 3.2
Balance of other transfers payed and received −0.1 −0.1 −0.2 −0.2 0.2 0.1 0.1 0.2 0.2 Disposable income 65.1 64.0 61.9 62.3 64.6 63.4 62.9 63.0 62.7
For information:
Revenue of statutory pension insurance 10.7 10.2 10.1 10.1 10.6 10.3 10.1 10.0 9.8
thereof:
Actual social contributions 7.0 6.8 6.8 6.8 7.2 7.0 6.9 6.9 6.7 Tranfers from the government 3.6 3.4 3.3 3.2 3.4 3.3 3.1 3.1 3.0 Revenue of statutory unemployment insurance 2.4 2.3 1.8 1.6 1.5 1.8 1.5 1.5 1.3
thereof:
Actual social contributions 2.2 2.1 1.4 1.1 1.0 1.0 1.0 1.0 1.1 Tranfers from the government 0.2 0.2 0.4 0.5 0.5 0.7 0.5 0.4 0.2 Gross domestic product, billion euros 2 224 2 314 2 429 2 474 2 374 2 495 2 610 2 666 2 738
Source: Federal Statistical Office, national accounts, calculations of May 2014.
© DIW Berlin 2015
companies (as part of private funded security systems, or non-life insurance) or transfers from abroad carry far less weight quantitatively, and received and paid trans-fers are broadly balanced. Since 2005, total net redis-tribution has increased in relation to GDP because so-cial security benefits have declined, while the income tax burden has risen and social security contributions have remained constant.
Impact of the Tax and Transfer System
on Personal Income Distribution
The effects of the tax and transfer system on personal income distribution were analyzed on the basis of sur-vey data from the Socio-Economic Panel (SOEP) study for the income year 2011. Only monetary transfers, not non-monetary benefits of social security or other gov-ernment services were analyzed here.6 In the SOEP
6 Representing the effects of non-monetary transfers is difficult due to the challenges of quantifying these different types of transfers and attributing them to individuals. Additionally, the corresponding data in the SOEP study relating to these types of transfers is not available in full.
study, household income is recorded in a detailed form, broken down into individual components. Statements made by respondents in the 2012 SOEP study refer to the previous year’s income, i.e., to 2011. To process the data, burdens from personal income tax and social se-curity contributions are estimated using a differentiated microsimulation model based on data set information.7
The most significant components of monetary govern-ment benefits are recorded in the SOEP study (see Box). These are subdivided into insurance benefits, mean-test-ed basic security transfers, and other transfers in order to analyze the redistributive effects of the various social and economic policy functions. Social security contri-butions to employer-side and funded security systems and imputed social security contributions for civil serv-ants have been disregarded.
7 See J. Schwarze, “Simulation German income and social security tax payments using SOEP,” Cross-National Studies in Aging Program, project paper no. 19 (Syracuse, 1995).
The following income components have been identified in the analysis of personal income distribution and redistribution outlined here:
• Market income includes all earned and capital income. This includes profits from self-employment, capital income including the rental value of owner-occupied dwellings, and compensation of employees including employer-side social security contributions.1
• Gross income also includes government and private trans-fers. These are divided into the following:
– Private pensions and private transfers comprise private pensions and company pensions as well as mainte-nance payments between individuals and other private transfers.2
– Monetary social benefits from the government are subdivided into insurance benefits, means-tested basic social security transfers and other transfers.
1 Social security contributions to private funded social security systems and imputed lied social security contributions for civil servants’ have been disregarded.
2 Military and community service pay is allocated to private transfers.
– Insurance benefits consist of government and private pension income and wage replacement benefits. This includes statutory pensions, civil servants’ pensions, private pensions, company pensions, income replace-ment benefits from social security insurance and from private insurance, i.e., unemployment benefit and nursing allowance. What these benefits have in com-mon is that, in the past, they were mostly paid for by contributions, whereas benefits from statutory social insurance are also partly financed by taxes. – Other transfers comprise government transfers not
including social security. This covers family benefits, such as child and parental allowance as well as student grants, scholarships, and housing support for owner-occupiers.
– Means-tested basic social security transfers incorporate basic social security benefits (unemployment benefit II, social assistance, social assistance for elderly, income sup-port, additional child benefit, maintenance allowance) and housing benefit. These benefits are intended to secure material livelihoods and are only paid out in case of need. • Net income or disposable household income is derived by
deducting income tax and social security contributions from gross income.
Box
(deciles). Distribution measures are additionally calcu-lated for the individual income components.
As expected, market income has the highest concentra-tion. The lower income deciles mostly comprise unem-ployed persons with no or only limited earned or capi-tal income. Equally, 29 percent of tocapi-tal market income needs-weighted per capita income is calculated for each household according to the standard international needs scale (“modified OECD scale”). Accordingly, the householder receives a needs weighting of 1, any subsequent adult each have a weighting of 0.5, while children up to 14 years are given a weighting of 0.3. Table 2 shows the personal income distribution and
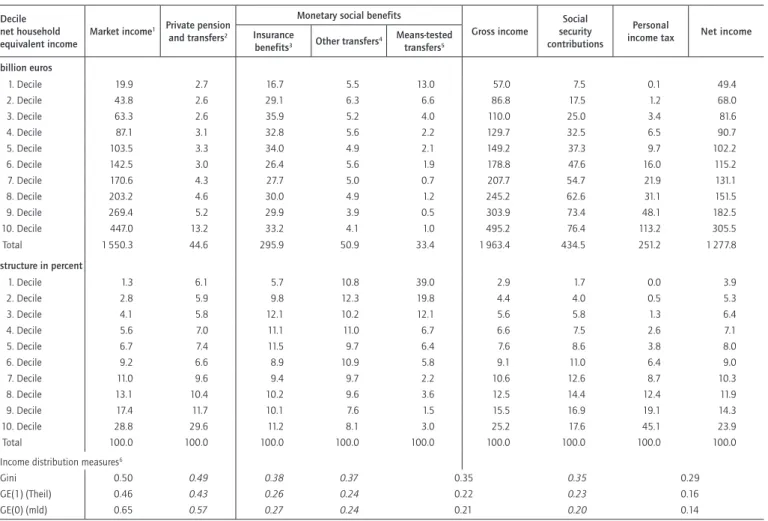
re-distribution (see Box for detailed income components) from market income to gross income (including trans-fers) to net income (less income tax and social security contributions) by income decile. The population is ar-ranged in ascending order according to net household equivalent income8 and divided into ten equal groups
8 For this purpose, all earned and capital income, including the rental value of owner-occupied dwellings, and all the household’s government and private transfer payments are summarized for the individual households; income tax and social security contributions are then deducted from these figures. Next, a Table 2
Income of private households and redistribution by the tax and transfer system 2011
Decile net household equivalent income
Market income1 Private pension
and transfers2
Monetary social benefits
Gross income security Social contributions
Personal
income tax Net income Insurance
benefits3 Other transfers4
Means-tested transfers5 billion euros 1. Decile 19.9 2.7 16.7 5.5 13.0 57.0 7.5 0.1 49.4 2. Decile 43.8 2.6 29.1 6.3 6.6 86.8 17.5 1.2 68.0 3. Decile 63.3 2.6 35.9 5.2 4.0 110.0 25.0 3.4 81.6 4. Decile 87.1 3.1 32.8 5.6 2.2 129.7 32.5 6.5 90.7 5. Decile 103.5 3.3 34.0 4.9 2.1 149.2 37.3 9.7 102.2 6. Decile 142.5 3.0 26.4 5.6 1.9 178.8 47.6 16.0 115.2 7. Decile 170.6 4.3 27.7 5.0 0.7 207.7 54.7 21.9 131.1 8. Decile 203.2 4.6 30.0 4.9 1.2 245.2 62.6 31.1 151.5 9. Decile 269.4 5.2 29.9 3.9 0.5 303.9 73.4 48.1 182.5 10. Decile 447.0 13.2 33.2 4.1 1.0 495.2 76.4 113.2 305.5 Total 1 550.3 44.6 295.9 50.9 33.4 1 963.4 434.5 251.2 1 277.8 structure in percent 1. Decile 1.3 6.1 5.7 10.8 39.0 2.9 1.7 0.0 3.9 2. Decile 2.8 5.9 9.8 12.3 19.8 4.4 4.0 0.5 5.3 3. Decile 4.1 5.8 12.1 10.2 12.1 5.6 5.8 1.3 6.4 4. Decile 5.6 7.0 11.1 11.0 6.7 6.6 7.5 2.6 7.1 5. Decile 6.7 7.4 11.5 9.7 6.4 7.6 8.6 3.8 8.0 6. Decile 9.2 6.6 8.9 10.9 5.8 9.1 11.0 6.4 9.0 7. Decile 11.0 9.6 9.4 9.7 2.2 10.6 12.6 8.7 10.3 8. Decile 13.1 10.4 10.2 9.6 3.6 12.5 14.4 12.4 11.9 9. Decile 17.4 11.7 10.1 7.6 1.5 15.5 16.9 19.1 14.3 10. Decile 28.8 29.6 11.2 8.1 3.0 25.2 17.6 45.1 23.9 Total 100.0 100.0 100.0 100.0 100.0 100.0 100.0 100.0 100.0 Income distribution measures6
Gini 0.50 0.49 0.38 0.37 0.35 0.35 0.29
GE(1) (Theil) 0.46 0.43 0.26 0.24 0.22 0.23 0.16
GE(0) (mld) 0.65 0.57 0.27 0.24 0.21 0.20 0.14
1 Wage income + bussiness income + capital income including imputed rent of owner-occupied dwelling. 2 Private pension + company pension + alimony and other transfers + military and community service pay. 3 Statutory pension + social miners insurance/civil servant/farmer/statutory accident insurance.
4 Child allowance + parental allowance + student grants and scholarships + housing support for owner-occupiers.
5 Unemployment benefit II + unemployment assistance + social assistance + housing benefit + additional child benefit + maintenance allowance. 6 Based on equivalized measurements. italic intermediate results refer to income including the foregoing transfers respectively taxes.
Source: Calculations based on wave 2012 of the Socio-Economic Panel (SOEP), Distribution v29.
© DIW Berlin 2015
is found in the upper income decile. The (equivalized) Gini coefficient of market income is 0.50. The income share of the bottom two deciles is higher for private pen-sions and transfers than for market income. This is be-cause the lower deciles are largely populated by individ-uals of retirement age. If private pensions and transfers are added to market income, the measured inequality is only slightly lower.
As already demonstrated, insurance-related benefits have a dominant weighting in the government’s trans-fer system. Unlike market income, these transtrans-fers are largely evenly distributed across the needs-weighted household net income deciles; only in the lowest decile is their share below average. Due to the extensive equiv-alence principle in social security insurance, the amount of benefits received largely depends on contributions paid, so higher contributions mean larger pensions. However, benefits are restricted due to the contribution assessment ceiling. Accordingly, compared to market income, insurance-related social security benefits are far lower in the upper deciles than in the lower income groups. As a result of this “progressive” redistributive effect and the high volume of insurance-related social security benefits, the Gini coefficient of market income, which is higher due to insurance benefits and private pensions and transfers, decreases to 0.38.
As far as there are equivalent insurance contributions for social security benefits, there is, however, no redis-tribution between individuals or generations over time. Nevertheless, a significant degree of statutory social se-curity benefits are financed through federal grants. In recent years, in fact, these grants made up just under one-third of revenue from pension insurance, and a good tenth of unemployment insurance (see Table 1). As a re-sult, a corresponding proportion of benefits is financed by taxes and must therefore be attributed to the core ar-eas of the tax and transfer system.9
Other transfers are considerably lower in volume. Since they are not means-tested, they do not trigger strong redistributive effects. They are also distributed fairly equally across the deciles, with slightly higher shares in the lower income groups and lower shares in the high-er income deciles. This is mainly due to the high im-portance of family-related benefits among these trans-fers, particularly for child benefit. A high redistributive impact from top to bottom, on the other hand, can be seen in basic social security benefits granted in needy cases only. This occurs predominantly in the lowest
in-9 See the in-depth analysis by I. Stolz, Einkommensumverteilung in der Bundesrepublik Deutschland. Eine theoretische und empirische Untersuchung (Campus, 1983).
come decile and has no appreciable significance above the median income.10
Thanks to these transfers, the distribution of gross in-come is considerably more uniform than the distribu-tion of market income. The Gini coefficient is reduced to 0.35. These transfers substantially increase market income in the bottom half of the income distribution. This effect is lessens as income increases. For middle income groups and above, income shares for gross in-come are lower than for market inin-come.
Social security contributions and income tax reduce the disposable income of individual households. While so-cial security contributions do not cause any apprecia-ble redistribution as these tend to be regressive once the contribution ceiling is reached, personal income tax, in particular, is highly progressive. For this reason, high-er incomes are subject to greathigh-er income tax burdens. The top decile accounts for 45 percent of total income tax revenue. Overall, the Gini coefficient is reduced to 0.29 for net income.
The redistributive effects of the tax and transfer system lead to a far more uniform distribution of net income compared to market income. While the lower income groups’ income share increases up to the sixth decile, in the upper deciles it decreases progressively. In other words: the lower 60 percent of income distribution re-ceive money on balance from the government, where-as the top 40 percent pay money to the government on balance. This does not include non-monetary transfers by the government, although their distribution impact is not likely to be fundamentally different from the ef-fects observed here.11
Additionally, our breakdown of the individual compo-nents shows that the redistributive effect of the German tax and transfer system is reduced considerably if only basic security benefits, social security contributions and income taxes are included. This is because, insurance benefits from statutory social security are especially im-portant to the redistribution of market income. The Gini coefficient of market income extended to include corre-sponding insurance benefits is only 0.38, compared with
10 Shares in the upper deciles are either measurement errors or refer to individuals who only drew benefits in the previous year on a monthly pro rata basis. Additionally, a differentiation must be made between communities of dependence that are eligible for means-tested basic social security benefits and individual households, because a community of dependence may exist within an individual household, for instance an elderly person eligible for basic social security who lives in a household with his or her adult children.
11 The situation is quite different with public assistance, e.g., for cultural institutions that disproportionately benefit upper income earners. The last comprehensive quantification of the various government transfers was conducted under the direction of DIW Berlin President, Hans-Jürgen Krupp, as part of the Transfer Enquete Commission (1981).
Table 3). In contrast, civil servants’ pensions are found mainly in the upper third of the income distribution. This is explained by the fact that average civil servants’ pensions are considerably higher than statutory insur-ance pensions. Other insurinsur-ance benefits, such as un-employment benefit, nursing allowance, and other addi-tional transfers are distributed much more evenly across the entire population.
Child Benefit Widespread Throughout
the Population
Child benefit is assigned to other government bene-fits (see Table 4). It is granted regardless of the finan-cial means of the parents and is distributed correspond-ingly evenly across all income groups.12 Conversely, the
amount of parental allowance is dependent on the
in-12 The share is slightly higher in the first four deciles because there are many family households in these deciles.
0.50 for market income only. Total redistribution up to net income, with a Gini coefficient of 0.29, is therefore reduced by 0.12 points of the Gini coefficient, which corresponds to 58 percent based on the total redistribu-tion of 0.21 points of the Gini coefficient from market income up to net income. The redistribution of the re-maining 0.09 points of the Gini coefficient, or 42 per-cent of the total redistribution volume is mainly due to means-tested basic social security transfers and the pro-gressive income tax. Other transfers and social securi-ty contributions, for their part, barely affect relative in-come distribution.
Civil Servants’ Pensions Primarily
in the Top Third of the Distribution
The structure of insurance benefits indicates that stat-utory pensions benefit the middle and lower half of the income distribution because older people are located primarily in these areas of the income hierarchy (see Table 3
Insurance benefits of statutory social security and civil servant pensions 2011
Decile net household equivalent income Statutory pension1 Civil servant pension (own pension) Unemployment
benefit Nursing allowance Other2 Own pension Widow/orphans pension
billion euros 1. Decile 13.29 2.39 2.45 0.64 0.10 0.30 2. Decile 23.28 4.18 0.67 0.36 0.52 3. Decile 28.64 4.97 0.98 0.70 0.28 4. Decile 25.58 3.84 1.23 0.40 0.75 5. Decile 27.52 3.38 0.75 0.67 0.80 6. Decile 19.63 2.26 2.05 0.54 1.26 0.69 7. Decile 17.82 2.88 4.75 0.66 0.29 1.33 8. Decile 17.41 1.72 8.63 0.89 0.56 0.84 9. Decile 14.21 1.52 11.75 0.50 0.65 1.28 10. Decile 14.98 0.82 14.98 0.75 0.50 1.13 Total 202.36 27.97 44.61 7.59 5.49 7.91 structure in percent 1. Decile 6.6 8.6 5.5 8.4 1.9 3.7 2. Decile 11.5 14.9 8.8 6.6 6.5 3. Decile 14.2 17.8 12.8 12.7 3.6 4. Decile 12.6 13.7 16.1 7.2 9.4 5. Decile 13.6 12.1 9.8 12.1 10.1 6. Decile 9.7 8.1 4.6 7.2 23.0 8.7 7. Decile 8.8 10.3 10.7 8.6 5.3 16.8 8. Decile 8.6 6.1 19.3 11.7 10.2 10.6 9. Decile 7.0 5.4 26.3 6.6 11.9 16.2 10. Decile 7.4 2.9 33.6 9.9 9.2 14.3 Total 100.0 100.0 100.0 100.0 100.0 100.0
1 Including social miners insurance pension and farmer pension.
2 Statutory accident insurance pension (including widows/orphans statutory accident insurance) + subsistence allowance + widows/orphans civil servant pension. Source: Calculations based on wave 2012 of the Socio-Economic Panel (SOEP), Distribution v29.
© DIW Berlin 2015
come earned before the birth of a child;13 accordingly,
the middle class profits from this benefit above aver-age. In contrast, student grants (BaföG) and scholar-ships primarily benefit the lower half of the income distribution. For BaföG, this is due to means testing. The grant scheme for housing support of owner-occu-piers (Eigenheimzulage), which expired in 2006 but which can still be drawn by entitled households for up to eight years, is found mainly in the upper half of the income distribution. Means-testing was carried out for these transfers to a limited extent only, since mar-ried couples with positive income of up to 140 000 eu-ros (plus 30 000 eueu-ros per child) were also eligible for these grants.
13 Parents with a taxable income of 500 000 euros or more are no longer entitled to parental allowance.
Basic Social Security Benefits Targeted
to the Needy
Means-tested basic social security benefits are only granted once the financial circumstances of the individ-uals or households (communities of dependence) have been suitably checked and those individuals or house-holds are deemed eligible for social assistance. Hence, more than 40 percent of housing benefit or unemploy-ment benefit II, for instance, is found in the first in-come decile (see Table 5). If we look at the first three deciles, almost 80 percent of these transfers were made to this population group. Despite the majority of social assistance and social assistance for the elderly being paid out to the lower half of the income distribution, a number of transfer recipients can also be found in the upper half. This can probably be explained by the fact that individual households may comprise various communities of dependence that do not have a direct financial obligation towards one another, such as adult children who live in the same household with needs-entitled parents.
Conclusion
Monetary and non-monetary social security benefits paid by the government made up 24 percent of GDP (2013), a total of 665 billion euros. Compared to 2005, this share has fallen by two percentage points. Since 2005, total income redistribution has increased in rela-tion to GDP because monetary social security benefits have declined, while the income tax burden rose and social security contributions remained constant in re-lation to GDP.
Overall, the monetary redistributive effects of the tax and transfer system have led to a far more uniform dis-tribution of net income compared to market income. As a result, in 2011, the (equivalence-weighted) Gini coefficient fell from 0.5 for market income to 0.29 for household disposable income. The social security sys-tem makes up a considerable share of overall govern-ment redistribution because more than half of the re-duction in inequality is due to social security benefits. Although there are equivalent insurance contributions for these benefits, there is, however, ultimately no redis-tribution between individuals or generations over time. This does not apply to “non-contribution-backed ben-efits”, i.e., social security benefits for which no corre-sponding contributions were levied. These are financed for the most part by government grants that, in turn, are funded by general tax revenues. Overall, the redis-tributive effect of the German tax and transfer system is reduced considerably if only basic social security ben-efits, social security contributions and income taxes are included.
Table 4
Other transfers 2011
Decile net household
equivalent income allowanceChild allowanceParental Students grants
Housing support for owner-occupiers Other1 billion euros 1. Decile 4.15 0.31 0.88 0.07 0.10 2. Decile 4.80 0.32 0.92 0.01 0.22 3. Decile 4.02 0.35 0.66 0.13 0.04 4. Decile 4.15 0.68 0.43 0.12 0.24 5. Decile 3.77 0.50 0.16 0.24 0.24 6. Decile 3.94 0.82 0.45 0.32 0.03 7. Decile 3.48 0.62 0.51 0.22 0.12 8. Decile 3.41 0.58 0.37 0.45 0.08 9. Decile 3.02 0.30 0.18 0.36 0.04 10. Decile 3.12 0.57 0.06 0.34 0.03 Total 37.86 5.05 4.60 2.26 1.13 structure in percent 1. Decile 11.0 6.1 19.0 3.2 8.4 2. Decile 12.7 6.2 19.9 0.5 19.2 3. Decile 10.6 7.0 14.3 5.9 3.9 4. Decile 11.0 13.4 9.4 5.1 21.2 5. Decile 10.0 10.0 3.5 10.6 21.2 6. Decile 10.4 16.2 9.8 14.1 2.6 7. Decile 9.2 12.2 11.0 9.8 10.8 8. Decile 9.0 11.6 8.0 19.8 6.7 9. Decile 8.0 5.9 3.9 15.8 3.6 10. Decile 8.2 11.4 1.2 15.3 2.3 Total 100.0 100.0 100.0 100.0 100.0
1 Advanced child maintenance payment + widows/orhans wavictim pension.
Source: Calculations based on wave 2012 of the Socio-Economic Panel (SOEP), Distribution v29.
© DIW Berlin 2015
Government redistribution measures in the form of non-monetary transfers and indirect taxes are not included in the net incomes analyzed here. Since the latter have a regressive burden effect on current income, i.e., the lower income groups are burdened relatively more than the upper income groups,14 the redistributive impact of
the tax and transfer system is reduced slightly. In addition to the overall redistributive effect, there is also the issue of how accurately government transfers are targeted. If these only benefit the financially needy, only the lowest deciles are likely to receive these trans-fers. Child benefit, however, is widespread across the entire population. It was primarily the upper income groups that benefitted from the (now expired) housing support for owner-occupiers (Eigenheimzulage). Attention should be focused on the aspects of accurate-ly targeting social mobility and equal opportunities, since these objectives may not necessarily be achieved by purely monetary means. In fact, child care and the education system play an important role in increasing equal opportunities long-term, promoting upward mo-bility, and reducing inequality.
14 B. Beimann, R. Kambeck, T. Kasten, and L-H. Siemers, “Wer trägt den Staat? Eine Analyse von Steuer- und Abgabenlasten,” RWI position, no. 43 (April 1, 2011); OECD, “The distributional effects of consumption taxes in OECD countries,” OECD Tax Policy Studies, no. 22 (2011).
Stefan Bach is Research Associate in the Public Economics Department at DIW Berlin | [email protected]
Markus Grabka is Research Associate in the Research Infrastructure Socio-Economic Panel (SOEP) at DIW Berlin | [email protected]
Erik Tomasch is Student Assistant in the Public Economics Department at DIW Berlin | [email protected]
JEL: H24, H55, D31
Keywords: Redistribution of taxes and transfers, income distribution, SOEP
Table 5
Means-tested transfers 2011
Decile net household equivalent income Housing benefit Social assistance Social assistance for elderly Unemloyment benefit II + additional child benefit billion euros 1. Decile 0.85 0.39 0.96 10.80 2. Decile 0.53 0.23 0.41 5.42 3. Decile 0.21 0.43 0.36 3.02 4. Decile 0.14 0.18 0.52 1.41 5. Decile 0.17 0.99 0.52 1.08 6. Decile 0.13 0.55 1.06 7. Decile 0.14 0.44 8. Decile 0.48 0.54 9. Decile 0.90 0.51 10. Decile Total 2.02 2.22 4.83 24.29 structure in percent 1. Decile 41.9 17.8 19.8 44.5 2. Decile 26.1 10.5 8.4 22.3 3. Decile 10.5 19.2 7.5 12.4 4. Decile 6.7 7.9 10.8 5.8 5. Decile 8.3 44.6 10.7 4.4 6. Decile 6.6 11.5 4.4 7. Decile 2.9 1.8 8. Decile 9.9 2.2 9. Decile 18.6 2.1 10. Decile Total 100.0 100.0 100.0 100.0
Source: Calculations based on wave 2012 of the Socio-Economic Panel (SOEP), Distribution v29.
© DIW Berlin 2015
DIW Berlin — Deutsches Institut für Wirtschaftsforschung e. V. Mohrenstraße 58, 10117 Berlin T + 49 30 897 89 – 0 F + 49 30 897 89 – 200 Publishers
Prof. Dr. Pio Baake Prof. Dr. Tomaso Duso Dr. Ferdinand Fichtner Prof. Marcel Fratzscher, Ph.D. Prof. Dr. Peter Haan Prof. Dr. Claudia Kemfert Dr. Kati Krähnert Prof. Karsten Neuhoff, Ph.D. Dr. Kati Schindler Prof. Dr. Jürgen Schupp Prof. Dr. C. Katharina Spieß Prof. Dr. Gert G. Wagner
Editors in chief Sabine Fiedler Dr. Kurt Geppert Editorial staff Renate Bogdanovic Andreas Harasser Sebastian Kollmann Dr. Claudia Lambert Dr. Anika Rasner Dr. Wolf-Peter Schill Translation HLTW Übersetzungen GbR [email protected]
Layout and Composition
eScriptum GmbH & Co KG, Berlin
Press office
Renate Bogdanovic Tel. +49 - 30 - 89789 - 249 presse @ diw.de
Sale and distribution
DIW Berlin
Reprint and further distribution — inclu- ding extracts — with complete reference and consignment of a specimen copy to DIW Berlin's Communication Department ([email protected]) only. Printed on 100 % recycled paper.