Activation induced changes in GABA: functional MRS at 7 T with MEGA-sLASER Chen Chen1, Hilmar Sigurdsson2, Sophia Pépés2, Dorothee Auer3, Peter Morris1, Paul S. Morgan3, Penny Gowland1 and Stephen Jackson2
1Sir Peter Mansfield Imaging Centre, University of Nottingham, Nottingham, United Kingdom 2School of Psychology, University of Nottingham, Nottingham, United Kingdom
3School of Medicine, University of Nottingham, Nottingham, United Kingdom
Address correspondence to: Dr. Chen Chen
Sir Peter Mansfield Imaging Centre School of Physics and Astronomy University of Nottingham
University Park, Nottingham NG7 2RD, United Kingdom
Word count: xxxx
Running title: Activation induced changes in GABA
ABSTRACT Purpose: xxx
Methods: xxx
Results: xxx
Conclusion: xxx
INTRODUCTION
Functional magnetic resonance spectroscopy (fMRS) is a powerful tool for probing human brain metabolism non-invasively by investigating the metabolic change in response to a physiological stimulus. With the benefits of increased SNR and spectral dispersion, recent fMRS studies at ultra-high field (7 T) have measured activation-induced neurochemical responses occurred during the stimulation of the human visual cortex (1–7) and motor cortex (8). Increases in glutamate (Glu) and lactate (Lac) concentration observed upon visual or motor activation were consistent across these recent studies, despite of the variation in the percentage of changes. Some studies also reported an increase in aspartate (Asp) and a tendency for a decrease in glucose (Glc) level during visual stimulation (1; 3; 5). These observed changes of metabolite concentrations imply an overall rise in oxidative metabolism and the malate-aspartate shuttle activity during neuronal activation. However, the functional response of γ-aminobutyric acid (GABA), the primary inhibitory neurotransmitter in the brain, is still not well characterised dynamically. Lin et al. (3) has reported a tendency for an increase in GABA levels during visual activation compared to the initial resting state level, while a more recent study by Mekle et al. (7) detected a significant decrease in steady-state GABA levels during visual activation when comparing the activation voxel with a control voxel.
accuracy of GABA quantification by minimising the macromolecular (MM) contamination in the edited signal, the Henry method (14; 24), a T1-insensitive MM-eliminating approach, is favoured and incorporated into the MEGA-sLASER sequence used in this study. It eliminates the co-edited MM signal at 3.0 ppm by applying editing pulses at 1.5 ppm for OFF scans, which are symmetrically around the 1.7 ppm MM signal as compared to ones applied at 1.9 ppm for ON scans. To the best of our knowledge, no previous fMRS study has investigated the feasibility of using MM-eliminated MEGA-sLASER sequence to reveal the dynamic changes in GABA at 7 T.
GABAergic system is involved in modulation of many important physiological processes, such as motor control and pain (25–27), and dysfunction in the system has been implicated in pathological processes underlying many neurological and psychiatric conditions, such as autism, Tourette syndrome, and schizophrenia (28). One 1H MRS study reported lowered resting state GABA concentration in the auditory cortex of autism patients (29). Inconsistent findings have been reported for the resting state GABA level measured using 1H MRS in Tourette syndrome patients (30–32) and schizophrenia patients (33; 34) compared to healthy controls. Some argue that 1H MRS-measured GABA is a better marker of GABAergic tone (i.e. levels of ‘tonic’ inhibition) rather than of inhibitory activity (i.e. levels of ‘phasic’ inhibition) (28; 35; 36). Recently, an fMRS study has reported weaker glutamatergic responses in the anterior cingulate cortex of schizophrenia patients to a colour-word Stroop Task (37). The dynamic measurement of GABA levels with fMRS may have the potential to provide unique information on the dynamic nature of GABAergic activities or abnormalities.
Therefore, this study aims to determine the dynamic changes in GABA levels in response to motor activation in healthy subjects using the enhanced sensitivity of a MM-eliminated MEGA-sLASER sequence at 7 T.
METHODS
Sixteen healthy volunteers (age: 26±3 years, 8 males) participated in this study. Written informed consent was given by all subjects prior to MR measurements. This study was approved by the Medial School Ethical Committee of the University of Nottingham.
Stimulation paradigm
when intermittently flashing green circle (visible for 0.7 s and invisible for 32 s) presented on the screen (task-period), and to relax their hands when stationary red circle appeared (rest-period). The functional paradigm for fMRI scan consisted of eight cycles of rest-period (32 s) followed by task-period (8 s). For the fMRS scans, the rest-period of 5 min was followed by a task-period of 10 min and then a rest-period of 5 min (Rest-Task-Rest). To guarantee the good understanding of the functional paradigm, a practice session outside the scanner was carried out beforehand. To reduce the noise and minimize motion, foam padding was placed between participants’ heads and the head coil.
MR measurements
All MR measurements were performed on a 7 T Philips Achieva scanner (Philips Medical Systems, Best, Netherland) equipped with a 32-channel receive head coil and a surrounding volume transmit (maximum B1 = 15 µT). The BOLD-fMRI T2*-weighted images were acquired using a single shot gradient echo EPI sequence (TE/TR = 25/2000 ms, matrix size = 128 × 128, FOV = 208 × 192 mm3, 30 slices, slice thickness = 3 mm, 160 dynamics). BOLD responses were analysed online to localise the volume with the optimal response in the left primary motor cortex for placement of the spectroscopic voxel in the functional MRS scans. High resolution 3D T1-weighted MPRAGE images (1 mm3 isotropic resolution, matrix size = 256 × 256 × 180, TE/TR/TI = 3.5/7.3/987 ms, FA = 8°, shot interval = 2 s, SENSE factor = 2) were acquired for tissue segmentation and for checking the position of the spectroscopic voxel based on anatomical structure. 1H spectra were continuously acquired during the functional paradigm using the MM-eliminated MEGA-sLASER sequence (TR/TE = 5000/72 ms, voxel size = 15 × 20 × 30 mm3, spectral bandwidth = 4000 Hz, samples = 4096, phase cycle step = 2, 240 scans, 20 min). VAPOR (variable pulse power and optimised relaxation delay) scheme (39) was used for water suppression, and B0 shimming of the voxel with second-order shim fields was performed automatically by the Philips pencil beam volume algorithm, similar to the FASTMAP method (40).
was centred at 1.9 ppm and 1.5 ppm, respectively, for the ON and the OFF scan, in order to obtain GABA signals in the edited spectra (ON – OFF scans) with MM contamination eliminated. The ON and OFF scans were performed in an interleaved manner to minimise the impact of the phase and frequency instability on the edited spectra. The editing efficiency of this MEGA-sLASER was assessed based on the in vitro spectra (TR = 10 s, 16 scans) acquired from an isotropic volume of 27 ml in the centre of a sphere phantom with 200 mM GABA. To
demonstrate the performance of MM-elimination, edited spectra were acquired from the same motor voxel (15 × 20 × 30 mm3) in one subject using MEGA-sLASER (TR = 5 s, 60 scans, 5 min) with and without the MM-elimination scheme for comparison.
Data analysis
The spectral editing data was processed using an in-house-developed routine built based on a MATLAB (The MathWorks Inc., Natick, MA, USA) data analysis toolbox (available at
https://github.com/chenkonturek/MRS_MRI_libs), prior to metabolite quantification using LCModel (41). The raw signals from the multiple channels were combined based on an
optimised weighting scheme (42) and phase corrected. Spectra were frequency aligned with the choline signal at 3.2 ppm, before the subtraction and the sum of the OFF scans from the ON scans, which results in the edited spectra and sum spectra, respectively. The motion-corrupted data were identified and discarded. For individual analysis, after performing a moving average with a window size of 40 scans (200 s) and step size of 20 scans (100 s), 11 data points for each individual subject were obtained for the metabolite quantification. For group analysis, after frequency alignment across subjects (number of subjects = 14), the group-mean spectra with the same temporal resolution were also obtained for the metabolite quantification. Data from two subjects were discarded for analysis, due to artefacts possibly induced by poor water
suppression. Data from one additional subject was discarded for individual analysis, due to low SNR (mean SNR of tCr < 30), which substantially increased the quantification uncertainty (mean CRLB is > 40%) for GABA time course for that subject.
since the edited spectrum had flat baseline. The total creatine (tCr, i.e. PCr + Cr) was chosen as an internal reference for quantification, due to its relatively high and stable concentration in the human brain (44). The tCr was quantified from the sum spectra using LCModel with a basis set of simulated spectra of five metabolites (Cr, PCr, choline (Cho), phosphocholine (PCho) and NAA) and default parameter settings. In addition, the GABA/tCr ratios quantified using this approach was also compared to ones determined using the AMARES algorithm (45) in the jMRUI software, where the 3.0 ppm GABA resonance in edited spectra and the 3.0 ppm tCr singlet in the sum spectra were simply fitted as single Lorentzian peaks (46).
The relative changes in GABA/tCr, Glx/tCr, NAA/tCr signal ratios with respective to the baseline (mean of the first two time points) were calculated for individual and group metabolite time courses. Statistical significance of metabolite changes from the baseline was inferred by two-tailed paired t-tests based on all individuals’ metabolite time courses. For each time point in the metabolite group time course, Monte Carlos simulation was performed based on the
corresponding quantification error, estimated by Cramér–Rao lower bounds (CRLBs), to statistically test the significance of the change relative to the baseline.
RESULTS
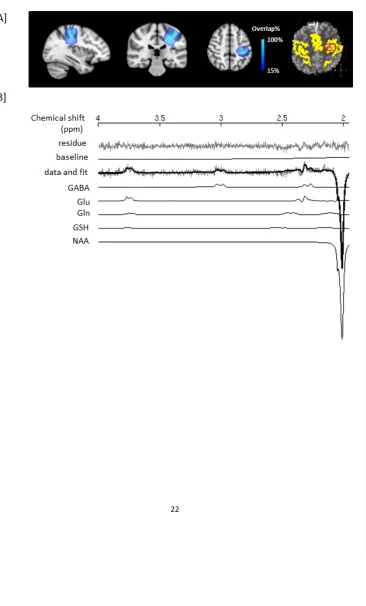
Figure 2[A] shows the in vitro edited spectrum of GABA, resulting from the subtraction of the acquired OFF spectrum (J-modulation undisturbed) from the ON spectrum (3.0 ppm GABA pseudo-triplet is J-refocused). Based on these phantom data, the editing efficiency of the MEGA-sLASER sequence for GABA measurement was 0.48, determined as a peak area ratio of the edited and J-coupling refocused 3.0 ppm GABA signals per unit time. Figure 2[B] shows that the 3.0 ppm GABA signal with MM-contamination in the edited spectrum is about 1.6-fold larger than the one with MM-elimination, indicating that the undesired MM contribution (~38%) at 3.0 ppm was successfully corrected. The absence of residual signal from Cho resonance at 3.2 ppm indicated good singlet elimination and thus a reliable editing performance.
individuals’ time points (11 points × 13 subjects), GABA, Glx, and NAA were quantified from the edited spectra with mean CRLBs of 17%, 9% and 1%, respectively. The group-mean edited spectra allowed the quantification of GABA and Glx with CRLBs of 7% and 3%, respectively.
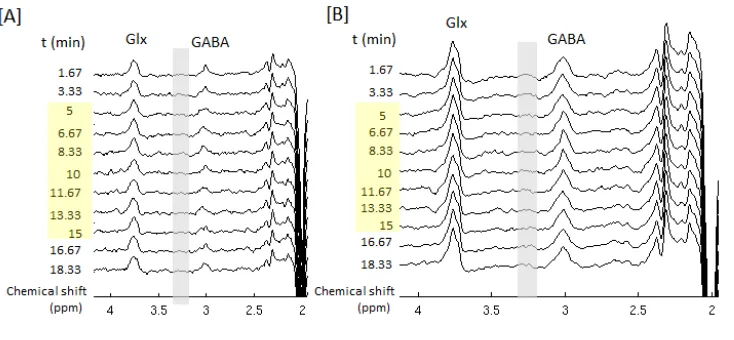
Figure 4 shows the time course of an individual’s edited spectra and the group-mean spectra obtained during the functional paradigm, which were used for metabolite quantification. The clean baseline and well-resolved 3.0 ppm GABA signal in each edited spectrum (3.3 min) imply the consistent and highly efficient performance of the MEGA-sLASER editing sequence. The coefficient of variation (CV) of GABA/tCr measured at baseline (first two time points, 13 subjects) across subjects was 18% using LCModel analysis and 20% using AMARES algorithm,
indicating good reproducibility of both methods. In addition, the GABA/tCr levels (11 time points, 13 subjects) quantified with these two approaches were highly correlated (P = 7e-16), indicating the good consistency in quantification. The baseline GABA/tCr concentration ratio ([GABA]/[tCr]) was calculated to be 0.11±0.02, based on the 3.0 ppm GABA/tCr signal ratios obtained using AMARES approach and the correction of editing efficiency as described in Terpstra et al. (47). Assuming a creatine concentration of 6.7 mM, an estimate based on voxel tissue composition and its concentration in GM and WM (48), the average baseline, resting GABA concentration ([GABA]) would be 0.72±0.14 mM and 0.82±0.16 mM, prior to and after the relaxation correction with T1 and T2 values at 7 T (49), respectively.
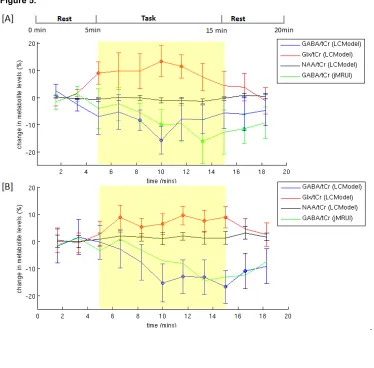
Figure 5[A] shows the mean of individual time courses of changes in metabolite levels with respective to the baseline. Based on the time points with statistically significant change (P < 0.05) upon activation, an average decrease of 12±5% in GABA/tCr levels and an average increase of 11±5% in Glx/tCr levels from the baseline were found in the motor cortex during a 10-min hand-clenching task. In contrast, no statistically significant change was observed in NAA/tCr and tCr levels. Consistent with LCModel results, a significant decrease of 13±7% was found in GABA/tCr using AMARES approach. In addition, no statistically significant change in linewidth or peak height of tCr resonance at 3.0 ppm were found between activation and baseline (%change in linewidth ~ 0.4%, P = 0.7; %change in height ~0.5%, P = 0.5).
in the time course of the edited GABA signals at 3.0 ppm in Figure 4[B], since there is no significant change in tCr signals from baseline.
DISCUSSION
This study has shown the efficiency and consistent performance of the MM-eliminated MEGA-sLASER sequence implemented for selective detection of GABA at 7 T. With the benefits of using broadband slice-selective pulses and ultra-high field, the GABA editing efficiency of this developed MEGA-sLASER sequence (Eeff = 0.48) is higher than the MEGA-PRESS sequence at 7 T (Eeff = 0.36) (47) and MEGA-SPECIAL at 3T (Eeff = 0.45) (46), although it is lower than the other group’s MEGA-sLASER sequence (Eeff = 0.52) used on a 7 T system with higher RF power capacity (20 μT) (14). The high efficiency of this spectral editing sequence has allowed the use of a relatively small voxel size (9 ml) to increase the overlapping volume with the activated region in the motor cortex, as well as a reasonable time resolution (moving step of 100 s) for a functional study. The editing performance was shown to be quite consistent over the scan time of 20 mins, evidenced by the clean baseline and the stable NAA signals in the edited spectra, indicating relatively good frequency stability. Different from using dual-band pulses for editing (14), the bandwidth and off-resonance frequency of the single-band MEGA-editing pulses in this MEGA-sLASER sequence can be adjusted flexibly to perform spectral editing for another type of metabolite, such as Lac and GSH, without hard-coding a new pulse into the system.
studies have reported higher [GABA] in GM than in WM from sensorimotor regions and frontal lobes (55; 58).
Among different metabolite quantification tools, such as jMRUI, LCModel, TARQUIN (59) and Gannet (60), LCModel has previously shown to provide the best reproducibility for GABA quantification with MEGA-PRESS data (20; 21). This study has shown that the GABA levels quantified using jMRUI and LCModel were highly correlated, while LCModel offers slightly lower inter-subject CV%. However, the benefits of using jMRUI (AMARES algorithm) are the
transparency and simplicity. In addition, several previous short TE fMRS studies have observed a BOLD effect on the linewidth and thus the peak height of tCr of 3% (61), 2% (4; 8), and more recently 0.5% (7) during the activation period, whereas the BOLD-related change found in this long TE fMRS study was small and statistically insignificant (~ 0.5% for tCr peak height), despite of good shimming.
This study has shown the feasibility of the detection of dynamic changes in GABA/tCr during a functional paradigm using a spectral editing sequence with high efficiency and sensitivity at 7 T. A significant decrease of 12±5% in GABA/tCr from the baseline was found during the 10 min task-period from the resting baseline level. In most previous fMRS studies, which use the conventional short TE direct detection methods, no significant alternation in GABA levels have been reported upon visual or motor activation (1–6). One study found a reduction in the steady-state GABA concentration of 5% in response to visual stimulation when compared to a control voxel (7). In addition, despite that the sequence used in this study was not optimal for the detection of Glu and Gln, an activation-induced increase in Glx/tCr (11±5%) was observed, which is higher but consistent with those previously reported for Glu/tCr (5±1% (6), 4±1% (61), 3±1% (5), 2±1% (8)). [Stephen/Hilmar: add a bit more about the possible interpretation] The observed xxx can be interpreted xxx
Along with the advantage of providing well-resolved GABA signals, which allows the direct visual inspection of dynamic changes in GABA levels, there are also a few drawbacks associated with spectral editing methods for fMRS studies. Firstly, the number of metabolites that can be simultaneously edited is limited. Recently, Saleh et al. has demonstrated the possibility to co-editing multiple metabolites by using the Hadamard Encoding and
scheme involved in spectral editing makes it susceptible to motion-induced artefacts. To reduce the number of spectra to be discarded due to motion-corruption, the ON and OFF scans were implemented in an interleaved manner and small but sufficient steps of phase cycling were used.
CONCLUSION
REFERENCE
1. Bednařík P, Tkáč I, Giove F, DiNuzzo M, Deelchand DK, Emir UE, Eberly LE, Mangia S. Neurochemical and BOLD Responses during Neuronal Activation Measured in the Human Visual Cortex at 7 Tesla [Internet]. J. Cereb. Blood Flow Metab. 2015 Apr;35(4):601–610.[cited 2017 Feb 18 ] Available from:
http://www.ncbi.nlm.nih.gov/pubmed/25564236
2. Mangia S, Tkáč I, Gruetter R, Van De Moortele P-F, Giove F, Maraviglia B, Uğurbil K. Sensitivity of single-voxel 1H-MRS in investigating the metabolism of the activated human visual cortex at 7 T [Internet]. Magn. Reson. Imaging 2006 May;24(4):343–348.[cited 2017 Feb 18 ] Available from: http://www.ncbi.nlm.nih.gov/pubmed/16677939
3. Lin Y, Stephenson MC, Xin L, Napolitano A, Morris PG. Investigating the Metabolic Changes due to Visual Stimulation using Functional Proton Magnetic Resonance Spectroscopy at 7 T [Internet]. J. Cereb. Blood Flow Metab. 2012 Aug;32(8):1484– 1495.[cited 2017 Feb 18 ] Available from: http://www.ncbi.nlm.nih.gov/pubmed/22434070
4. Mangia S, Tkác̆ I, Logothetis NK, Gruetter R, Van de Moortele P-F, Uğurbil K. Dynamics of lactate concentration and blood oxygen level-dependent effect in the human visual cortex during repeated identical stimuli [Internet]. J. Neurosci. Res. 2007
Nov;85(15):3340–6.[cited 2017 Feb 18 ] Available from: http://www.ncbi.nlm.nih.gov/pubmed/17526022
5. Mangia S, Tkáč I, Gruetter R, Van de Moortele P-F, Maraviglia B, Uğurbil K. Sustained Neuronal Activation Raises Oxidative Metabolism to a New Steady-State Level: Evidence from 1H NMR Spectroscopy in the Human Visual Cortex [Internet]. J. Cereb. Blood Flow Metab. 2007 May;27(5):1055–1063.[cited 2017 Feb 18 ] Available from:
http://www.ncbi.nlm.nih.gov/pubmed/17033694
6. Bednařík P, Tkáč I, Deelchand D, Barreto F, Eberly LE, Michaeli S, Mangia S. Functional MRS at 7T and long TE. In: Proc. Intl. Soc. Mag. Reson. Med. 2016 p. 3351.
7. Mekle R, Kühn S, Pfeiffer H, Aydin S, Schubert F, Ittermann B. Detection of metabolite changes in response to a varying visual stimulation paradigm using short-TE 1H MRS at 7 T [Internet]. NMR Biomed. 2017 Feb;30(2):e3672.[cited 2017 Feb 18 ] Available from: http://doi.wiley.com/10.1002/nbm.3672
Chen Chen 20/2/2017 20:10
8. Schaller B, Xin L, O’Brien K, Magill AW, Gruetter R. Are glutamate and lactate increases ubiquitous to physiological activation? A 1H functional MR spectroscopy study during motor activation in human brain at 7Tesla [Internet]. Neuroimage 2014 Jun;93(P1):138– 145.[cited 2017 Feb 18 ] Available from:
http://linkinghub.elsevier.com/retrieve/pii/S1053811914001153
9. Tkáč I, Öz G, Adriany G, Uğurbil K, Gruetter R. In vivo 1H NMR spectroscopy of the
human brain at high magnetic fields: Metabolite quantification at 4T vs. 7T [Internet]. Magn. Reson. Med. 2009 Oct;62(4):868–879.[cited 2017 Feb 18 ] Available from: http://www.ncbi.nlm.nih.gov/pubmed/19591201
10. Tkác I, Andersen P, Adriany G, Merkle H, Ugurbil K, Gruetter R. In vivo 1H NMR spectroscopy of the human brain at 7 T. [Internet]. Magn. Reson. Med. 2001 Sep;46(3):451–6.[cited 2017 Feb 18 ] Available from:
http://www.ncbi.nlm.nih.gov/pubmed/11550235
11. Mekle R, Mlynárik V, Gambarota G, Hergt M, Krueger G, Gruetter R. MR spectroscopy of the human brain with enhanced signal intensity at ultrashort echo times on a clinical platform at 3T and 7T [Internet]. Magn. Reson. Med. 2009 Jun;61(6):1279–1285.[cited 2017 Feb 18 ] Available from: http://www.ncbi.nlm.nih.gov/pubmed/19319893
12. Govindaraju V, Young K, Maudsley AA. Proton NMR chemical shifts and coupling constants for brain metabolites. [Internet]. NMR Biomed. 2000 May;13(3):129–53.[cited 2017 Feb 18 ] Available from: http://www.ncbi.nlm.nih.gov/pubmed/10861994
13. de Graaf RA. In Vivo NMR Spectroscopy [Internet]. Chichester, UK: John Wiley & Sons, Ltd; 2007.[cited 2017 Feb 18 ] Available from:
http://doi.wiley.com/10.1002/9780470512968
14. Andreychenko A, Boer VO, Arteaga de Castro CS, Luijten PR, Klomp DWJ. Efficient spectral editing at 7 T: GABA detection with MEGA-sLASER [Internet]. Magn. Reson. Med. 2012 Oct;68(4):1018–1025.[cited 2017 Feb 18 ] Available from:
http://www.ncbi.nlm.nih.gov/pubmed/22213204
15. Puts NAJ, Edden RAE. In vivo magnetic resonance spectroscopy of GABA: a
16. Mescher M, Merkle H, Kirsch J, Garwood M, Gruetter R. Simultaneous in vivo spectral editing and water suppression. [Internet]. NMR Biomed. 1998 Oct;11(6):266–72.[cited 2017 Feb 18 ] Available from: http://www.ncbi.nlm.nih.gov/pubmed/9802468
17. Smith MA, Koutcher JA, Zakian KL. J-difference lactate editing at 3.0 Tesla in the presence of strong lipids [Internet]. J. Magn. Reson. Imaging 2008 Dec;28(6):1492– 1498.[cited 2017 Feb 18 ] Available from: http://www.ncbi.nlm.nih.gov/pubmed/19025937
18. Arteaga de Castro CS, Boer VO, Andreychenko A, Wijnen JP, van der Heide UA, Luijten PR, Klomp DWJ. Improved efficiency on editing MRS of lactate and γ-aminobutyric acid by inclusion of frequency offset corrected inversion pulses at high fields [Internet]. NMR Biomed. 2013 Oct;26(10):1213–1219.[cited 2017 Feb 18 ] Available from:
http://www.ncbi.nlm.nih.gov/pubmed/23508792
19. Bottomley PA. Spatial localization in NMR spectroscopy in vivo. [Internet]. Ann. N. Y. Acad. Sci. 1987;508:333–48.[cited 2017 Feb 18 ] Available from:
http://www.ncbi.nlm.nih.gov/pubmed/3326459
20. O’Gorman RL, Michels L, Edden RA, Murdoch JB, Martin E. In vivo detection of GABA and glutamate with MEGA-PRESS: reproducibility and gender effects. [Internet]. J. Magn. Reson. Imaging 2011 May;33(5):1262–7.[cited 2017 Feb 18 ] Available from:
http://www.ncbi.nlm.nih.gov/pubmed/21509888
21. Mullins PG, McGonigle DJ, O’Gorman RL, Puts NAJ, Vidyasagar R, Evans CJ, Edden RAE. Current practice in the use of MEGA-PRESS spectroscopy for the detection of GABA. Neuroimage 2014;86:43–52.
22. Edden RAE, Barker PB. Spatial effects in the detection of γ-aminobutyric acid: Improved sensitivity at high fields using inner volume saturation [Internet]. Magn. Reson. Med. 2007 Dec;58(6):1276–1282.[cited 2017 Feb 18 ] Available from:
http://doi.wiley.com/10.1002/mrm.21383
23. Scheenen TWJ, Heerschap A, Klomp DWJ. Towards 1H-MRSI of the human brain at 7T with slice-selective adiabatic refocusing pulses [Internet]. Magn. Reson. Mater. Physics, Biol. Med. 2008 Mar;21(1–2):95–101.[cited 2017 Feb 18 ] Available from:
http://www.ncbi.nlm.nih.gov/pubmed/18210177
contamination. [Internet]. Magn. Reson. Med. 2001 Mar;45(3):517–20.[cited 2017 Feb 18 ] Available from: http://www.ncbi.nlm.nih.gov/pubmed/11241712
25. Stagg CJ. Magnetic Resonance Spectroscopy as a tool to study the role of GABA in motor-cortical plasticity [Internet]. Neuroimage 2014 Feb;86:19–27.[cited 2017 Feb 18 ] Available from: http://www.ncbi.nlm.nih.gov/pubmed/23333699
26. Kupers R, Danielsen ER, Kehlet H, Christensen R, Thomsen C. Painful tonic heat stimulation induces GABA accumulation in the prefrontal cortex in man [Internet]. Pain 2009 Mar;142(1):89–93.[cited 2017 Feb 18 ] Available from:
http://www.ncbi.nlm.nih.gov/pubmed/19167811
27. Möhler H. GABAA receptor diversity and pharmacology [Internet]. Cell Tissue Res. 2006 Nov;326(2):505–516.[cited 2017 Feb 18 ] Available from:
http://www.ncbi.nlm.nih.gov/pubmed/16937111
28. Rae CD. A Guide to the Metabolic Pathways and Function of Metabolites Observed in Human Brain 1H Magnetic Resonance Spectra [Internet]. Neurochem. Res. 2014 Jan;39(1):1–36.[cited 2017 Feb 18 ] Available from:
http://www.ncbi.nlm.nih.gov/pubmed/24258018
29. Sedley W, Parikh J, Edden RAE, Tait V, Blamire A, Griffiths TD. Human Auditory Cortex Neurochemistry Reflects the Presence and Severity of Tinnitus [Internet]. J. Neurosci. 2015 Nov;35(44):14822–14828.[cited 2017 Feb 18 ] Available from:
http://www.ncbi.nlm.nih.gov/pubmed/26538652
30. Draper A, Stephenson MC, Jackson GM, Pépés S, Morgan PS, Morris PG, Jackson SR. Increased GABA contributes to enhanced control over motor excitability in Tourette syndrome. [Internet]. Curr. Biol. 2014 Oct;24(19):2343–7.[cited 2017 Feb 18 ] Available from: http://www.ncbi.nlm.nih.gov/pubmed/25264251
31. Puts NAJ, Harris AD, Crocetti D, Nettles C, Singer HS, Tommerdahl M, Edden RAE, Mostofsky SH. Reduced GABAergic inhibition and abnormal sensory symptoms in children with Tourette syndrome. J. Neurophysiol. 2015;114(2)
Available from: https://academic.oup.com/brain/article-lookup/doi/10.1093/brain/aww285
33. Marsman A, Mandl RCW, Klomp DWJ, Bohlken MM, Boer VO, Andreychenko A, Cahn W, Kahn RS, Luijten PR, Hulshoff Pol HE. GABA and glutamate in schizophrenia: a 7 T 1 H-MRS study. [Internet]. NeuroImage. Clin. 2014;6:398–407.[cited 2017 Feb 18 ] Available from: http://www.ncbi.nlm.nih.gov/pubmed/25379453
34. Chiapponi C, Piras F, Piras F, Caltagirone C, Spalletta G. GABA System in
Schizophrenia and Mood Disorders: A Mini Review on Third-Generation Imaging Studies [Internet]. Front. Psychiatry 2016 Apr;7:61.[cited 2017 Feb 18 ] Available from:
http://journal.frontiersin.org/Article/10.3389/fpsyt.2016.00061/abstract
35. Nasrallah FA, Balcar VJ, Rae CD. Activity-dependent γ-aminobutyric acid release controls brain cortical tissue slice metabolism [Internet]. J. Neurosci. Res. 2011 Dec;89(12):1935–1945.[cited 2017 Feb 18 ] Available from:
http://www.ncbi.nlm.nih.gov/pubmed/21618581
36. Stagg CJ, Bestmann S, Constantinescu AO, Moreno Moreno L, Allman C, Mekle R, Woolrich M, Near J, Johansen-Berg H, Rothwell JC. Relationship between physiological measures of excitability and levels of glutamate and GABA in the human motor cortex [Internet]. J. Physiol. 2011 Dec;589(23):5845–5855.[cited 2017 Feb 18 ] Available from: http://www.ncbi.nlm.nih.gov/pubmed/22005678
37. Taylor R, Neufeld RWJ, Schaefer B, Densmore M, Rajakumar N, Osuch EA, Williamson PC, Théberge J. Functional magnetic resonance spectroscopy of glutamate in
schizophrenia and major depressive disorder: anterior cingulate activity during a color-word Stroop task. [Internet]. NPJ Schizophr. 2015;1:15028.[cited 2017 Feb 18 ] Available from: http://www.ncbi.nlm.nih.gov/pubmed/27336037
38. Peirce JW. PsychoPy—Psychophysics software in Python [Internet]. J. Neurosci. Methods 2007 May;162(1–2):8–13.[cited 2017 Feb 20 ] Available from:
http://www.ncbi.nlm.nih.gov/pubmed/17254636
39. Tkác I, Starcuk Z, Choi IY, Gruetter R. In vivo 1H NMR spectroscopy of rat brain at 1 ms echo time. [Internet]. Magn. Reson. Med. 1999 Apr;41(4):649–56.[cited 2017 Feb 18 ] Available from: http://www.ncbi.nlm.nih.gov/pubmed/10332839
of the magnetic field along axes [Internet]. J. Magn. Reson. 1992 Feb;96(2):323– 334.[cited 2017 Feb 18 ] Available from:
http://linkinghub.elsevier.com/retrieve/pii/002223649290085L
41. Provencher SW. Automatic quantitation of localized in vivo 1H spectra with LCModel. [Internet]. NMR Biomed. 2001 Jun;14(4):260–4.[cited 2017 Feb 18 ] Available from: http://www.ncbi.nlm.nih.gov/pubmed/11410943
42. Hall EL, Stephenson MC, Price D, Morris PG. Methodology for improved detection of low concentration metabolites in MRS: Optimised combination of signals from multi-element coil arrays [Internet]. Neuroimage 2014 Feb;86:35–42.[cited 2017 Feb 18 ] Available from: http://www.ncbi.nlm.nih.gov/pubmed/23639258
43. Naressi A, Couturier C, Devos JM, Janssen M, Mangeat C, de Beer R, Graveron-Demilly D. Java-based graphical user interface for the MRUI quantitation package. [Internet]. MAGMA 2001 May;12(2–3):141–52.[cited 2017 Feb 18 ] Available from:
http://www.ncbi.nlm.nih.gov/pubmed/11390270
44. Stagg C, Rothman DL (Douglas L. Magnetic resonance spectroscopy : tools for neuroscience research and emerging clinical applications. Academic Press; 2013.
45. Vanhamme, van den Boogaart A, Van Huffel S. Improved method for accurate and efficient quantification of MRS data with use of prior knowledge [Internet]. J. Magn. Reson. 1997 Nov;129(1):35–43.[cited 2017 Feb 18 ] Available from:
http://www.ncbi.nlm.nih.gov/pubmed/9405214
46. Near J, Simpson R, Cowen P, Jezzard P. Efficient γ-aminobutyric acid editing at 3T without macromolecule contamination: MEGA-SPECIAL [Internet]. NMR Biomed. 2011 Dec;24(10):1277–1285.[cited 2017 Feb 18 ] Available from:
http://www.ncbi.nlm.nih.gov/pubmed/21387450
47. Terpstra M, Ugurbil K, Gruetter R. Direct in vivo measurement of human cerebral GABA concentration using MEGA-editing at 7 Tesla [Internet]. Magn. Reson. Med. 2002 May;47(5):1009–1012.[cited 2017 Feb 18 ] Available from:
http://www.ncbi.nlm.nih.gov/pubmed/11979581
Reson. Med. 1998 Jan;39(1):28–33.[cited 2017 Feb 20 ] Available from: http://www.ncbi.nlm.nih.gov/pubmed/9438434
49. Andreychenko A, Klomp DWJ, de Graaf RA, Luijten PR, Boer VO. In vivo GABA T2 determination with J-refocused echo time extension at 7 T [Internet]. NMR Biomed. 2013 Nov;26(11):1596–1601.[cited 2017 Feb 20 ] Available from:
http://www.ncbi.nlm.nih.gov/pubmed/23893556
50. Chen C, Morris P, Francis S, Gowland P. A comparison of MEGA-sLASER and STEAM for in vivo quantification of GABA at 7T [Internet]. In: A comparison of MEGA-sLASER and STEAM for in vivo quantification of GABA at 7T. 2015 p. 203.[cited 2017 Feb 19 ] Available from: http://dev.ismrm.org/2015/0203.html
51. Rothman DL, Petroff OA, Behar KL, Mattson RH. Localized 1H NMR measurements of gamma-aminobutyric acid in human brain in vivo. [Internet]. Proc. Natl. Acad. Sci. U. S. A. 1993 Jun;90(12):5662–6.[cited 2017 Feb 18 ] Available from:
http://www.ncbi.nlm.nih.gov/pubmed/8516315
52. Waddell KW, Avison MJ, Joers JM, Gore JC. A practical guide to robust detection of GABA in human brain by J-difference spectroscopy at 3 T using a standard volume coil. [Internet]. Magn. Reson. Imaging 2007 Sep;25(7):1032–8.[cited 2017 Feb 19 ] Available from: http://www.ncbi.nlm.nih.gov/pubmed/17707165
53. Hetherington HP, Newcomer BR, Pan JW. Measurements of human cerebral GABA at 4.1 T using numerically optimized editing pulses. [Internet]. Magn. Reson. Med. 1998 Jan;39(1):6–10.[cited 2017 Feb 19 ] Available from:
http://www.ncbi.nlm.nih.gov/pubmed/9438430
54. McLean MA, Barker GJ. Concentrations and magnetization transfer ratios of metabolites in gray and white matter [Internet]. Magn. Reson. Med. 2006 Dec;56(6):1365–1370.[cited 2017 Feb 19 ] Available from: http://www.ncbi.nlm.nih.gov/pubmed/17051529
56. Levy LM, Hallett M. Impaired brain GABA in focal dystonia. [Internet]. Ann. Neurol. 2002 Jan;51(1):93–101.[cited 2017 Feb 19 ] Available from:
http://www.ncbi.nlm.nih.gov/pubmed/11782988
57. Kalra S, Choi C, Allen PS. Motor Cortex GABA Concentration as measured by Quantum Filtering. In: Motor Cortex GABA Concentration as measured by Double-Quantum Filtering. 2006 p. 3062.
58. Choi C, Bhardwaj PP, Kalra S, Casault CA, Yasmin US, Allen PS, Coupland NJ.
Measurement of GABA and contaminants in gray and white matter in human brain in vivo [Internet]. Magn. Reson. Med. 2007 Jul;58(1):27–33.[cited 2017 Feb 20 ] Available from: http://www.ncbi.nlm.nih.gov/pubmed/17659613
59. Wilson M, Reynolds G, Kauppinen RA, Arvanitis TN, Peet AC. A constrained least-squares approach to the automated quantitation of in vivo 1H magnetic resonance spectroscopy data [Internet]. Magn. Reson. Med. 2011 Jan;65(1):1–12.[cited 2017 Feb 20 ] Available from: http://doi.wiley.com/10.1002/mrm.22579
60. Edden RAE, Puts NAJ, Harris AD, Barker PB, Evans CJ. Gannet: A batch-processing tool for the quantitative analysis of gamma-aminobutyric acid–edited MR spectroscopy spectra. [Internet]. J. Magn. Reson. Imaging 2014 Dec;40(6):1445–52.[cited 2017 Feb 20 ] Available from: http://www.ncbi.nlm.nih.gov/pubmed/25548816
61. Schaller B, Mekle R, Xin L, Kunz N, Gruetter R. Net increase of lactate and glutamate concentration in activated human visual cortex detected with magnetic resonance spectroscopy at 7 tesla [Internet]. J. Neurosci. Res. 2013 Aug;91(8):1076–1083.[cited 2017 Feb 20 ] Available from: http://doi.wiley.com/10.1002/jnr.23194
62. Saleh MG, Oeltzschner G, Chan KL, Puts NAJ, Mikkelsen M, Schär M, Harris AD, Edden RAE. Simultaneous edited MRS of GABA and glutathione [Internet]. Neuroimage 2016 Nov;142:576–582.[cited 2017 Feb 20 ] Available from:
Figure 2.
Figure 5.