DEVELOPMENT OF SPINEL-BASED ELECTRODE SUPPORTS
FOR SOLID OXIDE FUEL CELLS
Elena Stefan
A Thesis Submitted for the Degree of PhD
at the
University of St Andrews
2013
Full metadata for this item is available in
St Andrews Research Repository
at:
http://research-repository.st-andrews.ac.uk/
Please use this identifier to cite or link to this item:
http://hdl.handle.net/10023/3605
Development of Spinel-based Electrode Supports
for Solid Oxide Fuel Cells
Elena Stefan
Supervised by Professor John T.S. Irvine
A Thesis Submitted for the Degree of PhD
at the
University of St Andrews
2
Declaration
I, Elena Stefan, hereby certify that this thesis, which is approximately 38000 words in length, has been written by me, that it is the record of work carried out by me and that it has not been submitted in any previous application for a higher degree.
I was admitted as a research student in November, 2008 and as a candidate for the degree of Doctor of Philosophy in September 2009; the higher study for which this is a record was carried out in the University of St Andrews between 2008 and 2012.
Date ……... signature of candidate ………...
I hereby certify that the candidate has fulfilled the conditions of the Resolution and Regulations appropriate for the degree of Doctor of Philosophy in the University of St Andrews and that the candidate is qualified to submit this thesis in application for that degree.
Date ……... signature of supervisor ………...
In submitting this thesis to the University of St Andrews I understand that I am giving permission for it to be made available for use in accordance with the regulations of the University Library for the time being in force, subject to any copyright vested in the work not being affected thereby. I also understand that the title and the abstract will be published, and that a copy of the work may be made and supplied to any bona fide library or research worker, that my thesis will be electronically accessible for personal or research use unless exempt by award of an embargo as requested below, and that the library has the right to migrate my thesis into new electronic forms as required to ensure continued access to the thesis. I have obtained any third-party copyright permissions that may be required in order to allow such access and migration, or have requested the appropriate embargo below.
The following is an agreed request by candidate and supervisor regarding the electronic publication of this thesis:
Access to printed copy but embargo of electronic publication of thesis for a period of one year on the following ground(s):
publication would preclude future publication;
3
Acknowledgements
I would like to express my gratitude to my supervisor, Professor John T.S. Irvine for offering me the opportunity to study in his group and complete this work. Thank you for the unconditioned support, valuable suggestions, discussions and for helping me improve my knowledge in solid state chemistry.
I would like to thank my colleagues from the JTSI group, to Dr Paul Connor for advice in experimental work, setups, useful discussions and software. His knowledge, skills and experience were always shared with good will and a true benefit for my work during these years. Also Dr Abul Kalam Azad, Dr George Tsekouras and Dr Maarten Verbraeken who taught me a lot about analyzing my experimental results.
Also, my sincere thanks goes to Dr Mark Cassidy for both theoretical and experimental advice on screen printing and cell fabrication. Dr Martin Smith and Dr David Miller for useful suggestions and discussions, and Dr Cristian Savaniu for guidance in material synthesis. Chengsheng Ni and Xiangling Yue thank you for useful discussions about cell fabrication.
I could not forget the valuable help of Mrs. Julie Nairn with various matters including introduction to tape casting process and various other equipment, and continuous assistance for the good functioning of the laboratory equipment. I am also deeply grateful to Mrs. Sylvia Williamson and Mr. Ross Blackley for the time and experience they shared with me in matters of thermogravimetric analysis, dilatometry and X-ray diffraction or Scanning Electron Microscopy. Also, Mr George Anthony, Robert Cathcart and Brian Walker, thank you for assistance with fixing various pieces of equipment.
4
Abstract
The high temperature oxidation of ferritic stainless steel interconnects results in chromium poisoning of the solid oxide fuel cell (SOFC) electrodes, which is a limiting factor for their utilisation as SOFC interconnects. Chromium-rich spinel materials were studied as electrode supports that would be situated at the interface between interconnect and electrode, in order to reduce the effect of chromium poisoning of the electrodes. The main goal of this thesis was to find chromium-rich spinel materials with good electrical conductivity (σ ≥ 0.1 S∙cm-1) in air and reducing
atmosphere, chemically and mechanically stable in SOFC testing conditions.
The structure and properties of newly formulated chromium-rich spinels, such as Mn1+xCr2-xO4 (x = 0, 0.5), MnFexCr2-xO4 (x = 0.1, 1), MgMnCrO4, MnLixCr2-xO4
(x = 0.1) and MgMxCr2-xO4, (M = Li, Mg, Ti, Fe, Cu, Ga) were studied aiming at their
application as electrode support material for solid oxide fuel cells. Cation distributions were determined by Rietveld refinement from X-ray diffraction (XRD), within the limits of XRD precision and correlated with electrical properties determined experimentally. The chemical stability in reducing conditions was studied and the reduction effects upon materials were evaluated by XRD phase analysis and microstructure analysis. It was found that MnMxCr2-xO4 materials have a limited
stability to reduction, only MnCr2O4 proved to have good stability when reduced,
with negative influence for its p-type semiconductor conductivity. Even though MnFeCrO4 had limited stability to reduction, in reducing conditions the conductivity
changed from p-type to n-type semiconductor. A similar behaviour to reduction was observed for MgFeCrO4. Also the mechanical and chemical compatibility of some
spinels with YSZ was studied in terms of thermal expansion coefficient (TEC/K-1),
sintering step and possible chemical reactions.
Lithium titanate spinels, starting with LiCrTiO4, were investigated in terms of
5
The performance of MnFeCrO4 and MgFeCrO4 as electrode support materials was
investigated when used alone or impregnated with (La0.75Sr0.25)0.97Cr0.5Mn0.5O3,
La0.8Sr0.2FeO3, Ce0.9Gd0.1O2, CeO2 or Pd. Composite anodes for SOFC were prepared
by aqueous infiltration of nitrate salts into porous MnFeCrO4 and MgFeCrO4
scaffolds and studied by electrochemical impedance spectroscopy (EIS) in symmetrical cell configuration. The performance of the composite anodes was evaluated in humidified 5%H2/Ar in order to understand their stability and
performance at 850 °C or lower temperature with respect to the porous substrates. It was found that all the impregnated phases adhere very well to the spinel and considerably enhance performance and stability to a level required for SOFC applications.
6
List of Figures
Figure 1-1 World energy consumption since 1990 to 2035 in quadrillion British thermal units (Btu); (OECD – Organization for Economic Cooperation and Development with the members OECD Americas – United States, Canada, Mexico/Chile, OECD Asia – Japan, South Korea, Australia/New Zealand and OECD Europe – Austria, Belgium, Czech Republic, Denmark, Finland, France, Germany, Greece, Hungary, Iceland, Ireland, Italy, Luxembourg, the Netherlands, Norway, Poland, Portugal, Slovakia, Slovenia, Spain, Sweden, Switzerland, Turkey, and the United Kingdom;).1 ... 20
Figure 1-2 World net electricity generation by fuel type, 2008-2035(trillion KWh).1 21
Figure 1-3 Electrochemical processes in a fuel cell with O2 oxidant and H2 fuel.
a = anode, c = cathode, e = electrolyte (after 12) ... 23
Figure 1-4 Planar solid oxide fuel cell design with metallic interconnects (after 6) .... 26
Figure 1-5 Representation of chromium poisoning process in SOFC caused by diffusion of Cr volatile species from Cr - interconnect into the LSM cathode and at the interface cathode/electrolyte.12 ... 27
Figure 1-6 Spinel structure for MgCr2O4 represented with atoms; the representation
has origin choice 2. ●- O2-; • - Cr3+; • - Mg2+. ... 29
Figure 1-7 Spinel structure for MgCr2O4 represented with polyhedral model. ... 29
Figure 1-8 Ionic radius 32 for Mn2+, Fe2+, Li+, Cu2+, Mg2+, Mn3+, Fe3+ and Ga3+ and
coordination numbers (CN). Dashed lines illustrate the absence of ionic radii of Cr3+
and Mn3+ for CN = 4. ... 30
Figure 1-9 Kröger-Vink diagram for ZrO2 in which oxygen anti-Frenkel defects
dominate the intrinsic defect structure (after 46,48). ... 36
Figure 1-10 Schematic representation of an electron hole hopping at B site. ... 39 Figure 1-11 Example of Arrhenius plots log(σ) vs. 1000/T for MgCr2O4 and
MgFeCrO4 with slope change at 400 °C and 500 °C, respectively. Slope change
corresponds to change in activation energy. ... 40 Figure 1-12 Representation of composite electrodes: a) cermet; b) by infiltration of electrode materials into porous YSZ scaffolds. ... 42 Figure 1-13 Quaternary system Mn2O3-MgO-Cr2O3-Fe2O3. Spinel compositions
investigated in the quaternary oxide system are also represented in the diagram. ... 43 Figure 1-14 Schematic diagram of spinel solid solutions investigated in the systems MgCr2O4 – LiCrTiO4, Mg2TiO4 – LiCrTiO4 and Mg2TiO4 – LiCrTiO4 – MgFeCrO4.
7
indices , the black thickened lines represent the path difference between beams reflected by consecutive layers. ... 53 Figure 2-3 Scattering of X-rays by s electrons with introduction a path difference, δ, in the scattered wave front (after 3,5). ... 54
Figure 2-4 Basic construction of Scanning Electron Microscope (after 12) ... 57
Figure 2-5 Electron species resulting from the interaction of the electron beam with the sample (after 12) ... 57
Figure 2-6 Functional diagram of a pushrod dilatometer.13 ... 59
Figure 2-7 Schematic representation of 4-terminal conductivity experimental setup (after 14). ... 60
Figure 2-8 Contact geometry used for 4-terminal conductivity measurements. ... 60 Figure 2-9 Schematic representation of the basic principle of tape casting process.1661
Figure 2-10 YSZ-screen printed green tapes with 1 and 2 layers printed area (5x5 cm2
) before co-lamination. ... 63 Figure 2-11 Schematic representation of: a) Nyquist and b) Bode plots for a set of data collected experimentally for this work (Re- electrolyte resistance, Rp-polarisation
resistance); c) the considered equivalent circuit (Rs = Re, the electrolyte contribution,
Rp1+Rp2 = Rp, the total polarisation resistance with contribution of two electrode
processes and CPE1, CPE2 - constant phase elements accounting for the capacitive
component). ... 65 Figure 2-12 Equivalent circuit specific for fitting bulk and grain boundary for a ceramic material (after 18,26,21). ... 67
Figure 2-13 Representation of: a) Nyquist and b) Bode plots of electrochemical impedance obtained on the MnFeCrO4/LSCM|YSZ|MnFeCrO4/LSCM
symmetrical cell at 835 °C, in stagnant air; c) the considered equivalent circuit (L=inductive component, Rs = Re, the electrolyte contribution, Rp1+Rp2 = Rp, the
total polarisation resistance with contribution of two electrode processes and CPE1,
CPE2 - constant phase elements accounting for the capacitive component). ... 69
Figure 2-14 Schematic representation of the EIS measurements experimental setup. ... 70 Figure 3-1 X-ray diffraction pattern for MgCr2O4 after sintering at 1400 °C ... 74
Figure 3-2 X-ray diffraction patterns for Mg0.9Cr2.1O4 sintered in air and in 5%H2/Ar
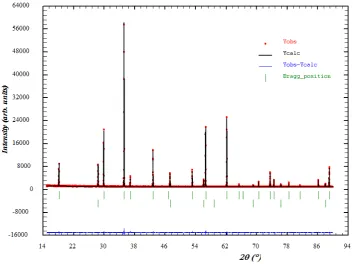
at 1400 °C for 12 hours. ... 75 Figure 3-3 Rietveld refinement profiles for MnCr2O4 with Si as internal standard;
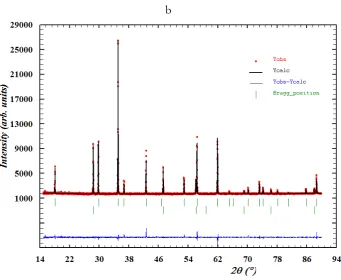
Observed data are represented with red dots, calculated profile with black line and difference profile with blue line. ... 77 Figure 3-4 Rietveld refinement profiles of: a) MnFe0.1Cr1.9O4 and b) MnFeCrO4 with
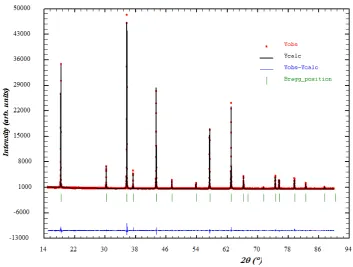
Si as internal standard. Observed data are represented with red dots, calculated profile with black line and difference profile with blue line. ... 78 Figure 3-5 Rietveld refinement profiles of MgCr2O4 XRD pattern. Observed data are
8
Figure 3-6 Rietveld refinement profiles of MgFeCrO4 (random distribution).
Observed data are represented with red dots, calculated profile with black line and difference profile with blue line. ... 80 Figure 3-7 The evolution of the cell parameter with the average ionic radii for B sites; (empty squares) – rB for MnMxCr2-xO4; (empty circles) – rB for MgMxCr2-xO4; (grey
line – guiding lines for linear trend) ... 83 Figure 3-8 Variation of refined u parameter with (rA-rB)/a based on Equation 3-1,17
where rA and rB are average ionic radii resulted from the considered cation
distribution; (empty squares) – refined u for MnMxCr2-xO4; (empty circles) – refined u
parameters for MgMxCr2-xO4. ... 83
Figure 3-9 Micrographs of a) Mn1.5Cr1.5O4; b) MnFeCrO4; c) MgMnCrO4 d) MnCr2O4
sintered at 1400 °C for 12 hours in air. ... 85 Figure 3-10 Micrographs of: a) MgCr2O4; b) MgFe0.1Cr1.9O4 c) MgGa0.1Cr1.9O4; d)
MgCu0.1Cr1.9O4; e) MgLi0.1Cr1.9O4; f) Mg1.5Ti0.5CrO4 sintered at 1400 °C for 12 hours
in air. ... 86 Figure 3-11 X-ray diffraction pattern of MnFeCrO4 scaffold reduced in dry
5%H2/Ar or humidified 5%H2/Ar at 1000 °C for 20 hours... 87
Figure 3-12 Micrographs and picture of Mn1.5Cr1.5O4: a) as synthesized; b), c) -
reduced for 20 hours at 950 °C; d) picture of Mn1.5Cr1.5O4 after reduction. ... 89
Figure 3-13 Micrographs of MnFeCrO4: a) - as synthesized; b) - reduced for 20 hours
at 950 °C; the magnification scale was chosen to be representative for different microstructures. ... 90 Figure 3-14 X-ray Diffraction Pattern of MgFeCrO4 reduced at 1000 °C for 20
hours: (a) in humidified (3% H2O) 5%H2/Ar and (b) dry 5%H2/Ar; Lines Cu Kα1
and Kα2 are specified in comparison with the: As synthesised scan that only contains
Cu Kα1 line. ... 91
Figure 3-15 Log(σ) vs. a) cell parameter of MnMxCr2-xO4; b) cell parameter of
MgM0.1Cr1.9O4; c) the Fe content of MgFexCr2-xO4; d) the Ga content of MgGaxCr 2-xO4 in air and reducing conditions at 850 °C. ... 94
Figure 3-16 Evolution of electrical conductivity of Mg1.5Ti0.5CrO4 and MgFeCrO4 and
MnCr2O4 in reducing conditions at 850 °C, with p-type conductivity of MnCr2O4 and
n-type conductivity of Mg1.5Ti0.5CrO4 and MgFeCrO4. ... 95
Figure 3-17 Activation energy dependence upon unit cell parameter and temperature in air of listed materials; the two marked positions correspond to MgFe0.5Cr1.5O4 (full
squares), MgFeCrO4 (full square red) and MnFe0.1Cr1.9O4 (empty squares). ... 96
Figure 3-18 Sintering step determined for MgCr2O4, MgCr2O4/YSZ (40 : 60 mol.%)
and YSZ at 1350 °C with dwell 15 minutes. ... 98 Figure 3-19 Sintering step for MnFeCrO4, MgFeCrO4 and YSZ at 1400 °C with 1
hour dwell. ... 99 Figure 3-20 X-ray diffraction pattern of MnFeCrO4 as synthesized and
MnFeCrO4/YSZ (1:1 wt.%) sintered at 1400 °C for 10 hours. ... 100
Figure 3-21 X-ray diffraction pattern of MgCr2O4 as synthesized and MgCr2O4/YSZ
9
Figure 3-22 Micrographs of: a) MgMnCrO4/YSZ; b) MgCr2O4/YSZ; c), d)
MnFeCrO4/YSZ mixtures after sintering at 1400 °C for 10 hours. ... 101
Figure 4-1 Schematic representation of studied oxides spinels with determined temperatures of phase transition spinel − ramsdellite. i = 0.42 represents the inversion degree determined of MgFeCrO4 (chapter 3) ... 106
Figure 4-2 Rietveld refinement profiles of LiTiCrO4 quenched from 950 °C to room
temperature; Observed data are represented with red dots, calculated profile with black line and difference profile with blue line. ... 107 Figure 4-3 Rietveld refinement profiles of Li0.8Mg0.3Cr0.9Ti0.9Fe0.1O4 quenched from
1200 °C to room temperature. Observed data are represented with red dots, calculated profile with black line and difference profile with blue line. ... 108 Figure 4-4 Rietveld refinement profiles of Li0.7Mg0.4Cr0.9Ti0.8Fe0.2O4 quenched from
1300 °C to room temperature. Observed data are represented with red dots, calculated profile with black line and difference profile with blue line. ... 109 Figure 4-5 Ramsdellite structure of LiTiCrO4 represented with polyhedral model;
with yellow are represented the Cr/Ti octahedra and with blue, the Li cations located in the channels. ... 110 Figure 4-6 Rietveld refinement profiles of Li0.9Mg0.2Cr0.9TiO4 quenched from 1100 °C
to room temperature. The pattern contains reflections corresponding to spinel (Bragg positions marked with blue) and ramsdellite (Bragg positions marked with red) forms of the material. The third phase is internal standard Si (green Bragg positions). Observed data are represented with red dots, calculated profile with black line and difference profile with blue line. ... 111 Figure 4-7 Micrographs of : a) Li0.9Mg0.1Cr1.1Ti0.9O4 quenched from 1100 °C; b)
Li0.85Mg0.3Cr0.85TiO4 quenched from 1200 °C; c) Li0.9Mg0.2Cr0.9TiO4 quenched from
1100 °C to room temperature. ... 113 Figure 4-8 Cell parameter vs. sintering temperature for 5 °C/min heating-cooling rate (represented as open circle) and quenched samples (represented as open square). . 114 Figure 4-9 The evolution of the cell parameter with the average ionic radii for B sites; (grey line – guiding lines for linear trend) ... 116 Figure 4-10 Variation of refined u parameter with (rA-rB)/a based on Equation 3-1,8
where rA and rB are average ionic radii resulted from the considered cation
distribution. ... 116 Figure 4-11 Micrographs of a) Li0.9Mg0.2Cr0.9TiO4; b) Li0.9Mg0.1Cr1.1Ti0.9O4; c)
Li0.85Mg0.3Cr0.85TiO4 sintered at 1000 °C for 12 hours and d) Li0.85Mg0.3Cr0.85TiO4
sintered at 1100 °C for 12 hours in air. ... 117 Figure 4-12 Micrographs of: a) Li0.7Mg0.4Cr0.9Ti0.8Fe0.2O4 sintered at 1000 °C; b)
Li0.7Mg0.4Cr0.9Ti0.8Fe0.2O4 sintered at 1100 °C; c) Li0.7Mg0.4Cr0.9Ti0.8Fe0.2O4 sintered at
1200 °C; d) Li0.8Mg0.3Cr0.9Ti0.9Fe0.1O4 sintered at 1100 °C for 12 hours in air. ... 118
Figure 4-13 X-ray diffraction pattern of Li0.7Mg0.4Cr0.9Ti0.8Fe0.2O4 sintered at: a) 1100
10
Figure 4-14 Arrhenius plots measured in air of Li0.9Mg0.2Cr0.9TiO4/1000 °C,
Li0.85Mg0.3Cr0.85TiO4/1100 °C, Li0.85Mg0.3Cr0.85TiO4/1200 °C and
Li0.7Mg0.4Cr0.9Ti0.8Fe0.2O4/1100 °C in temperature range 150 – 800 °C. ... 120
Figure 4-15 Arrhenius plots measured in 5%H2/Ar of Li0.85Mg0.3Cr0.85TiO4/1100 °C,
Li0.85Mg0.3Cr0.85TiO4/1200 °C and Li0.7Mg0.4Cr0.9Ti0.8Fe0.2O4/1100 °C in temperature
range 180 – 800 °C. ... 121 Figure 4-16 Evolution of electrical conductivity for LiCrTiO4, Li0.9Mg0.2Cr0.9TiO4 and
Li0.7Mg0.4Cr0.9Ti0.8Fe0.2O4 in reducing conditions at 800 °C, with p-type conductivity
for LiCrTiO4 and Li0.9Mg0.2Cr0.9TiO4 initially, and n-type conductivity for longer
reducing time and lower pO2. ... 122 Figure 5-1 DC electrical conductivity of a dense MnFeCrO4 pellet as a function of
time after switching from static air to humidified 5%H2/Ar. The inset shows the
same data as a function of pO2. ... 127 Figure 5-2 SEM images of MnFeCrO4 scaffold: a) – three layer wafer consisting of
dense YSZ electrolyte with porous MnFeCrO4 on either side; b) – microstructure of
spinel layer after testing in air; c) – microstructure of spinel layer after testing in humidified 5%H2/Ar at 850 °C for 11 hours; d) – detail of the sample tested. ... 128
Figure 5-3 X-ray diffraction pattern of MnFeCrO4 – LSCM(27%) and MnFeCrO4 –
LSCM(22%) – CGO(12%) with LSCM sintered at 1200 °C for 4 hours and CGO sintered at 1000 °C for 4 hours. ... 129 Figure 5-4 X-ray diffraction pattern of MnFeCrO4 – LSF(20%) sintered at 900 °C for
4 hours; Fe2O3 (hematite) marked peaks are observed on this pattern. ... 129
Figure 5-5 SEM images of: a) MnFeCrO4 - LSCM(27%) tested in air and humidified
5%H2/Ar; b) MnFeCrO4 - LSF(20%) tested in air. ... 130
Figure 5-6 SEM images of: a) MnFeCrO4 – LSCM(22%) – CGO(12%) after tests in
air and humidified 5%H2/Ar; b) MnFeCrO4 – LSCM(22%) – CeO2(6%) tested in
humidified – 5%H2/Ar... 131
Figure 5-7 SEM images of: a) MnFeCrO4 –LSCM(22%) – CGO(12%) –Pd(1%)
tested in humidified 5%H2/Ar; b) MnFeCrO4 – LSCM(22%) – CeO2(6%) – Pd(1%)
tested in humidified 5%H2/Ar. ... 131
Figure 5-8 Symmetrical cells measured in stagnant air at 870 °C: a) – Nyquist plot containing data for the whole cell (2 equal electrodes); b) – Bode plot of phase angle vs frequency; c), d) – Arrhenius plots for Rs and Rp obtained from equivalent circuits
fitting of experimental data; plotted Rs and Rp values are for one electrode. ... 134
Figure 5-9 Equivalent circuit used to fit experimental data, where L = inductor; Rs = series resistance; Rp = polarisation resistance and CPE = constant phase
element. ... 134 Figure 5-10 Symmetrical cells measured in humidified 5%H2/Ar at 850 °C: a) –
Nyquist plot containing data for the whole cell (2 equal electrodes); b) – Bode plot of phase angle vs frequency; c), d) – Arrhenius plots for Rs and Rp obtained from
equivalent circuits fitting of experimental data; plotted Rs and Rp values are for one
11
Figure 5-11 Nyquist plots of MnFeCrO4 scaffold and MnFeCrO4/LSCM reduced at
850 °C for 1 hour/ 11 hours and corresponding equivalent circuits fit; spectra contain data for two identical electrodes. ... 143
Figure 5-12 Nyquist plots of MnFeCrO4/LSCM/CeO2 and
MnFeCrO4/LSCM/CeO2/Pd reduced at 850 °C for 1 hour/ 11 hours and
corresponding equivalent circuits fit; spectra contain data for two identical electrodes. ... 144
Figure 5-13 Nyquist plots of MnFeCrO4/LSCM/CGO and
MnFeCrO4/LSCM/CGO/Pd reduced at 850 °C for 1 hour/ 11 hours and
corresponding equivalent circuits fit; spectra contain data for two identical electrodes. ... 145 Figure 5-14 Electrical conductivity plotted as a function of time in reducing conditions at 850 °C; the inner plot shows the same data as a function of the partial pressure of the oxygen; ... 147 Figure 5-15 SEM images of MgFeCrO4|YSZ|MgFeCrO4 three layer wafer with
details presented for the spinel - YSZ interface and the microstructure of the spinel porous layer. ... 148 Figure 5-16 XRD pattern of MgFeCrO4/LSCM and MgFeCrO4/LSCM/CGO with
LSCM sintered at 1200 °C (4 hours) and CGO at 1000 °C (4 hours); Oxide phases: spinel, perovskite and CGO. ... 149 Figure 5-17 XRD pattern of MgFeCrO4/LSCM/CeO2 with LSCM sintered at
1200 °C for 4 hours and CeO2 at 450 °C (4 hours); Oxide phases: spinel, perovskite
and CeO2. ... 149
Figure 5-18 SEM images in cross section of: a) MgFeCrO4/LSCM; b)
MgFeCrO4/LSCM/CeO2; c) MgFeCrO4/LSCM/CGO; d)
MgFeCrO4/LSCM/CeO2/Pd; e) MgFeCrO4/LSCM/CGO/Pd and f) surface
micrograph for MgFeCrO4/LSCM/CGO/Pd – Pd particles are present; the
micrographs were made after the samples were tested in humidified – 5%H2/Ar. . 151
Figure 5-19 Symmetrical cells measured in humidified 5%H2/Ar at 850 °C: a)
Nyquist plot containing data for the whole cell (2 equal electrodes); b) – Bode plot of phase angle vs frequency; c), d) – Arrhenius plots for Rs and Rp obtained from
equivalent circuits fitting of experimental data; plotted Rs and Rp values are for one
electrode... 154 Figure 5-20 Equivalent circuit used to fit experimental data, where L = inductor; Rs = series resistance; Rp = polarisation resistance and CPE = constant phase
element. ... 155 Figure 5-21 Nyquist plots of MgFeCrO4 and MgFeCrO4/LSCM reduced at 850 °C
for 1 hour/ 11 hours and corresponding equivalent circuits fit; spectra contain data for two identical electrodes. ... 158 Figure 5-22 Nyquist plots of MgFeCrO4/LSCM/CeO2 and MgFeCrO4/LSCM/CGO
12
Figure 5-23 Nyquist plots of MgFeCrO4/LSCM/CeO2/Pd and
MgFeCrO4/LSCM/CGO/Pd reduced at 850 °C for 1 hour/ 11 hours and
corresponding equivalent circuits fit; spectra contain data for two identical electrodes. ... 160 Figure 7-1 Rietveld refinement profiles of MgFeCrO4 after initial stages of refinement and before refining the degree of inversion in the spinel and the atomic isotropic displacement factors, which corresponds to stages 1-6 described in the refinement strategy. ... 170 Figure 7-2 Rietveld refinement profiles of MgFeCrO4 after refining the degree of
inversion in the spinel. ... 172 Figure 7-3 Rietveld refinement profiles of MgFeCrO4 after refining the degree of
inversion in the spinel and scale factor, cell parameter, oxygen parameter and peak profile parameters... 173 Figure 7-4 Rietveld refinement profiles of MgFeCrO4 after refining the degree of
inversion in the spinel and scale factor, cell parameter, oxygen parameter and peak profile parameters repeated several times. ... 174 Figure 7-5 Rietveld refinement profiles of MgFeCrO4 after refining the atomic
isotropic displacement factors, scale factor, cell parameter, oxygen parameter and peak profile parameters. ... 175 Figure 7-6 Final stage of the Rietveld refinement of MgFeCrO4, after refining the
atomic isotropic displacement factors, and cation inversion alternatively, along with the other refinable parameters: scale factor, cell parameter, oxygen parameter and peak profile parameters. ... 177 Figure 8-1 Rietveld refinement profiles for MnLi0.1Cr1.9O4 with Si as internal
standard; Observed data is represented with red dots, calculated profile with black line and difference profile with blue line. ... 180 Figure 8-2 Rietveld refinement profiles for Mn1.5Cr1.5O4. Experimental data is
represented with red dots, calculated profile with black line and difference profile with blue line. ... 181 Figure 8-3 Rietveld refinement profiles for MgMnCrO4 with Si as internal standard.
... 182 Figure 8-4 Rietveld refinement profiles for: a) MgFe0.1Cr1.9O4 and b) MgFe0.5Cr1.5O4.
Experimental data is represented with red dots, calculated profile with black line and difference profile with blue line. ... 183 Figure 8-5 Rietveld refinement profiles for Mg1.5Ti0.5CrO4. Experimental data is
represented with red dots, calculated profile with black line and difference profile with blue line. ... 185 Figure 8-6 Rietveld refinement profiles for: a) Li0.9Mg0.1Cr1.1Ti0.9O4 sintered at 900 °C,
b) Li0.9Mg0.2Cr0.9TiO4 sintered at 1000 °C, c) Li0.85Mg0.3Cr0.85TiO4 sintered at 1000 °C
and d) Li0.8Mg0.3Cr0.9Ti0.9Fe0.1O4 sintered at 1100 °C. Observed data is represented
13
Figure 9-1 Equivalent circuit model for characterising the impedance spectra for MnFeCrO4/LSCM symmetrical cell. ... 190
Figure 9-2 Electrochemical impedance spectroscopy of MnFeCrO4/LSCM
symmetrical cell measured in 5%H2/Ar at several temperatures between 675 °C and
850 °C: a), b) and c) Nyquist plots containing data for the whole cell (2 equal electrodes); d) Bode plots. ... 192 Figure 9-3 Fitting of the experimental data using the equivalent circuit presented above: a) Nyquist plot; b) Bode plot; c) Arrhenius plots for Rs, Rp, Rp1 and Rp2
resulted from the data fitting. ... 194
List of Tables
Table 2-1 Equivalent circuit components with corresponding symbols in ZView software and impedance formula.23 ... 66
Table 3-1 Parameters resulted from refinement of MnCr2O4, MnFe0.1Cr1.9O4 and
MnFeCrO4 XRD patterns and refinement reliability factors. ... 78
Table 3-2 Parameters resulted from refinement of MgCr2O4 and MgFeCrO4 XRD
patterns and refinement reliability factors. ... 80 Table 3-3 Cation distribution, a and u determined from the Rietveld refinement; (@) – u calculated with Equation 3-1.17 ... 81 Table 3-4 Summary of reduction experiments in terms of experimental conditions and formed secondary phases. ... 88 Table 3-5.Thermal expansion coefficients between 100 and 900 °C. ... 97 Table 4-1 Parameters resulted from refinement of LiTiCrO4, Li0.8Mg0.3Cr0.9Ti0.9Fe0.1O4
and Li0.7Mg0.4Cr0.9Ti0.8Fe0.2O4 XRD patterns and refinement reliability factors. ... 109
Table 4-2 Parameters resulted from refinement of XRD data for Li0.9Mg0.2Cr0.9TiO4
quenched from 1100°C, Li0.9Mg0.1Cr1.1Ti0.9O4 quenched from 1100°C and
Li0.85Mg0.3Cr0.85TiO4 quenched from 1200 °C and refinement reliability factors; (*) -
dataset collected on Philips diffractometer. ... 111 Table 4-3 Cation distribution determined from the Rietveld refinement for quenched oxides, as described above. Only the samples found to be pure spinels are listed. .. 112 Table 4-4 Cation distribution, a and u determined from the Rietveld refinement for stable spinel oxides cooled slowly to room temperature. ... 115 Table 5-1 Materials impregnated into MnFeCrO4 porous substrates in wt.% and
labels used throughout this chapter. ... 126 Table 5-2 Relaxation frequencies and polarisation resistances for symmetrical cells tested in air at ~ 870 °C; Rp1 and Rp2 are determined from equivalent circuits fitting
14
Table 5-3 Relaxation frequencies and polarisation resistances for symmetrical cells tested in humidified – 5%H2/Ar at ~850 °C; Rs and Rp (Rp1, Rp2)are determined from
equivalent circuits fitting and listed values are for one electrode. ... 140 Table 5-4 Materials impregnated into MgFeCrO4 porous substrates in wt.% and
labels used throughout this section. ... 146 Table 5-5 Relaxation frequencies and polarisation resistances for symmetrical cells tested in humidified 5%H2/Ar at ~ 850 °C; Rs and Rp (Rp1, Rp2) determined from
equivalent circuits fitting and listed values are for one electrode. ... 155 Table 7-1 Parameters resulted from refinement of MgFeCrO4 XRD pattern and
refinement reliability factors at corresponding the stage of the refinement illustrated in Figure 7-1. ... 170 Table 7-2 Parameters resulted from refinement of MgFeCrO4 diffraction pattern and
the reliability factors at corresponding the stage of the refinement illustrated in Figure 7-2. ... 172 Table 7-3 Parameters resulted from refinement of MgFeCrO4 diffraction pattern and
the reliability factors at corresponding the stage of the refinement illustrated in Figure 7-3. ... 173 Table 7-4 Parameters resulted from refinement of MgFeCrO4 diffraction pattern and
the reliability factors at corresponding the stage of the refinement illustrated in Figure 7-4. ... 174 Table 7-5 Parameters resulted from refinement of MgFeCrO4 diffraction pattern and
the reliability factors at corresponding the stage of the refinement illustrated in Figure 7-5. ... 176 Table 7-6 Final parameters resulted from refinement of MgFeCrO4 diffraction
pattern and the reliability factors of the refinement illustrated in Figure 7-5. ... 177 Table 8-1 Parameters resulted from refinement of MnLi0.1Cr1.9O4, Mn1.5Cr1.5O4 and
MgMnCrO4 XRD patterns and refinement reliability factors; B_iso_A, B_iso_B and
B_iso_O are isotropic thermal factors for cations at A and B sites and oxygen anions. ... 181 Table 8-2 Parameters resulted from refinement of MgFe0.1Cr1.9O4, MgFe0.5Cr1.5O4 and
MgLi0.1Cr1.9O4 XRD patterns and refinement reliability factors, with B_iso_A,
B_iso_B and B_iso_O isotropic thermal factors... 184 Table 8-3 Parameters resulted from refinement of MgGa0.1Cr1.9O4, MgGa0.2Cr1.8O4
and MgCu0.1Cr1.9O4 XRD patterns and refinement reliability factors, with B_iso_A,
B_iso_B and B_iso_O isotropic thermal factors... 184 Table 8-4 Parameters resulted from refinement of Li0.9Mg0.2Cr0.9TiO4 sintered at
900 °C, Li0.9Mg0.2Cr0.9TiO4 sintered at 1000 °C, Li0.9Mg0.1Cr1.1Ti0.9O4 sintered at
900 °C, Li0.9Mg0.1Cr1.1Ti0.9O4 sintered at 1000 °C XRD patterns and refinement
reliability factors, with B_iso_A, B_iso_B and B_iso_O isotropic thermal factors. 188 Table 8-5 Parameters resulted from refinement of Li0.85Mg0.3Cr0.85TiO4 sintered at
1000 °C, Li0.85Mg0.3Cr0.85TiO4 sintered at 1100 °C and Li0.8Mg0.3Cr0.9Ti0.9Fe0.1O4
15
Table 8-6 Parameters resulted from refinement of Li0.7Mg0.4Cr0.9Ti0.8Fe0.2O4 sintered at
1000 °C, Li0.7Mg0.4Cr0.9Ti0.8Fe0.2O4 sintered at 1100 °C and Li0.7Mg0.4Cr0.9Ti0.8Fe0.2O4
sintered at 1200 °C XRD patterns and refinement reliability factors, with B_iso_A, B_iso_B and B_iso_O isotropic thermal factors... 189 Table 9-1 Fitting results of MnFeCrO4/LSCM symmetrical cell measured in
16
Contents
Acknowledgements ... 3
Abstract ... 4
Contents... 19
1 Introduction ... 20
1.1 Solid oxide fuel cells ... 22
1.2 Component requirements for solid oxide fuel cells ... 24
1.3 The effects of chromium poisoning on SOFC electrodes ... 27
1.4 The spinel structure ... 28
1.4.1 Overview of the spinel structure ... 28
1.4.2 Cation site preference in the spinel structure ... 30
1.5 Aliovalent substitution and defect chemistry exemplified on spinels ... 31
1.5.1 Defect chemistry ... 31
1.5.2 Defects in spinels ... 36
1.5.3 Conduction mechanism for chromium–rich spinels... 39
1.6 Composite electrodes and electrode support materials ... 41
1.7 Aims and objectives of the thesis ... 42
1.8 References ... 44
2 Experimental procedures ... 49
2.1 Synthesis and processing ... 49
2.1.1 Combustion synthesis ... 49
2.1.2 Solid state synthesis ... 50
2.2 X-ray Diffraction ... 51
2.2.1 Background ... 51
2.2.2 Diffraction of X-rays ... 52
2.2.3 Rietveld Refinement of Crystal Structures ... 55
2.3 Scanning Electron Microscopy ... 56
2.4 Dilatometry ... 58
2.5 Chemical stability in reducing conditions ... 59
2.6 Electrical conductivity measurement ... 59
2.6.1 Conductivity Measurements by 4-point method ... 59
2.7 Fabrication of symmetrical cells ... 61
17
2.7.2 Screen printing of YSZ electrolyte ... 62
2.7.3 Insertion of electrode materials into scaffolds by impregnation ... 63
2.8 Electrochemical tests on symmetrical cells ... 64
2.8.1 Electrochemical Impedance Spectroscopy ... 64
2.8.2 The analysis of impedance spectroscopy by equivalent circuit method 67 2.8.3 Symmetrical cells testing parameters ... 69
2.9 References ... 70
3 Studies on MnMxCr2-xO4 and MgMxCr2-xO4 spinels as electrode support materials 73 3.1 Introduction ... 73
3.2 Structural characterization of materials ... 73
3.3 Chemical stability in reducing conditions ... 87
3.4 Electrical properties ... 91
3.5 Compatibility with yttrium stabilized zirconia ... 96
3.6 Conclusions ... 101
3.7 References ... 103
4 Studies on LiTiCrO4 and related oxide spinels ... 105
4.1 Introduction ... 105
4.2 Spinel - ramsdellite phase transition temperature ... 105
4.2.1 Characterization of quenched materials ... 106
4.3 Structural characterization of non-quenched materials ... 114
4.4 Chemical stability in reducing conditions ... 119
4.5 Electrical properties ... 120
4.6 Conclusions ... 122
4.7 References ... 123
5 Development and performance of MnFeCrO4 and MgFeCrO4 - based electrodes for SOFC ... 125
5.1 Introduction ... 125
5.2 MnFeCrO4 based electrodes tests ... 125
5.2.1 Phase analysis, conductivity and microstructure of the scaffold ... 126
5.2.2 Phase analysis and microstructure of impregnated scaffolds... 128
18
5.2.4 Influence of reduction upon electro-chemical performance ... 141
5.3 MgFeCrO4 based electrodes tests ... 146
5.3.1 Electrical conductivity and microstructure of the scaffold ... 147
5.3.2 Phase analysis and microstructure of impregnated scaffolds... 148
5.4 Performance of impregnated scaffolds ... 151
5.5 Influence of reduction upon electro-chemical performance... 156
5.6 Conclusions ... 161
5.7 References ... 163
6 Conclusions ... 164
7 Appendix 1 – Rietveld refinement – general procedure and detailed steps exemplified on a selected composition ... 167
7.1 Structural models reported in literature... 167
7.2 The intermediary stages of the refinement ... 168
7.2.1 Initial premises of the structural model ... 168
7.2.2 Rietveld refinement steps ... 169
7.2.3 The refinement of the inversion degree: ... 171
7.3 References ... 179
8 Appendix 2 - Rietveld refinement result for spinel oxides ... 180
9 Appendix 3 – Impedance spectra analysis by equivalent circuit method ... 190
19
Chapter 1
Contents
1 Introduction ... 20
1.1 Solid oxide fuel cells ... 22
1.2 Component requirements for solid oxide fuel cells ... 24
1.3 The effects of chromium poisoning on SOFC electrodes ... 27
1.4 The spinel structure ... 28
1.4.1 Overview of the spinel structure ... 28
1.4.2 Cation site preference in the spinel structure ... 30
1.5 Aliovalent substitution and defect chemistry exemplified on spinels ... 31
1.5.1 Defect chemistry ... 31
1.5.2 Defects in spinels ... 36
1.5.3 Conduction mechanism for chromium–rich spinels... 39
1.6 Composite electrodes and electrode support materials ... 41
1.7 Aims and objectives of the thesis ... 42
20
1
Introduction
International commissions such as the U.S. Energy Information Administration have analysed the projections of world energy consumption from 2008 to 2035 and it was evaluated that the world energy demand will increase by 53% of current energy demand (Figure 1-1). The increase in energy consumption will be determined by strong long term economic growth of developing countries. In the long term, the study projects an increase in world consumption of energy from all fuel sources and, even though the oil remains the largest source of energy, it is expected a decrease in petroleum based marketed energy from 34% in 2008 to 29% in 2035. Renewable energy is the fastest growing form and an increase in its use is expected in the total of energy use from 10% in 2008 to 14% in 2035.1
Figure 1-1 World energy consumption since 1990 to 2035 in quadrillion British thermal units (Btu); (OECD – Organization for Economic Cooperation and Development with the members OECD Americas – United States, Canada, Mexico/Chile, OECD Asia – Japan, South Korea, Australia/New Zealand and OECD Europe – Austria, Belgium, Czech Republic, Denmark, Finland, France, Germany, Greece, Hungary, Iceland, Ireland, Italy, Luxembourg, the Netherlands, Norway, Poland, Portugal, Slovakia, Slovenia, Spain, Sweden, Switzerland, Turkey, and the United Kingdom;).1
[image:21.595.152.478.334.585.2]21
[image:22.595.136.512.161.441.2]source of world electricity until 2035, the contribution from renewable energy sources is the fastest growing source (3.1% per year), as presented in Figure 1-2.
Figure 1-2 World net electricity generation by fuel type, 2008-2035(trillion KWh).1
The limited character of fossil energy sources results in the necessity to shift the energy technology towards renewable sources. A consequence of the worldwide economic growth led to an increase of total greenhouse emissions in the last century that could have important negative effects for the global climate. The growing awareness of climate change and the predicted decline in worlds oil production has reinforced the concept of renewable energy usage and the development of appropriate technologies.2 The development of fuel cell technology is encouraged by
clean production of electricity from a variety of fuels and its high efficiency of transforming chemical energy directly to electrical energy with low emissions of pollutants, such as CO and NOx.3–6
22
higher conversion efficiency. Emissions of pollutants from fuel cells are several orders of magnitude lower than those produced by conventional power generators. Also, cells can be made in different sizes, so they can be placed at different locations with minimum spacing restrictions. Another notable feature is the quiet operation due to no moving parts of the cell.7 Fuel cell applications are various considering all
their advantages. For long term applications, fuel cells are projected as devices for clean energy, using as fuel, hydrogen. In the short-term, for high temperature fuel cells, due to high temperature operation, they offer the possibility of using different fuels with higher conversion efficiencies and lower carbon dioxide and NOx
emissions.
The most suitable applications for fuel cell technology are for use in stationary power generation plants of industrial power systems, auxiliary power units for vehicles and home power generation, as well as back-up power for hospitals, companies or airports. Stationary power generation is suitable for urban areas, where localised pollution is a major issue, but also for primary power sources for distributed residences which have no access to power grid.3,5,8
There are six fuel cell types which are primarily being investigated and they are considered suitable in different applications, depending on their functional properties. For example, experts believe that proton exchange membrane fuel cell (PEM) will be the most efficient for powering cars and buses and may also be used for residential power applications. Solid oxide fuel cells (SOFCs) are promising technologies for electric power plants and combined with gas turbines their efficiency is expected to be over 70%. Direct methanol fuel cells are promising as battery replacement for portable applications, as cellular phones and laptop computers.5
1.1 Solid oxide fuel cells
23
The main components of a solid oxide fuel cell are the cathode (air electrode), the anode (fuel electrode), a dense oxide electrolyte with high ionic conductivity and interconnect.11 The functioning principle is based on electrochemical reactions that
[image:24.595.157.473.187.455.2]take place at the electrodes as illustrated in Figure 1-3.
Figure 1-3Electrochemical processes in a fuel cell with O2 oxidant and H2 fuel. a = anode, c = cathode,
e = electrolyte (after 12)
In operation, oxygen supplied at the cathode is reduced to form an oxygen ion which migrates through the electrolyte/anode interface. Fuels such as H2, CH4, or natural
gas, are oxidized at the anode side releasing electrons to the external circuit.4, 8 The
reactions that take place at electrodes considering hydrogen as fuel are written below: Cathode:
O2+ 4e− →2O2−
Anode:
2H2+ 2O2− →2H2O + 4e−
Overall:
O
2
H
2
C
E
A
e
-e
-O
24
2H2+ O2 →2H2O
The electrons transferred in the reaction are released to the external circuit. The driving force for the oxygen ions is the chemical potential difference between anode (low oxygen chemical potential) and cathode (high oxygen chemical potential).
Depending on the fuel, the reactions taking place may be different, as SOFCs offer the possibility of using available fuels with a lower rate of pollution and a higher efficiency.9,10
1.2 Component requirements for solid oxide fuel cells
A SOFC device contains all ceramic components and they should meet several conditions for good performance and durability. The cathode and the anode consist of porous oxide ceramics and the electrolyte is a dense layer of oxygen ion conducting material. The materials for the cell components must have chemical and structural stability during the preparation and operation, similar thermal expansion coefficients, adequate porosity and catalytic activity to achieve the highest performances.12–14
Based on these requirements, there are few materials that can be used and the most used electrolytes materials are zirconia and ceria fluorites, and LaGaO3 – based
perovskites. For cathodes, doped lanthanum manganite (LaMnO3) is most commonly
used, but also lanthanum cobaltite (LaCoO3) and for anodes Ni-YSZ cermet. The
idea of a metal – ceramic (cermet) anode is also used in the development of new SOFC systems based on alternative electrolyte materials such as doped ceria, La1-xSrxGa1-yMgyO3 (LSGM), and proton conducting electrolytes (doped
BaCeO3-BaZrO3).15
In operation, the cathode is the catalyst for the reduction of the oxygen with electrons from the external circuit and conducts the O2- ions to the electrolyte.
Considering its functions, the requirements for the materials utilised are good ionic and electronic conductivity, good catalytic activity for the oxygen reduction, chemical and mechanical stability and thermal compatibility with the electrolyte and interconnect materials.
25
adsorbed fuel for the reaction to take place. The electrons resulted in the reaction must be delivered to the external circuit. The requirements for the anode materials are directly connected with its functioning and they must have also good electronic and ionic conductivity for a wide range of oxygen partial pressures, good catalytic activity, chemical and mechanical stability, and thermal compatibility with electrolyte and interconnect materials.16 Both electrodes should be able to tolerate the gas from
the other electrode through possible cracks and pinholes17, although such pinholes
lead to failure under operation.
Interconnects provide the electrical connection between the individual cells, separate the anode and the cathode compartments in solid oxide fuel cells and multiply the voltage output by connecting individual cells in series. The interconnect materials must possess a combination of physical and electrical properties for a proper functioning of the fuel cell such as, high temperature oxidation resistance in both anode and cathode atmospheres, high electrical conductivity and negligible ionic conductivity, thermal expansion compatibility with the other parts of the SOFC, zero open porosity and sufficient mechanical strength, chemical compatibility with the materials it contacts, thermodynamic stability over the applied temperature range. Also the microstructure of the interconnect should be stable with respect to the chemical potential gradient determined by the difference in oxygen partial pressure (pO2) between the oxidant and fuel sides. A microstructure change would determine the variation of electrical conductivity during its functioning. The gas impermeability can be achieved via full densification of the interconnect material during fabrication and the high density of the material should be preserved during functioning.
The interconnect should be easy to fabricate, while materials and fabrication process should be cost effective so that they will not represent major obstacles to large-scale manufacture and commercialisation. Currently, lanthanum chromite is the most commonly used ceramic interconnect material as it shows reasonably good conducting properties at operating temperatures above 800 °C. However, there are several obstacles for mass production of ceramic interconnects with LaCrO3 or
doped LaCrO3 such as low sintering aptitude in air, the strong influence of pO2 over
26
For intermediate temperature, at 800 °C, high temperature corrosion resistant metallic alloys such as ferritic stainless steels or chromium based alloys are considered to be suitable for interconnects. Chromium based alloys have some advantages to consider for interconnects as compatible coefficient of thermal expansion with the other cell components, low costs and good machinability.5,19 In
Figure 1-4 is presented the configuration of a planar SOFC as it is placed in a cell stack, between two interconnect pieces.
Figure 1-4 Planar solid oxide fuel cell design with metallic interconnects (after 6)
A major drawback in using chromium alloys in SOFCs is high temperature oxidation. Oxidation leads to dimensional changes and to the formation of oxide scales on component surfaces which have low electronic conductivities. Recent studies have shown that the main oxides forming on ferritic stainless steels are chromia (Cr2O3)
and (Mn,Cr)3O4 spinel.20,21 Other spinels, containing Cr, Mn, Fe, Co and Ni, can form
27
1.3 The effects of chromium poisoning on SOFC electrodes
One of the distinctive problems encountered with chromium based alloys and ferritic stainless steels has been identified as the formation of volatile gaseous Cr(VI) species in SOFC working conditions. Depending on temperature and partial pressure of H2O and O2, volatile Cr species, such as CrO3 (g) and Cr(OH)2O2 (g) develop from
the chromia scale. These species cause poisoning of the cathode and the cathode/electrolyte interface as they are reduced to Cr2O3 at triple phase boundary
by electrochemical reactions, thus they determine the rapid degradation of the electrical properties of the fuel cell. The performance degradation of the fuel cell determined by the deposition of Cr2O3, is caused by the obstruction and decrease of
the three phase area (electrode/electrolyte/gas) reducing the active sites for oxygen reduction.19,22 For a Sr doped lanthanum manganite (LSM) cathode, the phases
resulting from this process contain (Mn,Cr)3O4 spinels (Figure 1-5).12,18,21
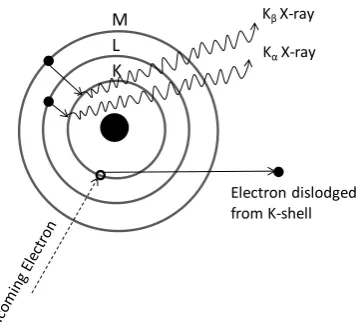
Figure 1-5 Representation of chromium poisoning process in SOFC caused by diffusion of Cr volatile species from Cr - interconnect into the LSM cathode and at the interface cathode/electrolyte.12
For metallic alloys that contain Cr, Mn, Fe, Co, Ni, spinels are also formed over interconnects surface. As a consequence of these observations, spinel systems were studied for protective coating on the interconnects surface, looking mostly at Mn cobaltites, as Mn-Co densified spinel coating was observed to significantly reduce Cr2O3 sub-scale formation, while Cr migration was blocked.19,23,24 Chromium-rich
28
to exhibit good chemical and structural stability in reducing and oxidising conditions, at high temperatures (500 to 900 °C), and sufficient electrical conductivity (> 0.1 S∙cm-1). (Mn,Cr)
3O4 spinels form on metallic interconnects surface resulting
from high temperature oxidation process as described in section 1.3, thus their chemical composition which is compatible with the interconnects metallic alloys appoints these spinels as the right choice to be studied for electrode support materials. Several substitutions on the B site were investigated for MnMxCr2-xO4 with
M = Fe, Mn, Mg or Li.
1.4 The spinel structure
1.4.1 Overview of the spinel structure
The incidence of natural minerals with spinel structure determined a high interest for the study of these materials and their structure over time because of their important geological implications, but also their importance in many possible applications in solid state science.25,26 Oxide spinels generally crystallize with a symmetry described
by the space group Fd-3m (no. 227)27 and they can be described by the general
formula AB2O4 with A typically being a divalent cation and B, a trivalent cation.
Oxygen anions form a cubic closed packed lattice with 64 tetrahedral and 32 octahedral sites partially occupied by cations. One unit cell contains 56 atoms with 8 A cations, 16 B cations and 32 oxygen anions. The occupancy for the octahedral sites is 1/2 and for the tetrahedral sites is only 1/8. Because of the similar size of the A and B cations, they can interchange sites, thus leading to the so called inverse spinels. Inversion can be synthetically expressed as (A1-xBx)Td(AxB2-x)OhO4, where subscripts
Td and Oh refer to the tetrahedral and octahedral sites, respectively. Normal spinels are formed for x = 0, perfectly inverse spinels for x = 1, while intermediate values of x (0 < x < 1) are called randomly inverse spinels.25,28 The conventional unit cell of a
29
from view (100) and the origin choice 2: origin on octahedral vacancy. Cation coordinates are (1/8, 1/8, 1/8) for A site cations, (1/2, 1/2, 1/2) for B site cations and the oxygen parameter, u=1/4 (0.250) for a perfect cubic close packed anion arrangement. Anions usually deviate away from their ideal positions with important implications in bond lengths, bond angles, interstice volumes and symmetries of coordination polyhedral.28,29
Figure 1-6 Spinel structure for MgCr2O4 represented with atoms; the representation has origin choice 2.
●
-O2-;•
- Cr3+;•
- Mg2+.30
1.4.2 Cation site preference in the spinel structure
The equilibrium cation distribution corresponds to the minimisation of the total energy with respect to the stabilisation energy of cations in tetrahedral or octahedral field, as a result of their electronic configuration, the charge and the size of the cations and the electrostatic energies in the lattice.30 Cation radii and charge effects
have opposite tendencies concerning the preference for site occupancies, thus the cation disordering observed in spinels is, partly a consequence of these effects. The opposite influences originate in the necessity of efficient neutralisation for cations with high valences resulting in large coordination numbers (stated by Verwey-Heilman principle28,31), while it is known that high valence cations possess small ionic
radii that prefer small interstices and small coordination numbers (according to Pauling’s first rule).28 Figure 1-8 illustrates the ionic radii of cations for coordination
numbers (NC) 4 and 6.
Figure 1-8 Ionic radius 32 for Mn2+, Fe2+, Li+, Cu2+, Mg2+, Mn3+, Fe3+ and Ga3+ and coordination
numbers (CN). Dashed lines illustrate the absence of ionic radii of Cr3+ and Mn3+ for CN = 4.
Some general criteria stated by Gorter30 concerning the preference of the cations for
31
follows: (a) cations with noble gas configuration do not have individual preference for either coordination and their distribution is determined by the energy of the lattice (mostly dependant of charge, unit cell parameter and oxygen parameter), ions of this type are Li+, Mg2+, Al3+, Ti4+; (b) ions with half-filled 3d shells have spherical
symmetry, in consequence they have no expected preference for either positions, e.g.
Mn2+, Fe3+; (c) preference of other transition metals is influenced by the crystalline
electric field from the neighbouring ions, as those with 3d3 and 3d8 which have
strong preference for sixfold coordination: Cr3+, Ni2+, Mn4+; (d) other cations with d1,
d2, d4, d6, d7 and d9 have their preference for octahedral coordination evaluated from
calculated energy of stabilization in octahedral field.33
1.5 Aliovalent substitution and defect chemistry exemplified on spinels
1.5.1 Defect chemistry
The previous section discussed cation site preference in spinels. This section will give a brief overview of possible aliovalent substitutions (i.e. cations having different charge) and charge compensation mechanisms, in general and in particular for spinels.
Cation substitution represents a well-known approach for tailoring material properties by taking advantage of the defect chemistry that may be induced in the material. This has often been used to develop new materials with desired properties or to eliminate/reduce undesirable effects.34–36
When cations are substituted in a concentration between 0.1 to 1%, the material usually referred to as being doped. If the concentration of the substituting cation exceeds 1% the material is referred to as a solid solution, rather than doped.37
In order to preserve the electroneutrality of the crystal, introduced aliovalent substitutions are compensated for by ionic and/or electronic defects.
Ionic compensation may be realized through several mechanisms, generally by creation of: a) cation vacancies; b) interstitial anions; c) anion vacancies; d) interstitial cations and e) double substitution.37,38 Selected examples from each possible
32
a) A common example for ionic charge compensation by cation vacancies is the case of La doped SrTiO3, Sr1-3x/2LaxTiO3. In this case, La3+ cations substitute
Sr2+ cations and the extra positive charge is compensated for by the
formation of A site vacancies in the perovskite:38–40
𝐿𝑎2𝑂3+ 3𝑆𝑟𝑆𝑟𝑋 →2𝐿𝑎𝑆𝑟∙ +𝑉𝑆𝑟′′+ 3𝑆𝑟𝑂 Equation 1-1
b) For the substitution of cations with higher valence, the extra positive charge could be compensated by accommodating interstitial anions in the lattice. However, this charge compensation mechanism is not common because most of close packed structures do not have interstitial sites large enough to accommodate extra anions. This mechanism could occur in the fluorite structure, e.g. small amount of YF3 could dissolve into CaF2, with formation
of interstitial fluoride anions.37,41,42
c) When doping with lower valence cations, the electroneutrality of the lattice may be maintained by forming anion vacancies. This was exemplified and demonstrated for the substitution of Zr4+ with Y3+ or Ca2+in ZrO
2.The same
mechanism occurs in CeO2, when Ce4+ is substituted with Gd3+.35,43–45
d) Charge compensation by interstitial cations occurs for substitutions where the host lattice has suitable interstitial sites to accommodate cations. Higher valence cations are replaced by lower valence cations and the charge balance is satisfied by accommodating alkali metal cations interstitially, e.g. in Lix(Si1-xAlx)O2 solid solutions, when Si4+ is substituted by Al3+ and Li+ are at
interstitial sites.37
e) Double substitution with iso or aliovalent cations, which prevails the overall electronetrality (e.g. Mg2-xFex)(Si1-yGey)O4
Electronic charge compensation may take place by: a) formation of cation vacancies generated by deintercalation (e.g. delithiation); b) creating mixed valence cations; c) oxygen loss that results in formation of anion vacancies (reduction at high temperature- when e- are liberated into the structure); d) interstitial cations of one
33
a) The processes described as a) deintercalation (e.g. delithiation) and d) interstitial cations of one element and mixed valence cations (e.g. lithiation) are describing the functioning principle of lithium batteries.37,38
b) Creating mixed valence cations may be associated with insertion of interstitial anions into a structure, e.g. in the case of YBCO for which the excess oxygen induces a mixed valence state for Cu cations of 2+ and 3+ that transforms the material form a semiconductor to superconductor;37 For Nd
2CuO4, the
substitution of Nd3+ with Ce4+ is compensated by generating mixed valence
state for the Cu cations 2+ and 1+ leading to n-type superconductor behaviour of the material.40
c) Oxidation and reduction reactions of metal ions at different oxygen partial pressures (pO2) generate electronic defects, for example the reduction of an oxide represents the removal of oxygen to the gas phase and formation of anion vacancies with generation of electrons that may contribute to n-type conductivity.
𝑂𝑂𝑋⇌12𝑂2 (𝑔) +𝑉𝑂∙∙+ 2𝑒′ Equation 1-2
The oxidation process occurs at high pO2 when oxygen anions fill vacant oxygen sites, generating holes that typically contribute to p-type conductivity.37,40,46
𝑉𝑂∙∙+12𝑂2 ⇌ 𝑂𝑂𝑋+ 2ℎ∙ Equation 1-3
The most relevant intrinsic defects for a metal oxide, MO, include Schottky, anti-Schottky, Frenkel, anti-Frenkel and electronic defects. The corresponding formation equilibria and equilibrium constants are given below:
Schottky 𝑛𝑢𝑙𝑙 ⇄ 𝑉𝑀′′+𝑉 𝑂∙∙
𝐾𝑆= [𝑉𝑀′′][𝑉𝑂∙∙]
Equation 1-4 Equation 1-5 Anti-Schottky 𝑛𝑢𝑙𝑙 ⇄ 𝑀𝑖∙∙+𝑂
𝑖′′
𝐾𝑆̅= [𝑀𝑖∙∙][𝑂𝑖′′]
Equation 1-6 Equation 1-7 Frenkel 𝑛𝑢𝑙𝑙 ⇄ 𝑀𝑖∙∙+𝑉
34
𝐾𝐹= [𝑀𝑖∙∙][𝑉𝑀′′] Equation 1-9
Anti-Frenkel 𝑛𝑢𝑙𝑙 ⇄ 𝑂𝑖′′+𝑉 𝑂∙∙
𝐾𝐹�= [𝑂𝑖′′][𝑉𝑂∙∙]
Equation 1-10 Equation 1-11 Electronic 𝑛𝑢𝑙𝑙 ⇄ 𝑒′+ℎ∙
𝐾𝐵 = [𝑒′][ℎ∙]
Equation 1-12 Equation 1-13
Defect concentrations vary with temperature, solute concentration and ambient gas (pO2). Typically, defect concentrations are studied with respect to pO2, and such dependences will be briefly reviewed next with the help of a Brouwer diagram (Figure 1-9). In the Brouwer diagram (also known as Kröger-Vink diagram) the concentration of defects is expressed as a function of log pO2 at constant temperature.40,46 The Brouwer diagram is constructed considering the possible
intrinsic defects described by the Equations (1-4)-(1-13) and additionally some simplifying premises are used. For example, all the defects described above may occur in the material but some possess higher likelihood of occurrence compared to others, hence certain defects may be ignored in calculations (i.e. concentrations tends to zero).46,47
Reduction occurs according to Equation 1-2 and the corresponding equilibrium constant is given below in Equation 1-14 (n being the concentration of electrons released in the materials upon reduction):
𝐾𝑅=𝑛2∙[𝑉𝑂∙∙]∙ 𝑝𝑂21/2 Equation 1-14
In order to determine the defect concentrations, another equation is necessary to be considered, the condition of electroneutrality:
[𝑉𝑂∙∙] + [𝑀𝑖∙∙] + [ℎ∙] = [𝑉𝑀′′] + [𝑂𝑖′′] + [𝑒′] Equation 1-15
The dominant type of defect chemistry determines the electronic defects with the pO2. For a Schottky defect dominated system, from the equilibrium constant for reduction (Equation 1-14), the electron concentration may be expressed as a function of pO2:46,47
𝐾𝑆 = [𝑉𝑀′′][𝑉𝑂∙∙]⇒[𝑉𝑂∙∙] =𝐾𝑆1/2 Equation 1-16
By replacing [VO∙∙] in the Equation 1-14, the pO2 dependence of the electron
35
𝑛=𝐾𝑅1/2∙ 𝐾𝑆−12∙ 𝑝𝑂−142 ⇒ 𝑙𝑜𝑔(𝑛) ~−14𝑙𝑜𝑔 (𝑝𝑂2)
Equation 1-17
The hole concentration has a pO2 dependence opposite to that of the electron concentration:
𝑝=𝐾𝑛𝐵=𝐾𝐵∙ 𝐾𝑅−12∙ 𝐾𝑆1/2∙ 𝑝𝑂2
1/4 ⇒ 𝑙𝑜𝑔(𝑝) ~1
4𝑙𝑜𝑔 (𝑝𝑂2)
Equation 1-18
For low pO2, after the equilibration of the material, the electron concentration becomes: n = 2[VO∙∙]⇒[VO∙∙] =n2, according to the Equation 1-2. When replacing in
the Equation 1-14, results in dependence of the electron concentration and oxygen vacancies of -1/6 slope with log pO2, displaced by a factor by a factor of log 2:
𝑛= (2∙ 𝐾𝑅)1/3∙ 𝑝𝑂2
−16 ⇒ 𝑙𝑜𝑔(𝑛) ~−1
6𝑙𝑜𝑔 (𝑝𝑂2)
Equation 1-19
During oxidation, the hole concentration increases up to the level p = 2[VM′′]⇒
[VM′′] =p2 . The hole concentration and the concentration of metal vacancies have a
dependence of 1/6 slope with log pO2:
𝑝=𝐾𝑛𝐵 =𝐾𝐵∙(2∙ 𝐾𝑅)−13∙ 𝑝𝑂2
1/6 ⇒ 𝑙𝑜𝑔(𝑝) ~1
6𝑙𝑜𝑔 (𝑝𝑂2)
Equation 1-20
When the material is dominated by anti-Frenkel defects, such as in the case of Zr0.92Y0.08O1.96 (YSZ), the reaction with the ambient gas can be formulated as
Equation 1-29 or Equation 1-22: 1
2𝑂2 (𝑔) +𝑉𝑂∙∙+ 2𝑒′ =𝑂𝑂𝑋
Equation 1-21
1
2𝑂2 (𝑔) +𝑉𝑖 =𝑂𝑖′′+ 2ℎ∙
Equation 1-22
At intermediate pO2 values, [Oi′′]≅ [VO∙∙] the conduction is ionic. When the
pO2decreases, the electron concentration increases (n-type conductivity) and it varies with pO2 at slope of -1/4. In a similar manner, the hole concentration increases (p-type conductivity) at higher pO2 with slope 1/4:
[𝑒′]~𝑝 𝑂2
−14 Equation 1-23
[ℎ∙]~𝑝 𝑂2
1
36
At very low pO2, the electron concentration increases and the approximation n = 2[VO∙∙] is more relevant to the system.
The conductivity of the YSZ changes from ionic to n-type conductivity and its variation with pO2 is described by Equation 1-19. At high pO2, the concentration of interstitial oxygen, [Oi′′] and hole concentration, [h∙] increase and the influence of pO2
change is described by Equation 1-20, while the conductivity of YSZ changes from ionic to p-type conductivity.
Figure 1-9 illustrates a Kröger-Vink diagram for the case of YSZ discussed above that indicates the electrolytic domain and the domains of p-type semiconductor and n-type semiconductor, respectively.37,46,48
Figure 1-9 Kröger-Vink diagram for ZrO2 in which oxygen anti-Frenkel defects dominate the intrinsic
defect structure (after 46,48).
1.5.2 Defects in spinels
Spinels are typically described by stoichiometry AB2O4. For this general formula, the
formal charges on the A and B cations are given by the electroneutrality condition:
37
Where QA and QB are the charges of the A and B cations and QO is the charge of the
anion, -2 for oxygen. This model is widely accepted in literature and mostly discussed is the cation distribution amongst the A and B sites, for various ferrites, cobaltites and other spinels based on transitional metals for which the cation distribution is a has been shown to strongly influence material properties .19,23,25,26,28,30,49–62
Poulsen38 proposed an average valence defect model for (Co
xFe1-x)3O4 spinel and
considered charge compensation was descried as averaged charge to all cations of: +8/3=+2.6(6) per cation and assumed a full occupation on the oxygen site at any
pO2. Electrons and holes formation were stated as explaining electrical conduction upon reduction and oxidation, respectively.
In literature the formation of defects in spinels are discussed for several cases, as follows. Ionic charge compensation by cation vacancies is the case of MgAl2O4
spinel, for which Al3+ cation could replace Mg2+ cations with formation of tetrahedral
site vacancies, in the case of solid solution formation or if the material is irradiated.63,64
𝐴𝑙2𝑂3+ 3∙ 𝑀𝑔𝑀𝑔𝑋 →2∙ 𝐴𝑙𝑀𝑔∙ +𝑉𝑀𝑔′′ + 3𝑀𝑔𝑂 Equation 1-26
Moriwake et al.65–67 described MgCr
2O4 as nonstoichiometric, with formation of Cr
vacancies at B site, and performed first principle molecular orbital calculations of MgCr2O4 and MgAl2O4 using model clusters, and first principle pseudo-potential
calculations using plane-wave basis function. They concluded that Cr vacancies are abundant in MgCr2O4 when annealed in air, while Al vacancies are not present alone
in MgAl2O4.
Flot and Irvine68 reported on M (M=Mn, Fe, and Co) substituted Mg
2TiO4 as:
Mg2-xMxTiO4, Mg2Ti1-xMxO4 and Mg2-x/2Ti1-x/2MxO4 and discussed the defect
chemistry arising on oxidation/reduction reaction and the possible conductivity mechanisms resulted the conductivity measurements and TGA results. The studied spinels showed n-type semiconducting behaviour at low pO2 with a slope of -1/4 which could be attributed to the reduction of Ti4+ to Ti3+:
2𝑇𝑖𝑇𝑖𝑋 +𝑂𝑂𝑋 = 2∙ 𝑇𝑖𝑇𝑖′ +𝑉𝑂∙∙+12∙ 𝑂2 (𝑔) Equation 1-27
A dependence of pO2-1/4 assumes a high concentration of oxygen vacancy, compared