284
Predictive Value of Lesions for Relapses in
Relapsing-remitting Multiple Sclerosis
James A. Koziol, Simone Wagner, David F. Sobel, Lloyd S. Slivka, John S. Romine, Jack C. Sipe, and Hans-Peter Adams
BACKGROUND AND PURPOSE: Recent studies have suggested that enhancing lesions on contrast-enhanced T1-weighted MR images are predictive of impending exacerbations in cases of relapsing-remitting multiple sclerosis. We examined whether enhancing lesions, new en-hancing lesions, and new hypointense lesions (‘‘black holes’’) could accurately predict exacer-bations in a cohort of 50 patients with relapsing-remitting multiple sclerosis within a time frame of up to 6 months.
METHODS: Data were obtained from 50 patients with relapsing-remitting disease. All pa-tients underwent monthly MR imaging and clinical examinations for a period of 12 months. Putative predictors of clinical relapse were defined from enhancing lesions, new enhancing lesions, and new black hole outcomes, and their operating characteristics were studied.
RESULTS: Overall, the positive predictive values (PV1) of enhancing lesions, new enhancing lesions, or new black holes for an exacerbation did not exceed 0.25 and the negative predictive values (PV2) were all near 0.9. The best predictor for new enhancing lesions was the occur-rence of new enhancing lesions in each of the previous 3 months (PV1: 0.79 [95% confidence interval, 0.651–0.900]; PV2: 0.83 [95% confidence interval, 0.751–0.887]). Similarly, new black holes were predicted best by the occurrence of new black holes in each of the previous 2 months (PV1: 0.54 [95% confidence interval: 0.372–0.697]; PV2: 0.85 [95% confidence interval, 0.790– 0.896]).
CONCLUSION: None of the MR markers could predict an impending relapse with any reasonable degree of precision. Rather, the absence of MR markers is associated with a more favorable clinical course (ie, fewer relapses).
MR imaging has become the most important par-aclinical test for diagnosing multiple sclerosis, for delineating its natural history, and potentially for use as an objective quantitative outcome measure in assessing the response of patients with multiple sclerosis to experimental therapy (1, 2). The images reveal the multiple, primarily periventricular, le-sions that grow and shrink at different rates in var-ious regions of the brain. Acute inflammatory le-sions associated with multiple sclerosis enhance after the injection of contrast media because of a breakdown of the blood-brain barrier. The
appear-Received April 5, 2000; accepted after revision, July 10, 2000. From the Department of Molecular and Experimental Med-icine (J.A.K., S.W., L.S.S., J.C.S., H.-P.A.), The Scripps Re-search Institute, the Department of Radiology (D.F.S.) and the Division of Neurology (J.S.R., J.C.S.), Scripps Clinic, La Jolla, CA, and the Department of Neurology (S.W.), Ruprecht-Karls University, Heidelberg, Germany.
Address reprint requests to James A. Koziol, PhD, The Scripps Research Institute, Department of Molecular and Ex-perimental Medicine, MEM216, 10550 N. Torrey Pines Road, La Jolla, CA 92037.
qAmerican Society of Neuroradiology
ance of enhancing lesions has been widely accepted as a measure of disease activity in cases of multiple sclerosis (3).
Nevertheless, disease-related activity, as mea-sured from MR images, remains a complex issue. New lesions, enhancing lesions, hypointense or hy-perintense lesions, and changes in lesion size have all been cited as potential measures of pathophys-iological mechanisms in cases of multiple sclerosis, with varying but generally modest degrees of cor-relation with clinical assessments (2). The clinical usefulness of MR imaging in the assessment of pa-tients with multiple sclerosis is predicated on the assumptions that tissue types can be accurately and precisely classified by images and that there is a relation to the clinical course of disease (4).
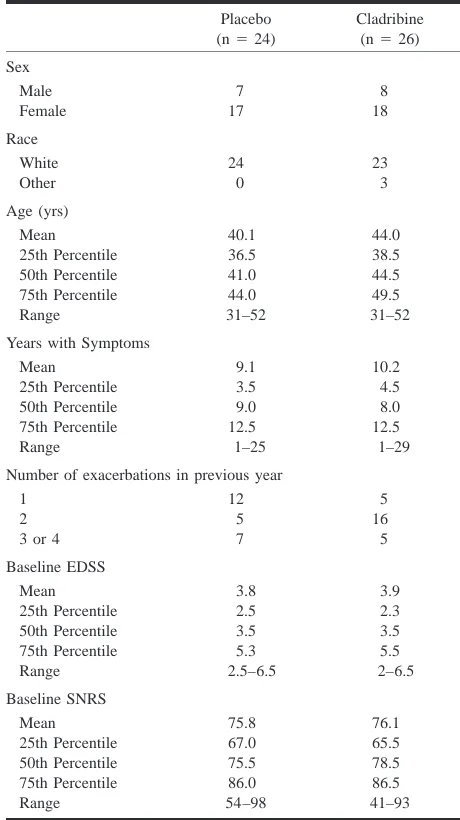
TABLE 1: Baseline demographic and clinical characteristics of 50 relapsing-remitting multiple sclerosis patients
Placebo (n524)
Cladribine (n526) Sex Male Female 7 17 8 18 Race White Other 24 0 23 3 Age (yrs) Mean 25th Percentile 50th Percentile 75th Percentile Range 40.1 36.5 41.0 44.0 31–52 44.0 38.5 44.5 49.5 31–52 Years with Symptoms
Mean 25th Percentile 50th Percentile 9.1 3.5 9.0 10.2 4.5 8.0 75th Percentile Range 12.5 1–25 12.5 1–29 Number of exacerbations in previous year
1 2 3 or 4
12 5 7 5 16 5 Baseline EDSS Mean 25th Percentile 50th Percentile 75th Percentile Range 3.8 2.5 3.5 5.3 2.5–6.5 3.9 2.3 3.5 5.5 2–6.5 Baseline SNRS Mean 25th Percentile 50th Percentile 75th Percentile Range 75.8 67.0 75.5 86.0 54–98 76.1 65.5 78.5 86.5 41–93
exacerbations in relapsing-remitting multiple scle-rosis. Our goal was to assess whether individual patient events (exacerbations) can be temporally predicted with any level of confidence based on these MR imaging findings. Such determination would lend further support to the usefulness and value of MR imaging in providing markers of dis-ease activity and progression in cases of multiple sclerosis, with obvious implications relating to therapeutic intervention on the individual patient level.
Methods
Study Design
MR imaging and exacerbation data were gathered monthly during the course of a randomized, double-blind, placebo-con-trolled clinical trial assessing the efficacy of cladribine for the treatment of relapsing-remitting multiple sclerosis. The pri-mary results of the trial are reported elsewhere (5). We herein focus on short-term clinical outcomes (exacerbations in partic-ular) and attempt to predict the clinical manifestations of re-lapsing-remitting multiple sclerosis based on MR imaging findings, including the presence of enhancing lesions, the oc-currence of new enhancing lesions, and the ococ-currence of new black holes, on contrast-enhanced T1-weighted conventional spin-echo images. The analyses reported herein are based on the 50 patients (of the 52 who were enrolled) whose conditions were evaluable at 12 months. Demographic data relating to these 50 patients are presented in Table 1.
Clinical neurologic examinations of all patients were per-formed at study entry and were repeated every month for the 1st year of the trial, as well as within 48 hours of report by a patient of a relapse (exacerbation). A clinical relapse was de-fined as the appearance of new symptoms or worsening of an existing symptom attributable to multiple sclerosis and accom-panied by objective worsening of neurologic findings. To be scored as a relapse, the alterations must have been preceded by disease stability or improvement lasting for at least 30 days and the worsening must have lasted at least 24 hours and have occurred in the absence of fever. All relapses were identified by the attending neurologists (J.S.R., J.C.S.).
MR Imaging Analyses
Following the protocol for this clinical trial, patients under-went MR imaging at baseline (time of entry into the trial) and then at monthly intervals thereafter during the initial year of the trial. All MR imaging was performed on a 1.5-T General Electric Signa imager at the MR imaging facility at Scripps Clinic. T2- and proton density–weighted images were obtained using a conventional spin-echo sequence with 2500/30/90 (TR/ TE/TE). Sections were 4 mm thick, with a 1-mm intersection gap. T1-weighted images of 3-mm thickness and 0 intersection gap were obtained approximately 10 minutes after the admin-istration of gadopentotate dimeglumine (Magnevist; Berlex Laboratories, Wayne, NJ) (0.1 mmol/kg) to ensure optimal time for transmigration of the contrast agent across the blood-brain barrier.
Two observers (S.W., D.F.S.) agreed on the definition of hy-pointense lesions as described by Truyen et al (6) and, in a preliminary study, evaluated a number of images of patients with multiple sclerosis who were not included in the clinical trial. Subsequently, one observer (S.W.) undertook quantifica-tion of numbers of enhancing lesions, new enhancing lesions, and new black holes on a monthly basis; clarification and re-view were provided by the other observer (D.F.S.). Both ob-servers were blinded to the clinical data, including treatment assignment.
Reproducibility of counts was assessed by the random se-lection of 56 images, and reevaluation was performed by one of the observers (S.W.) approximately 2 months after comple-tion of all counting. The kappa statistic was calculated to as-sess the intrarater level of agreement with the replicate counts (7). Reproducibility was reasonably good regarding counts of enhancing lesions (kappa50.67, standard error50.07) and regarding counts of black holes (kappa50.70, standard error
50.08).
Statistical Methods
We considered a number of putative predictors of clinical relapse in a particular month: enhancing lesions, new enhanc-ing lesions, new black holes, or combinations thereof in the nearest preceding MR image or in a consecutive sequence of previous monthly MR images. For example, to predict an event in month 5 of the trial, the findings of the four preceding MR images were available and could be used in this endeavor. We used the logical operators AND and OR to combine the pu-tative predictors across months when combining information.
TABLE 2: 2 32 Contingency table and derived values for an individual patient
Marker
Event
Present Absent Total Present
Absent Total
a c a1c
b d b1d
a1b c1d n Note.—Operating characteristics of a marker/predictor relative to the occurrence (presence) or nonoccurrence (absence) of a subsequent clinical event (exacerbation) summarized for any individual patient, over the course of n5a1b1c1d months.
Sensitivity (S1)5a/(a1c); specificity (S2)5d/(b1d); positive predictive value (PV1)5a/(a1b); negative predictive value (PV2)
5d/(c1d); and hit rate (HR)5(a1d)/n.
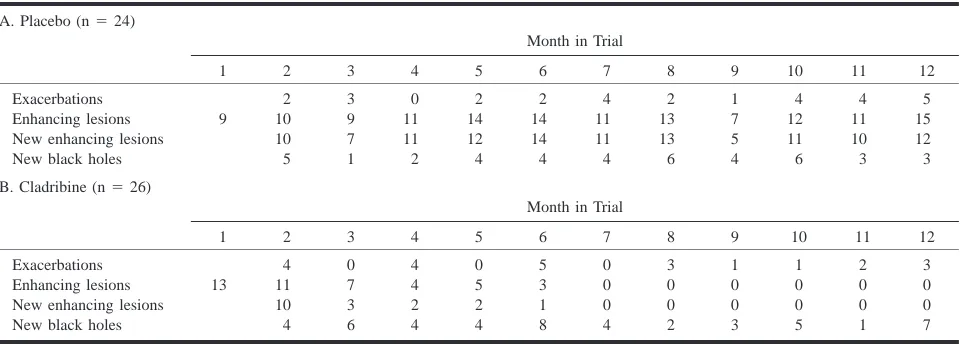
TABLE 3: Number of patients with exacerbations and MR markers by month in trial
A. Placebo (n524)
Month in Trial
1 2 3 4 5 6 7 8 9 10 11 12
Exacerbations Enhancing lesions New enhancing lesions New black holes
9 2 10 10 5 3 9 7 1 0 11 11 2 2 14 12 4 2 14 14 4 4 11 11 4 2 13 13 6 1 7 5 4 4 12 11 6 4 11 10 3 5 15 12 3 B. Cladribine (n526)
Month in Trial
1 2 3 4 5 6 7 8 9 10 11 12
Exacerbations Enhancing lesions New enhancing lesions New black holes
13 4 11 10 4 0 7 3 6 4 4 2 4 0 5 2 4 5 3 1 8 0 0 0 4 3 0 0 2 1 0 0 3 1 0 0 5 2 0 0 1 3 0 0 7 clinical event of exacerbation. Note that during the course of
the clinical trial, each patient’s monthly outcome (occurrence [presence] or nonoccurrence [absence] of a clinical relapse dur-ing that month), together with the MR imagdur-ing–derived pre-dictor for the clinical outcome that month can be summarized in a 2 3 2 contingency table, which renders straightforward calculation of the operating characteristics of the MR index as a prognostic test (Table 2).
We then combined the sample estimates across patients with a random effects model, as used in metaanalysis (8). The choice of the random effects model rather than the fixed effects model was made under the assumption that patients with re-lapsing-remitting multiple sclerosis are likely heterogeneous in terms of both MR imaging findings and clinical events and that this heterogeneity should be taken into account for infer-ential purposes. In this regard, we used the arcsine transfor-mation on the individual estimates of the parameters of sen-sitivity, specificity, and positive and negative predictive values and previous combinations via the random effects model to ensure stability of the variances of the individual patient esti-mates prior to combining via the random effects model. For each potential prognostic index that we constructed, we can summarize the operating characteristics by means of point es-timates and associated 95% confidence intervals.
Results
Demographics relating to all 50 patients with re-lapsing-remitting multiple sclerosis randomized into the clinical trial and with conditions that were
evaluable at 12 months are presented in Table 1. Exacerbations, enhancing lesions, new enhancing lesions, and new black holes relating to these pa-tients are summarized in Table 3. Based on the in-formation presented in Table 1, baseline character-istics of the two treatment cohorts seem comparable. On the other hand, note the profound effect of cladribine on enhancing lesions, as pre-sented in Table 3.
On a monthly basis, the proportions of patients with enhancing lesions, new enhancing lesions, or new black holes always exceeded the proportions of patients with exacerbations. With few excep-tions, however, all these monthly proportions were below 50% (Table 3). We summarized individual patient findings and outcomes, as presented in Ta-ble 2, and then combined sensitivity, specificity, positive predictive value, and negative predictive value across all patients by means of a random ef-fects model to allow for patient heterogeneity in these measures. The results up to 6 months with markers/predictors combined by the OR function are presented in Figure 1. In this regard, the OR function denotes that the presence of the marker (enhancing lesions, new enhancing lesions, or new black holes) in any of the indicated number of pre-ceding months (1–6 months) is considered to be a marker that is ‘‘present’’ in the Table 2 dichotomization.
[image:3.612.48.534.568.741.2]FIG1. Summary operating characteristics and associated 95% confidence intervals for MR markers (OR combination) relative to the occurrence of subsequent relapse. Month denotes the number of months and MR images preceding the event time point. MR markers are combined across each of these time segments of months using the OR function. If the MR marker is present in any of the preceding months, the marker is set to 1; if absent in all months, the marker is set to 0.
Indices derived from enhancing lesions and new enhancing lesions have sensitivities ranging from 0.54 to 0.69 but lower specificities, from 0.22 to 0.61, relative to the occurrence of exacerbations among the placebo cohort. The corresponding in-dices from the cladribine group are clearly dissim-ilar, with sensitivities from 0.21 to 0.43 and spec-ificities from 0.69 to 0.92. Note the trade-off between sensitivity and specificity; as one increases (with number of months combined by OR), the oth-er decreases. In contrast to the enhancing lesion and new enhancing lesion findings, the indices de-rived from new black holes are not confounded by drug treatment; in the two cohorts, sensitivities range from 0.25 to 0.53 and specificities range from 0.56 to 0.86.
Compared with sensitivities and specificities, positive and negative predictive values are relative-ly constant in both cohorts, with no evidence of
statistically significant differences. Positive predic-tive values are all low, ranging from 0.12 to 0.23 in the two cohorts, but negative predictive values are all in excess of 0.80, ranging up to 0.92 for enhancing lesions, new enhancing lesions, and new black holes.
FIG2. Summary operating characteristics and associated 95% confidence intervals for MR markers (AND combination) relative to the occurrence of a subsequent relapse. Month denotes the number of months and MR images preceding the event. MR markers are combined across each of these time segments of months using the AND function. That is, if the MR marker is present in all of the preceding months, the marker is set to 1; if absent in any of the months, the marker is set to 0.
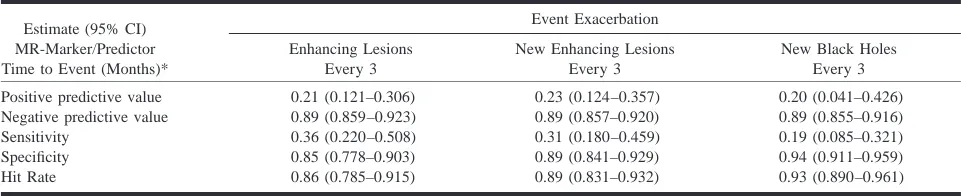
TABLE 4: Operating characteristics of MR markers as predictors for exacerbations
Estimate (95% CI) MR-Marker/Predictor Time to Event (Months)*
Event Exacerbation Enhancing Lesions
Every 3
New Enhancing Lesions Every 3
New Black Holes Every 3 Positive predictive value
Negative predictive value Sensitivity
Specificity Hit Rate
0.21 (0.121–0.306) 0.89 (0.859–0.923) 0.36 (0.220–0.508) 0.85 (0.778–0.903) 0.86 (0.785–0.915)
0.23 (0.124–0.357) 0.89 (0.857–0.920) 0.31 (0.180–0.459) 0.89 (0.841–0.929) 0.89 (0.831–0.932)
0.20 (0.041–0.426) 0.89 (0.855–0.916) 0.19 (0.085–0.321) 0.94 (0.911–0.959) 0.93 (0.890–0.961) Note.—CI, confidence interval; every 3, occurrence of MR marker in the 3 consecutive monthly MR images immediately preceding the clinical event (exacerbation).
upper limit of all the 95% confidence intervals for positive predictive values is ,0.25, and the lower limit of all the 95% confidence intervals for negative predictive values is .0.80.
We also used a more stringent criterion, as de-fined by the AND function, to combine MR pre-dictors. A predictor was said to be present if the MR marker occurred in all of the preceding months, otherwise not. Results to 3 months are de-picted in Figure 2. Note that sensitivity decreases as more months are added to the criterion, and specificity increases. In the combined indices, pos-itive predictive values are all ,0.24 and negative predictive values are all approximately 0.89.
The criteria that yielded the highest positive pre-dictive values for exacerbations are presented in Ta-ble 4. As in the figures, the precision of the sum-mary predictive value estimates, as reflected by the narrowness of the corresponding 95% confidence in-tervals, is remarkably good, implying the unlikeli-hood that positive predictive values would be much larger in magnitude than the values reported herein, had our cohort size been substantially larger.
We also examined the operating characteristics of the prediction of various MR indices among
themselves. We briefly summarize these findings: enhancing lesions are predicted best by the occur-rence of new enhancing lesions during each of the previous 2 months (PV1: 0.82 [95% confidence interval, 0.714–0.898]; PV2: 0.81 [95% confi-dence interval: 0.739–0.869]), new enhancing le-sions are predicted best by new enhancing lele-sions during each of the previous 3 months (PV1: 0.79 [95% confidence interval, 0.651–0.900]; PV2: 0.83 [95% CI, 0.751–0.887]), and new black holes are best predicted by new black holes during each of the previous 2 months (PV1: 0.54 [95% confi-dence interval, 0.372–0.697]; PV2: 0.85 [95% CI, 0.790–0.896]). The operating characteristics of these predictions degraded by including other pu-tative predictors such as exacerbations and the oth-er lesion type, thus suggesting autonomous and self-propagating underlying disease processes for these two types of lesions.
Discussion
[image:5.612.47.528.325.423.2]Early prediction of potential exacerbations in in-dividual patients would thus be valuable for clinical management of multiple sclerosis, especially for preemptive or ameliorative therapy, thereby offer-ing the potential of delayoffer-ing the onset of progres-sive disease. Moreover, patients likely to encounter a relapse would be the preferred patient group for testing the efficacy of experimental therapy. There are no incontrovertible predictors of exacerbations in individual patients; hence, it is of interest to in-vestigate whether conventional MR imaging would be at all useful for this purpose.
In the current study, we identified a number of putative markers of exacerbations from the monthly MR imaging findings of a cohort of patients with relapsing-remitting multiple sclerosis and examined the operating characteristics of these markers when considered from the point of view of prediction of exacerbations. In this regard, we emphasize that clinical concern relating to these potential MR markers should not be regarding the intrinsic sen-sitivity and specificity of the markers but the ac-curacy of positive and negative test results for pre-dicting clinical events. We were primarily interested in short-term predictive values of MR imaging findings and whether presence or absence of enhancing lesions, new enhancing lesions, or new black holes were reliable markers of subse-quent clinical exacerbations, with a time frame of up to 6 months. We found that neither the occur-rence of enhancing lesions nor that of new black holes was useful for predicting clinical events (small positive predictive values, typically ,0.2) but that in the absence of enhancing lesions or new black holes, clinical exacerbations were unlikely to occur (high negative predictive values, typically approximately 0.9). Our estimates of predictive val-ues are very precise, as reflected by the narrowness of the corresponding 95% confidence intervals de-picted in Figures 1 and 2. The total number of MR images examined in this study is almost 600. Therefore, it is extremely unlikely that the positive predictive value of any MR marker would be much larger in magnitude than 0.25 (an upper limit of the reported 95% confidence intervals shown in Fig 1), a value that we judge to be of limited clinical use-fulness. We conclude that when the pre-MR im-aging likelihood of an exacerbation is low, a nor-mal MR image (no enhancing lesions, no new black holes) tends to exclude the possibility of an exacerbation but a positive result is not particularly helpful in inferring that an exacerbation is about to occur.
Factors relating to our MR imaging methodology and evaluations might have influenced our findings (4, 11, 12). However, we relied solely on one ex-perienced assessor (S.W.), with high intrarater re-liability, for primary enumeration of enhancing le-sions and black holes; we thereby avoided potential pitfalls associated with interrater variability (13). The application of triple doses of contrast agent would have increased the number of enhancing
le-sions (14), but this would likely have resulted in increased sensitivity and decreased specificity of any of the MR indices without improving the pos-itive predictive value. It is unlikely that our deter-mination of new black holes from contrast-en-hanced and not from unencontrast-en-hanced T1-weighted MR images is critical. O’Riordan et al (15) confirmed a very strong correlation of T1 hypointense lesion volumes before and after contrast enhancement (15).
A second technical issue relates to our adoption of a random effects model rather than a fixed ef-fects model for the pooling of operating character-istics across patients (8). This choice was predicat-ed on the underlying assumption that, as in most randomized clinical trials, our patients constitute a random sample from an underlying population of patients with relapsing-remitting multiple sclerosis to which we want to generalize findings. In prac-tice, the random effects model incorporates the de-gree of observed patient-to-patient variability into the estimates of the variability of the pooled indices of predictive values. This in turn enlarges the con-fidence intervals for the overall estimates of pre-dictive values, relative to the fixed effects model, and produces a more conservative if more realistic view of the precision of the overall estimates.
Cladribine effectively eliminates all enhancing lesions in cases of relapsing-remitting multiple sclerosis and secondary progressive multiple scle-rosis after standard therapeutic doses are adminis-tered for a period of $1 year (5, 16, 17). In this regard, the abrogation of enhancing lesions from cladribine is apparently more complete than with other immunomodulators used therapeutically in cases of multiple sclerosis. However, the mecha-nisms leading to these losses of enhancement are not precisely known, and whether the pathways of the various immunomodulators differ is specula-tive. Nonetheless, excacerbations did occur in our cohort despite the absence of enhancing lesions from six consecutive monthly MR images (cladri-bine induced or not). Conversely, only a minority of patients with enhancing lesions suffered from a relapse within 6 months. Operationally, the virtual elimination of enhancing lesions in the cladribine cohort leads to decreased sensitivities and increased specificities of putative MR markers of exacerba-tions relative to the placebo cohort, but the more important predictive values remain virtually iden-tical. Within the 6-month time frame examined herein, enhancing lesions are of limited usefulness for predicting relapse.
ag-gregate analysis. From the predictive values for re-lapse based on enhancing lesions in our longitudi-nal study, we would preferentially state that the absence of any enhancing lesions is highly predic-tive of no subsequent relapse but the presence of enhancing lesions is of substantially less value for predicting subsequent relapse.
Similarly, Kappos et al (19) concluded that en-hancing lesions seem to help identify patients with a high risk of relapses. They had found that the correlation between enhancing frequency and re-lapse rate was modest during the 1st year and weakened during the 2nd year of their study. We focused on MR events more proximate to the actual clinical event than did Kappos et al; within this time frame, there is little predictive value for re-lapse attributable to the presence of blood brain– barrier disruption.
The study presented by van Walderveen et al (20) revealed a correlation between the number of enhancing lesions at study entry and development of new enhancing lesions during the study period. This agrees with our results, and we can quantitate our findings by means of our rather high positive and negative predictive values. However, we can-not confirm acan-nother finding of the Amsterdam group, that enhancing lesions predict subsequent new black holes. In our cohort, new black holes were predicted best by their occurrence in previous months. Patients in whom production of black holes is an ongoing process have the highest like-lihood of producing new black holes, and patients in whom this process is not ongoing have a lower likelihood of producing new black holes. The pos-itive predictive value for this event was higher than the prediction of new black holes from previous new enhancing lesions or exacerbations. We there-fore suggest that accumulation of black holes may be, at least partially, an independent and self-prop-agating process; once started, further activity is likely. We suggest that the same is true for en-hancing lesions.
As black holes may well represent a long-term marker of disease severity in cases of multiple scle-rosis, it is perhaps not surprising that there is no strong level of association between new black holes and occurrence of exacerbations in cases of relaps-ing-remitting multiple sclerosis. Truyen et al (6) found no significant correlation between T1 hy-pointensity and subsequent relapse rate in cases of either relapsing-remitting multiple sclerosis or sec-ondary progressive multiple sclerosis. We confirm the lack of positive predictive value for subsequent clinical exacerbations considering the occurrence of new black holes in our cohort of patients with relapsing-remitting multiple sclerosis.
We conclude with a general comment concerning our focus and strategy in this study. During the past several years, there has been a broad paradigmatic approach to the analysis of MR imaging findings in multiple sclerosis clinical studies: this approach is correlational in nature, with emphasis on the
re-latedness (via statistical correlations) of MR im-aging findings (eg, burden of disease as determined from T1- or T2-weighted MR images) with clinical outcomes (eg, Kurtzke’s Expanded Disability Sta-tus Scale scores) (21–23). Generally, the reported correlations between clinical outcomes and radio-logic findings are lower than 0.6 and in most in-stances are approximately 0.2 to 0.4 in absolute magnitude (24, 25). In contrast, our approach rep-resents a paradigmatic shift in that we have more expressly focused on the prediction of clinical out-comes based on MR imaging findings. Our aim was to determine whether actual prediction of individ-ual clinical relapses based on MR imaging findings can be achieved with accuracy and precision. We think that the correlational approach is misplaced in the prognostic setting we have envisioned; rath-er, accurate prediction of clinical outcomes from covariate information, such as MR imaging find-ings embodied in the statistical concept of regres-sion, should immediately be more useful and mean-ingful to clinicians and patients than knowledge that MR imaging findings and the clinical course of disease are (weakly) correlated.
Conclusion
Neither the presence of enhancing lesions, the appearance of new enhancing lesions, nor the oc-currence of new hypointense lesions on contrast-enhanced T1-weighted conventional spin-echo MR images is useful for predicting, within a precise time frame of #6 months, the subsequent occur-rence of exacerbations in cases of relapsing-remit-ting multiple sclerosis. Rather, the absence of these MR imaging–derived markers is associated with a more favorable clinical course.
Acknowledgments
The authors gratefully acknowledge the support of Ernest Beutler, MD, the principal investigator of the cladribine trials at Scripps Clinic. The clinical trials were supported by the Stein Endowment Fund, Grant RR00833 from the National Institutes of Health, Johnson & Johnson Pharmaceutical Re-search Institute, SFP-1004, and the Garate Memorial Fund for multiple sclerosis research. Dr. Wagner was supported by a grant from the Deutsche Forschungsgemeinschaft, WA 1058/ 1–2.
References
1. Paty DW, Li DK. Interferon beta-1b is effective in
relapsing-remitting multiple sclerosis: II. MR analysis results of a mul-ticenter, randomized, double-blind, placebo-controlled trial: UBC MS/MR Study Group and the IFNB Multiple Sclerosis Study Group. Neurology 1993;43:662–667
2. Miller DH, Grossman RI, Reingold SC, McFarland HF. The role
of magnetic resonance techniques in understanding and man-aging multiple sclerosis. Brain 1998;121:3–24
3. Miller DH, Barkhof F, Nauta JJ. Gadolinium enhancement
in-creases the sensitivity of MR in detecting disease activity in multiple sclerosis. Brain 1993;116:1077–1094
4. Miller DH. Guidelines for MR monitoring of the treatment of
5. Romine JS, Sipe JC, Koziol JA, Zyroff J, Beutler E. A
double-blind, placebo-controlled, randomized trial of cladribine in re-lapsing-remitting multiple sclerosis. Proc Assoc Am Physicians
1999;111:35–44
6. Truyen L, van Waesberghe JH, van Walderveen MA, et al.
Ac-cumulation of hypointense lesions (‘‘black holes’’) on T1 spin-echo MR correlates with disease progression in multiple scle-rosis. Neurology 1996;47:1469–1476
7. Cohen J. A coefficient of agreement for nominal scales. Educ
Psychol Meas 1960;20:37–45
8. Fleiss JL. The statistical basis of meta-analysis. Stat Methods
Med Res 1993;2:121–145
9. Poser CM. Exacerbations, activity, and progression in multiple
sclerosis. Arch Neurol 1980;37:471–474
10. Poser CM, Paty DW, Scheinberg L, et al. New diagnostic criteria
for multiple sclerosis: guidelines for research protocols. Ann
Neurol 1983;13:227–231
11. Filippi M, Horsfield MA, Ader HJ, et al. Guidelines for using
quantitative measures of brain magnetic resonance imaging abnormalities in monitoring the treatment of multiple sclero-sis. Ann Neurol 1998;43:499–506
12. Tofts PS. Standardisation and optimisation of magnetic
reso-nance techniques for multicentre studies. J Neurol Neurosurg
Psychiatry 1998;64:S37–S43
13. Barkhof F, Filippi M, van Waesberghe JH, Campi A, Miller DH, Ader HJ. Interobserver agreement for diagnostic MR criteria in
suspected multiple sclerosis. Neuroradiology 1999;41:347–350
14. Filippi M, Rovaris M, Capra R, et al. A multi-centre longitudinal
study comparing the sensitivity of monthly MRI after stan-dard and triple dose gadolinium-DTPA for monitoring disease activity in multiple sclerosis: implications for phase II clinical trials. Brain 1998;121:2011–2020
15. O’Riordan J, Gawne Cain M, Coles A, et al. T1 hypointense
lesion load in secondary progressive multiple sclerosis: a
com-parison of pre versus post contrast loads and of manual versus semi automated threshold techniques for lesion segmentation.
Mult Scler 1998;4:408–412
16. Sipe JC, Romine JS, Koziol JA, McMillan R, Zyroff J, Beutler E.
Cladribine in treatment of chronic progressive multiple scle-rosis. Lancet 1994;344:9–13
17. Beutler E, Sipe JC, Romine JS, Koziol JA, McMillan R, Zyroff J. The treatment of chronic progressive multiple sclerosis with
cladribine. Proc Natl Acad Sci U S A 1996;93:1716–1720
18. Koudriavtseva T, Thompson AJ, Fiorelli M, et al. Gadolinium
enhanced MR predicts clinical and MR disease activity in re-lapsing-remitting multiple sclerosis. J Neurol Neurosurg
Psy-chiatry 1997;62:285–287
19. Kappos L, Moeri D, Radue EW, et al. Predictive value of
gad-olinium-enhanced magnetic resonance imaging of relapse rate and changes in disability or impairment in multiple sclerosis: a meta-analysis. Lancet 1999;353:964–969
20. van Walderveen MA, Truyen L, van Oosten BW, et al.
Develop-ment of hypointense lesions on T1-weighted spin-echo mag-netic resonance images in multiple sclerosis: relation to inflam-matory activity. Arch Neurol 1999;56:345–351
21. Prentice RL. Surrogate endpoints in clinical trials: definition
and operational criteria. Stat Med 1989;8:431–440
22. Miller DH. Multiple sclerosis: use of MR in evaluating new
therapies. Semin Neurol 1998;18:317–325
23. Molyneux PD, Filippi M, Barkhof F, et al. Correlations between
monthly enhanced MR lesion rate and changes in T2 lesion volume in multiple sclerosis. Ann Neurol 1998;43:332–339
24. Koziol JA, Wagner S, Adams HP. Assessing information in
T2-weighted MR scans from secondary progressive MS patients.
Neurology 1998;51:228–233
25. Adams HP, Wagner S, Sobel DF, et al. Hypointense and