W
. Schorner
1M. Laniado
1H. P. Niendorf2
Chr. Schubert
1R. Felix1
Received January 22. 1986; accepted after re-vision May 18. 1986.
Dedicated to Professor W. Frommhold on the occasion of his 65th birthday.
Presented at the annual meeting of the American Society of Neuroradiology. San Diego. January 1986.
This work was supported by the Bundesminis-terium fOr Forschung und Technologie. 5300 Bonn, Grant No. 01-VF-142.
1 Department of Radiology, Klinikum Charlotten-burg, Freie Universitat Berlin, Spandauer Damm 130, D-1000 Berlin 19. West Germany. Address reprint requests to W. Schorner.
2 Department of Radiology, FB Medizin, Scher-' ing AG. P.O. Box 65 03 11. D-1 000, Berlin 65, West Germany_
AJNR 7:1013-1020, November/December 1986 0195-6108/86/0706-1013
© American Society of Neuroradiology
1013
Time-Dependent Changes in
Image Contrast in Brain
Tumors After
Gadolinium-DTPA
Time-dependent changes in the contrast enhancement of tumor tissue, tumor necro-sis, perifocal edema, and normal brain tissue after IV injection of 0.1 mmol gadolinium-OTPA/kg body weight were studied with spin-echo technique (SE 800/35) in 15 patients with intracranial tumors. Using a region of interest technique, we determined the signal-intensity values of these tissues before and at fixed times up to 68.5 min after administration of the contrast agent. In tumor tissue, the 8.5 min postinjection (p.i.) scan showed a significant increase in signal intensity. The signal intensity of the tumor tissue remained significantly higher than precontrast levels throughout the entire period of observation, decreasing only slightly toward the end of the examination (48.5 and 68.5 min p.i.). Central tumor necrosis exhibited a delayed uptake of the contrast agent, with a maximum signal intensity between 48.5 and 68.5 min p.i. In perifocal edema and normal brain tissue, slight increases in signal intensity after injection of gadolinium-OTPA were measured (statistically significant in the case of edema). This effect, however, was not visually detectable. The present study shows that after one injection, scans with excellent tumor visualization can be obtained between 8.5 and 38.5 min p.i. and with diagnostically valid enhancement at least up to 68.5 min p.i.
MR imaging is
becoming
increasingly important
in
the diagnosis of
cerebral
disorders, [1-5).
Despite
the high
level
of contrast, which
is
one of the prime
advantages of MR as compared with CT,
there are various clinical situations in
which a contrast agent may be required.
It may for example be difficult,
espec
ially
in
the case of
brain
tumors,
to
differentiate
between
the tumor and the perifocal
edema, even using various pulse sequences [6-9). On the basis of the experiences
with CT, several authors view this as an indication for an MR-specific
contrast
medium [1,9).
Paramagnetic
substances can be used as MR contrast agents. Owing to their
strong local magnetic fields, they reduce the relaxation
times
of the surrounding
tissue [10). With appropriate imaging
seque
nces,
the decrease in T1 relaxation
time after administration of a paramagnetic substance results
in
an increase in the
intensity of the signal.
1014
SCHORNER
ET AL.
AJNR:7, November/December 1986The purpose of the present study of 15 patients with
intracranial tumors was to investigate the time-dependence
of changes in signal intensity of various intracranial tissues
after administration of Gd-DTPA.
Subjects and Methods
Nine female and six male patients (aged 26-71 years) with intra-cranial tumors were examined before and after intravenous injection of Gd-DTPA. The tumors included 11 cases of primary cerebral neoplasms and four cases of intracranial metastases. The diagnoses were based on the clinical findings and on the results of plain and contrast-enhanced CT. Histologic confirmation was available in 12 cases (Table 1).
A precondition for enrollment in the study was an intracranial tumor showing contrast enhancement on CT. All CT examinations (Soma-tom 2, Somatom DR 2, EMI 1010 head scanner) were performed within 1 week prior to the MR investigations.
As Gd-DTPA is an investigational drug, a strict protocol was to be adhered to in performing each examination. Therefore, patients whose general condition· was poor or who showed elevated serum creatinine or bilirubin levels were excluded from the study, as were all female patients of child-bearing age and patients below 18 years of age. Each of the patients was given detailed information, both oral and written, on the purpose of the study; and written, informed consent to perform MR with Gd-DTPA was obtained in all cases.
MR was performed using a whole-body nuclear magnetic reso-nance tomograph with a field strength of 0.35 T (Siemens Magnetom). The signal is transmitted via a head coil (internal diameter = 25 cm) capable of 1 x 1 mm nominal spatial resolution in the imaging plane. The slice thickness was 10 mm. In accordance with the CT exami-nations, a transverse scanning plane was chosen.
To find a representative slice position, we scanned with multiple-slice spin-echo (SE) sequences using a double-echo technique with a pulse repetition time (TR) of 1600 ms and echo delay times (TE) of 35 and 70 ms (SE 1600/35 and SE 1600/70). A 256 x 256 matrix and two averages were used. Scanning time for this sequence is about 14 min. After the representative slice position was established, we scanned in this position with the sequence SE 800/35. Then Gd-DTPA was injected. The postcontrast scans in the representative slice were likewise performed with the sequence SE 800/35, begin-ning at 5, 15, 25, 35, 45, and 65 min p.i., respectively. Henceforth we will refer to the postcontrast scans in terms of the temporal mid-point of each scan based on a scanning time of about 7 min (i.e., 8.5, 18.5,28.5, 38.5, 48.5, and 68.5 min p.i.).
The contrast medium used was an aqueous, stable solution of the di-N-methylglucamine salt of the DTPA complex of gadolinium (Scher-ing AG, Berlin) in a concentration of 0.5 mol/I. 0.1 mmol/kg body weight (0.2 ml/kg) was injected intravenously into the cubital vein via a plastic in-dwelling cannula (Abbocath-T 18 G) at an injection rate of approximately 10 ml/min. Immediately after injection of the contrast agent, the catheter was rinsed with 5 ml of saline solution and closed off.
The signal intensities of tumor tissue-presumably necrotic por-tions of the tumor-perifocal edema, and normal brain tissue before and after administration of the contrast agent were measured in the pre-and postcontrast SE 800/35 images. The quantitative assess-ment was performed by determining the signal intensities at the DMSC display (Siemens, Erlangen) using a region-of-interest (ROI) technique. The display allows for mean value measurements of SI of a given number of pixels included in a circular region. The region is defined by line column and area.
The signal-intensity measurements in tumor tissue were done in the enhancing portion of the lesion. When the tumor tissue was not
directly visible in the precontrast scans, the ROI was positioned on the basis of the postcontrast scans using anatomic structures as a guide.
The measurements in presumed necrotic tissue were made in those portions of the tumor that showed reduced density in plain CT scans and a lower increase in density immediately after the contrast injection than did the surrounding contrast-enhanced tumor struc-tures.
The measurements of signal intensity in perifocal edema were performed in those areas that were hyperintense in the SE 1600/70 scans but that did not display signal-intensity increases on the SE 800/35 scans after injection of Gd-DTPA. The signal intensity of normal brain tissue was measured in the white matter.
The actual size of the different ROls varied because we chose to evaluate the largest, most homogeneous ROI possible. The pre- and postinjection measurements of the signal intensity of a given structure in a given patient were always made with the same size ROI in a corresponding part of the lesion. The signal intensity was measured in arbitrary units ranging from 0 to 4096.
Each of the signal-intensity values was related to the signal inten-sity of a simultaneously measured external standard, consisting of a cylindrical plastic tube (diameter
=
2.5 cm, length=
8 cm) that contained a solution of Gd-DTPA of known concentration. This tube was attached to the inside of the head coil in such a way that the transverse scans of the head also imaged a cross section of the sample. The signal intensity of the external standard was likewise determined by an ROI technique.The purpose of referring the signal-intensity values in tissue to the signal intensity of the external standard was to neutralize temporary instrument-dependent deviations. Correction factors for each of the individual signal-intensity values in tumor, necrotic tissue, edema, and brain were obtained by dividing the signal intensity of the external standard at each scan time by the arithmetic mean of the signal-intensity values obtained for the external standard in the SE 800/35 scans performed in each patient. The signal-intensity values for tumor, necrotic tissue, edema, and normal brain-which were measured in the scan at a certain time-were then multiplied by the respective correction factor to obtain the corrected Signal-intensity values used for the quantitative evaluation.
To describe the changes in contrast enhancement produced by Gd-DTPA in a given tissue, we also calculated the difference between the pre-and postcontrast signal-intensity values for a given structure (Ll SI).
In our results, we give the median signal-intensity values and the median signal-intensity differences for all patients, and additionally list the highest and lowest values.
For tumor, "necrotic" tissue, perifocal edema, and normal brain tissue, we compared signal intensity at each postcontrast scan time with the corresponding precontrast value, using Wilcoxon's test for paired differences. The level of significance chosen was p
<
0.05. For pathologic tissues-i.e., tumor, necrotic tissue, and edema-we also compared the signal-intensity values at the various postcontrast scan times with one another, again using Wilcoxon's test for paired differences at probability p < 0.05.In addition, we assessed the effects of the contrast agent visually. The criteria for this assessment were the degree of contrast enhance-ment and the contour of the contrast-enhanced structure.
Results
Tumor Tissue
Before
administration of Gd-DTPA, the median
signal inten
AJNR:7, November/December 1986
CHANGES IN IMAGE
CONTRAST
AFTER Gd-DTPA
1015
TABLE 1: Summary of Patient Data
Average
Case Age/ Diagnosis
Histology Signal
No. Gender Intensity
Increase (%)
1 67/M Glioblastoma
+
1642 68/M Glioblastoma 137
3 71/M Glioblastoma
+
1554 26/F Ganglioglioma
+
1505 58/F Meningioma
+
1416 66/F Meningioma 117
7 65/F Meningioma
+
1128 50/F Meningioma
+
1169 46/F Meningioma
+
13410 63/F Neurinoma
+
16411 59/F Pituitary adenoma
+
13512 71/M Metastasis (colon carcinoma)
+
12513 47/F Metastasis (bronchial carcinoma) 111
14 65/M Metastasis (bronchial carcinoma)
+
14715 50/M Metastasis (unknown primary tumor)
+
214Note.- Diagnoses were established by CT and confirmed in 12 patients histologically (+ = confirmatory: - = not done).
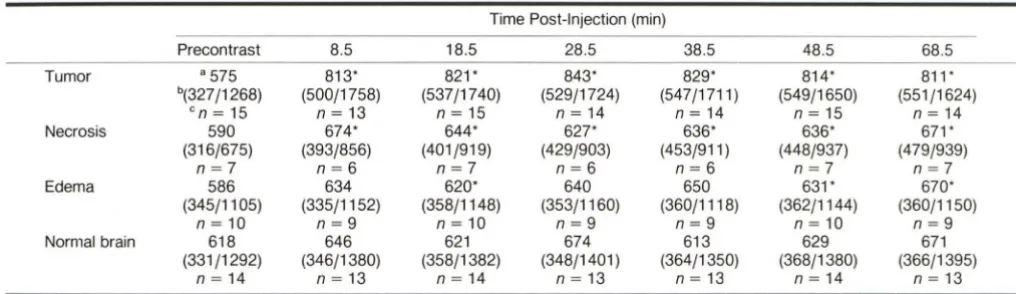
TABLE 2: Signal Intensity (51) Values on Pre- and Postcontrast Scans
Time Post-Injection (min)
Precontrast 8.5 18.5 28.5 38.5 48.5 68.5
Tumor a 575 813' 821' 843' 829' 814' 811'
b(327/1268) (500/1758) (537/1740) (529/1724) (547/1711 ) (549/1650) (551/1624)
en
= 15
n
= 13
n
= 15
n
= 14
n
=
14n
= 15
n
=
14Necrosis 590 674' 644' 627* 636' 636' 671'
(316/675) (393/856) (401/919) (429/903) (453/911 ) (448/937) (479/939)
n
=
7
n=6
n
=
7
n
=
6
n
=
6
n
=
7
n
=
7
Edema 586 634 620' 640 650 631' 670'
(345/1105) (335/1152) (358/1148) (353/1160) (360/1118) (362/1144) (360/1150)
n
= 10
n
=
9
n
= 10
n
=
9
n
=
9
n
=
10n
=
9
Normal brain 618 646 621 674 613 629 671
(331/1292) (346/1380) (358/1382) (348/1401 ) (364/1350) (368/1380) (366/1395)
n
= 14
n
= 13
n
=
14n
=
13n
=
13n
=
14n
=
13Note.-Number of measurements varies at different time points because of technical problems, patient movement, etc . • Median value of Sl
b (Lowest/highest value of Sl) en = number of measurements
• Significantly different from precontrast value (p < 0.05)
value)
.
This
increased
to 813
(500-1758)
in the
first
postcon-trast scan at
8.5
min
p
.
i
.
Median signal-intensity values
re-mained at levels of between 811 and 843
throughout the rest
of
the examination (Table
2)
.
As regards
the
differences in
signal
intensity
(tlSI) in tumor
tissue
8.5 min after administration of Gd-DTPA
,
the
median
value of signal-intensity increases was 196 (116-490).
The maximum
tlSI of 241 at
28
.
5 and 38
.
5 min p.i. was
followed
by
a slight
decrease to
228
(74-407) at
48.5
min p.i.
and
to 223
(33-409) at
68
.
5 min p.i.
(Table
3
,
Fig
.
1)
.
Statistical analysis
showed all the
postcontrast
Signal-inten-sity values to be
significantly higher
than the
precontrast
values. Comparison of the
postcontrast
'
values with one
an-other showed
that
values obtained
at
8.5, 18
.
5
,
28.5,
and
up
to 38
.
5 min p.i
.
did not differ
significantly from
one
another
,
whereas
both
the 48
.
5
and 68
.
5
min values showed significant
decreases
of signal
intensity
as compared to
the
38
.
5 min
p
.
i.
value
.
The individual analysis of each
c
ase showed that after
injection of
Gd-DTPA
there was an initial
increase
of signal
-intensity values in tumor tissue in all cases
.
Thereafter,
how-ever
,
the individual time course of signal
intensity
varied after
8
.
5
min
p.i.,
and
no
consistent pattern of time course was
found in
tumors of one type (e
.
g
.,
glioblastomas
,
meningio-mas)
.
After
the
initial
increase
,
signal intensity
remained
almost
unchanged or showed
a
slight decrease throughout the entire
postcontrast period in
seven tumors (patients 1
,
3
,
4
,
6
,
11
,
12
,
and 14)
.
In
two
patients
,
tumor tissue displayed increases
of signal
intensity in
the second half of the postcontrast period
(patients 5 and 15)
,
whereas in the remaining si
x
cases signal
intensity markedly decreased toward the end of the e
x
ami-nation
(patients 2
,
6
,
8
,
9
,
10
,
and 13)
.
[image:3.614.122.502.96.282.2] [image:3.614.51.559.328.475.2]1016
SCHORNER ET AL.
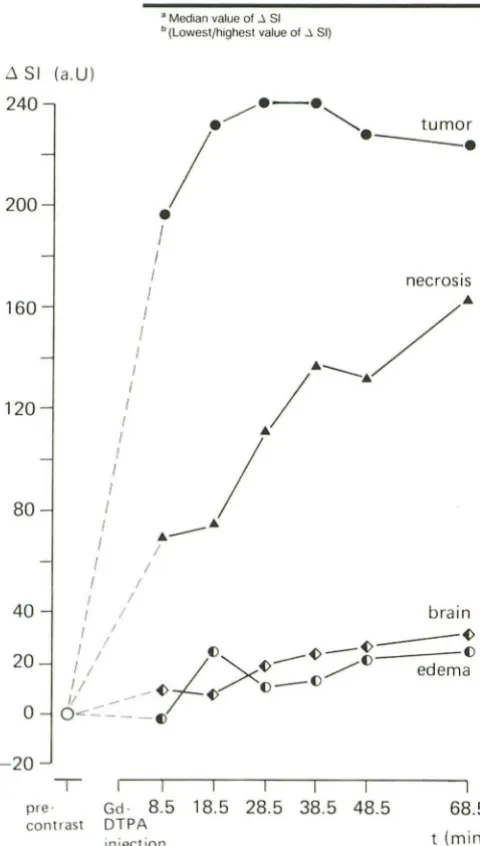
AJNR:7, November/December 1986TABLE 3: Signal Intensity Differences (/l SI) Between Pre- and Postcontrast MR Scans
Time Post-Injection (min)
8.5 18.5 28.5 38.5 48.5 68.5
Tumor "+196 +232 +241 +241 +228 +223
"(+116/+490) (+59/+472) (+78/+456) (+118/+443) (+74/+407) (+33/+409)
Necrosis +70 +74 +111 +137 +132 +163
(+32/+181) (+30/+244) (+47/+228) (+68/+236) (+31/+262) (+66/+284)
Edema -2 +24 +11 +13 +22 +24
(-32/+75) (-18/+94) (-29/+91) (-6/+72) (-21/+76) (-2/+93)
Normal brain +10 +7 +19 +23 +26 +32
(-82/+88) (-92/+90) (-78/+109) (-77/+90) (-62/+98) (-100/+103)
B Median value of ~ 51 b (Lowest/highest value of .; 51)
.6
SI (
a
.U)
240
.--.
.
/
~.
tumor
2
00
160
1
20
80
40
2
0
o
-
20
pre'
/
--.
•
I
I
necrosis
I
I
,/
j.
----
/.
I •
!
/
I • _ _ •
I
/
I
/
I /
/ /
I /
br
a
in
I /1 _ _ ~
I / () ~_~ ()
I /
;L ""-
-~--
/()
ede
m
a
1/ _~ ~()-()
//
--
~
O
..,-.:::----
C)
~
I
I
I
I
I
I
Gd·
8.5 18
.
5
28
.
5
38
.
5 48.5
68.5
contrast DTPA
t (m
i
n)
injection
Fig. 1.- Time-dependent changes in image contrast in intracranial tumors.
Differences between pre- and postcontrast MR signal intensity values (J 81) calculated for tumor, "necrotic" tissue, edema, and normal brain in 15 patients with intracranial tumors. The differences in signal intensity are given as median values.
the quantitative
findings
,
tumor
enhancement
in some of the
patients
appeared to
be
constant
throughout the
postinje
ctio
n
period
(Fig
.
3)
and to show a
decrease in others
(
Fi
gs
.
2
a
nd
4)
.
At the beginning of
the pos
t
co
n
trast
period
,
the margin
of
the conto
u
rs became less defined and it was more difficult to
distinguish borderlines between the tumor and the adjacent
brain tissue or surrounding edema
.
"
Necrotic
"
Tissue
In seven of the patients the tumor
showed
centra
l
necrosis
(patients 1,
3
,
and 11-15)
.
The median signal intensity
for
necrotic
tissue
in precontrast scans was 590 (360-675)
.
After
injection of Gd-DTPA the median signal-intensity values were
all higher than those prior to
i
n
jection (Table
2).In all patients
,
the ma
x
imum signal intensity for necrotic tissue was
meas-ured at either 48.5 or 68.5 min p
.i.
At 8.5 min p.i.
,
the
.6SI value was 70 (32-181). It rose
continuously throughout the rest of the examination period
,
reaching 163 at 68
.
5 min p
.
i
.
Only the 48
.
5 min
.6SI value of
132 was lower than the previous one at 38
.
5 min (Tab
l
e 3,
Fig
.
1).
All postcontrast signal-intensity median values were signif
-icantly
higher
compared
with
the
precontrast median value
(Table
2).Comparison of the postcontrast values with one
another revealed that signa
l
intensity at 48
.
5 min p.i
.
was
s
i
gnificantly higher than at 18
.
5 and 28
.
5 min,
and that the
value at 68.5 min p
.i.
was significantly higher than
those
at
8.5
,
18
.
5
,
and
28.5
min
.
Visual
assessment also
showed that the signal intensity of
the
central
necrotic tissue increased with time (Fig
.
2). At the
beginning
, contrast enhancement was observed main
l
y in the
peripheral areas of the
necrotic
tissue, whereas later contrast
enhancement
was
seen
in the central parts as well
.
Edema
Ten
of
the tumors
exhibited perifocal edema (patients
1-5
,
10
,
and 12-15).
The median
signal
intensity
of perifocal
edema
in
precontrast scans
was 586
(345-11
05)
.
The median
Signal-intensity values for
the postcontrast scans were in
the
r
ange of 620 to 670
(Table
2)
.
As regards the
.6SI values
, all the postcontrast
scans-with
the
exception
of
t
hat at 8.5 min
p
.
i.-had
a
.6SI of
11
to 24 (Table
3, Fig
.
1).
[image:4.615.54.294.220.643.2]AJNR:7, November/December 1986
CHANGES IN IMAGE CONTRAST AFTER Gd-DTPA
1017
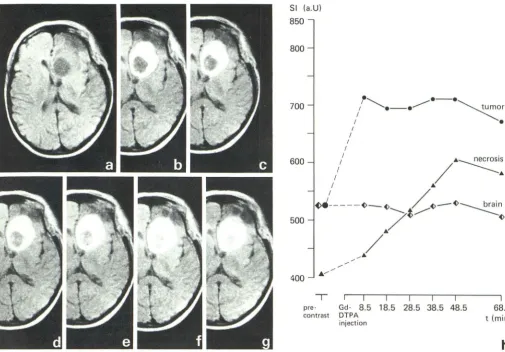
Fig. 2. -Recurrent pituitary adenoma (case 11). Series of MR scans before injection (a), 8.5 min post-injection (p.i.) (b), 18.5 min p.i. (c), 28.5 min p.i. (d), 38.5 min p.i. (e), 48.5 min p.i. (f), and 68.5 min p.i. (9) displays strong increase in image contrast in ring-shaped tumor after gadolinium-DTPA injection. There
postcontrast values with one another revealed no statistically
significant differences
.
Visually
,
these increases of signal intensity after
administra-tion of Gd-DTPA cou
l
d not be detected (Fig. 3).
Norma/ Brain Tissue
Before administration of the contrast agent
,
the median
signal
intensity for normal
brain tissue was 618 (331-1292)
.
After injection of Gd-DTPA, we found median signa
l
-intensity
values
of between 613 and 674 (Table 2) at the different time
pOints
.
The median values of
t::,.SI after administration of the
contrast medium ranged form 7 to 32 (Table 3). Statistical
analysis revealed
no
significant differences between pre- and
postcontrast SI values (Table 2). Visual assessment
likewise
revealed no effect of Gd-DTPA
on
the signal intensity of
normal brain tissue (Figs
.
2-4).
Discussion
The choice of sequence parameters is known to have a
considerab
l
e effect on contrast in MR [25
,
26]. With MR
-SI (a.U)
850
800
700
600
500
4
00
I
pre·
contrast
I
Gd·
8.5
DTPAinjection
I
I
I18.5
28
.5
38.5
I
48
.5
I
68
.5
t (min)
h
is delayed signal-intensity enhancement in central "necrotic" tissue. Part h represents quantitative data in same patient. (Parts a and b reprinted with
permission. See ref. 24.)
specific contrast media such as Gd-DTPA
it
is possible
to
influence T1, T2, and proton density and thus change image
contrast [11
-
15, 18-24]. Unlike the changes
of signal
inten-sity
produced by varying the sequence
parameters, in which
case signa
ls
from all tissues are changed accordingly
, the use
of a contrast agent may change signal intensity only in
certain
regions according to its tissue distr
i
bution
.
Both animal experiments and
clinical stud
i
es
have
shown
that the pharmacokinetics of Gd-DTPA are basically
simi
lar
to those of the known X-ray contrast media [15, 27, 28].
By virtue of the blood-brain barrier, the brain represents
a
special case as regards
the
distribution of substances that
,
like conventional X
-
ray contrast media or Gd-DTPA
,
are highly
hydrophilic and have a molecular weight of 500 or more
[29].
Only after the blood-brain barrier has been disrupted is
it possible for contrast-agent molecules
to
diffuse into
the
interstitial space
.
Thus
,
like
conventional
X-ray
contrast
agents, Gd-DTPA acts
as a marker for
lesions
of the
blood
-brain barrier [12, 30
,
31]. While it has no relevant effect upon
[image:5.614.54.559.76.427.2]1018
SCHORNER ET AL.
AJNR:7, November/December 1986SI (a
.U)
850
800
700
600
500
I
I
I
/
o
_
e
,
tumor
_
e
----
e
_ _ e
I
edema
/
~
II
~
___~
___~
________/
/
~
~/
I / / ~ ~
brain
II / / /'~- _ _ _ _ ~
,./
/~~ / '~
./
~
~
/ ~/
/
/ / /
I
I
I
I
I
I
pre· Gd·
8.5
18
.
5 28.5 38.5 48
.
5
I
68.5
t(min)
contrast DTPAinjection
f
Fig. 3. -Meningioma of the convexity (case 5). Series of MR scans before injection (a), 8.5 min post-injection (p.i.) (b), 18.5 min p.i. (c), 38.5 min p.i. (d),
and 68.5 min p.i. (e) displays slow increase in signal intensity in inhomogeneous
tumor. Part f represents quantitative data in same patient.
glioblastomas) with altered vascular structures and other
intracranial tumors (e
.g.,
meningiomas
,
neurinomas
,
adeno
-mas) of extracerebral origin
,
which possess no blood-brain
barrier
,
exhibit contrast enhancement after administration of
Gd-DTPA
[18-23].
In the tumor tissue of the patients studied
,
the first post
-contrast scan at
8
.
5
min p
.
i. showed a statist
i
cally significant
increase in signal intensity above the precontrast level.
To-ward the end of the postcontrast phase there was a drop in
signal intensity, which was likewise significant. As compared
with precontrast values
,
however
,
signal intensity remained
signif
i
cantly elevated throughout the post-injection period
in-vestigated
.
Corresponding to these figures, the best tumor
visualization with high contrast was seen in the early post
-contrast scans.
The gradual inc
r
ease in signal intensity produced by
Gd-DTPA in the central
"necrotic" area occurred somewhat later
than the marked increase in vital tumor tissue.
Since the
signal intensity of vital tumor tissue decreased toward the
end of the observation period while that of necrotic tissue
was at its peak in the later scans
, both tissues were therefore
best differentiated on the early postcontrast scans
.
The fact that conventional X-ray media and Gd-DTPA e
x
-hibit simila
r
physicochemical and pharmacokinetic properties
leads us to e
x
pect that CT and MR will show parallels as
regards the time-dependent contrast enhancement of brain
[image:6.612.56.562.81.345.2]AJNR:7, November/December 1986
CHANGES IN
IMAGE
CONTRAST AFTER Gd-DTPA
1019
Fig. 4.-Meningioma of right cerebellopontine angle (case 9). Series of MR
scans before injection (a), 8.5 min post-injection (p.i.) (b), 18.5 min p.i. (c), 28.5
min p.i. (d), 38.5 min p.i. (e), 48.5 min p.i. (f), and 68.5 min p.i. (9) displays
tumors exhibited maximum densities on later scans, which
were taken between 15 and 60 min p.i.
Likewise
,
it
is reported
that
in CT the accumulation of
contrast medium in necrotic tissue takes place later than in
the vital portions of the tumor
.
According to Norman et al.
[33]
,
maximum density values for central necrotic tissue in
contrast-enhanced CT were found 20 to 60 min p
.i.
The different kinetics of contrast agents in vital and necrotic
tumor tissue can be explained in part by differences in vas
-cularization
.
According to Norman et al. [33]
,
necrotic
tissue
in comparison with vital tissue
is a second compartment that
equilibrates at a slower rate
.
In CT
,
infusion of contrast medium is accompanied by
only
a slight density increase in perifocal edema
[34],
and
,
here
again
,
there
are analogies
to
MR
.
After administration of
Gd-DTPA
,
quantitative
evaluation
revealed
a slight,
though
diag-nostically irrelevant, increase in edema signal intensity
.
SI (a.U)
1750
1700
1600
1500
1400
~
~
I .__...
I _ __...
I •
/
\
I • ___ tumor
f ___ •
I f I
I f f f
I
I
J
J
f
I
ff
I brain
f /~ ~
/
/
~
-
~
\
~
--"
/ / /~
/
f /
.
/I /
J /
1300
~
I
•
1250
-r-
'--'1---'1'--'1'---'1 ---'
1
---~Ipre· Gd· 8.5 18.5 28.5 38.5 48.5 68.5
contrast DTPA t (min)
injection
h
strong Signal-intensity enhancement of tumor on early postcontrast scans
followed by rapid decrease in tumor enhancement on later postcontrast scans. Part h represents quantitative data in same patient.
Concerning
the
effect of Gd-DTPA on
signal
intensity
of
normal brain tissue
,
the
results
published
so far are conflicting.
In animals
,
normal
brain tissue showed
unchanged
[12] or
elevated [31]
signal-intensity
values.
Carr et al.
[21] reported
that in patients with brain tumors normal brain displayed little
or no evidence of enhancement after administration
of
Gd
-DTPA
,
whereas
changes
were
seen
in arteries
,
veins
,
and
sinuses
.
In
the
present study
,
only insignificant signal-intensity
i
n
-creases
in normal
brain tissue
were
found.
This
effect was
not visually
recognizable
,
however, and was therefore
diag-nostically
irrelevant.
In
conclusion
we found
t
hat
the already
reported
diagnostic
usefulness
of
Gd-DTP A
in brain tumors is
based
on
t
he
favorable
pharmacokinetic behavior of Gd-DTPA
,
which
doe
s
not
cross
the
intact
blood
-
brain barrier
.
Based on
the
1020
SCHORNER ET AL.
AJNR:7, November/December 1986accompanying pathologies (e.g., necrosis
,
edema)
the best
scanning
time
was
determined to be between 8.5 and 38.5
min p.i
.
Postcontrast
scans
performed
at
an
early stage
after
administration of contrast
medium have the advantage of
revealing
the
contours of
an
enhancing
tumor more clearly,
and
the
contrast
between vital tumor
and
presumed necrotic
regions
is
greater than
in later images. However, on later
images
contrast still
is
sufficient
to
obtain
images of the
tumor
in various planes
using
various
sequences
without having to
administer a second dose
.
ACKNOWLEDGMENTS
We thank Renate Kentenich, Jochen Kasbohm, and Hossein Zol-faghari for technical assistance and Martina Licht and Gregg Beasley
for help in manuscript preparation.
REFERENCES
1. Bradley WG Jr, Waluch V, Yadley RA, Wycoff RR. Comparison of CT and MR in 400 patients with suspected disease of the brain and cervical spinal cord. Radiology 1984;152:695-702 2. Bydder GM, Steiner RE, Young IR, et al. Clinical NMR imaging
of the brain: 140 cases. AJNR 1982;3:459-480, AJR 1982;139:215-236
3. Lukes SA, Crooks LE, Aminoff MJ, et al. Nuclear magnetic resonance imaging in multiple sclerosis. Ann Neural 1983;13: 592-601
4. Schorner W, Felix R, Meencke HJ. Magnetische Resonanz-Tomographie (MRT) bei Temporallappenlasionen: Eine
Untersu-chung von Patienten mit psychomotorischen Anfallen. Fortschr R6ntgenstr 1985;142: 282-287
5. Zimmerman RA, Bilaniuk L T, Grossman RI, et al. Resistive NMR of intracranial hematomas. Neuroradiology 1985;27: 16-20
6. Brant-Zawadzki M, Badami JP, Mills CM, Norman D, Newton
TH. Primary intracranial tumor imaging: a comparison of
mag-netic resonance and CT. Radiology 1984;150:435-440
7. Brant-Zawadzki M, Norman D, Newton TH, et al. Magnetic
resonance of the brain: the optimal screening technique. Radiol
-ogy 1984;152:71-77
8. McGinnis BD, Brady TJ, New PFJ, et al. Nuclear magnetic resonance (NMR) imaging of tumors in the posterior fossa. J Comput Assist Tomogr 1983;7:575-584
9. Randell CP, Collins AG, Young IR, et al. Nuclear magnetic
resonance imaging of posterior fossa tumors. AJNR
1983;4: 1 027-1 034, AJR 1983;141 :489-496
10. Pople JA, Schneider WG, Bernstein HJ. High-resolution nuclear
magnetic resonance. New York: McGraw-Hili, 1959:209-217
11. Brady T J, Goldman MR, Pykett IL, et al. Proton nuclear magnetic resonance imaging of regionally ischemic canine hearts: effect of paramagnetic proton signal enhancement. Radiology 1982;
144:343-347
12. Brasch RC, Weinmann HJ, Wesbey GE. Contrast enhanced NMR imaging: animal studies using gadolinium-DTPA complex. AJR 1984;142:625-630
13. Lauffer RB, Greif WL, Stark DD, et al. Iron-EHPG as an hepa-tobiliary MR contrast agent: initial imaging and biodistribution studies. J Comput Assist Tomogr 1985;9:431-438
14. Runge VM, Clanton JA, Herzer WA, et al. Intravascular contrast agents suitable for magnetic resonance imaging. Radiology
1984;153: 171-176
15. Wolf GL, Fobben ES. The tissue proton T1 and T2 response to
gadolinium DTPA injection in rabbits. A potential renal contrast
agent for NMR imaging. Invest Radio/1984;19:324-328
16. Laniado M, Weinmann HJ, SchOrner W, Felix R, Speck U. First
use of gadolinium-DTPAjdimeglumine in man. Physiol Chem
Phys Med NMR 1984;16:157-165
17. SchOrner W, Felix R, Laniado M, et al. Prufung des kernspinto-mographischen Kontrastmittels Gadolinium-DTPA am Mens-chen: Vertraglichkeit, Kontrastbeeinflussung und erste klinische
Ergebnisse. Fortschr R6ntgenstr 1984;140:493-500
18. Claussen C, Laniado M, Kazner E, Schorner W, Felix R. Appli-cation of contrast agents in CT and MRI (NMR): their potential in imaging of brain tumors. Neuroradiology 1985;27: 164-171
19. Claussen C, Laniado M, Schorner W, et al. The use of
gadolinium-DTPA in magnetic resonance imaging of glioblastomas and intra-cranial metastases. AJNR 1985;6:669-674
20. Carr DH, Brown J, Bydder GM, et al. Clinical use of intravenous gadolinium-DTPA as a contrast agent in NMR imaging of cerebral tumors. Lancet 1984;1 :484-486
21. Carr DH, Brown J, Bydder GM, et al. Gadolinium-DTPA as a
contrast agent in MRI: initial clinical experience in 20 patients.
AJR 1984;143:215-224
22. Felix R, Schorner W, Laniado M, et al. Brain tumors: MR imaging
with Gadolinium-DTPA. Radiology 1985;156:681-688
23. SchOrner W, Felix R, Claussen C, Fiegler W, Kazner E, Niendorf
HP. Kernspintomographische Diagnostik von Hirntumoren mit
dem Kontrastmittel Gadolinium-DTPA. Fortschr R6ntgenstr 1984;141 :511-516
24. Runge V, Schorner W, Niendorf HP, et al. Initial evaluation of
gadolinium-DTPA for contrast-enhanced magnetic resonance
im-aging. Mag Res Imaging 1985;3:27-35
25. Posin JP, Ortendahl DA, Hylton NM, et al. Variable magnetic
resonance imaging parameters: effect on detection and
charac-terization of lesions. Radiology 1985;155: 719-725
26. Semmler W, Felix R. Kontraste in der Kernspintomographie.
Fortschr R6ntgenstr 1984;141 :259-267
27. Weinmann HJ, Brasch RC, Press WR, Wesbey GE.
Character-istics of gadolinium-DTPA complex: a potential NMR contrast
agent. AJR 1984;142:619-624
28. Weinmann HJ, Laniado M, MUtzel W. Pharmacokinetics of
Gd-DTPAjDimeglumine after intravenous injection into healthy
vol-unteers. Physiol Chem Physics Med NMR 1984;16:167-172
29. Sage MR. Blood-brain barrier: phenomenon of increasing
impor-tance to the imaging clinician. AJNR 1982;3:127-138, AJR
1982;138:887-898
30. Grossman I, Wolf G, Biery D, et al. Gadolinium-enhanced nuclear
magnetic resonance images of experimental brain abscess. J
Comput Assist Tomogr 1984;8:204-207
31. Runge VM, Clanton JA, Price AC, et al. Evaluation of contrast-enhanced MR imaging in a brain-abscess model. AJNR 1985;6:139-147
32. Lange S, Steinhoff H, Aviles C, Kazner E, Grumme T.
Kontrast-mittelkinetik in zerebralen Tumoren. Fortschr R6ntgenstr
1979; 130: 666-669
33. Norman D, Stevens EA, Wing SD, Levin V, Newton TH.
Quanti-tative aspects of contrast enhancement in cranial computed tomography. Radiology 1978;129:684-688
34. Hatam A, Bergvall U, Lewander R, Larsson S, Lind M. Contrast
medium enhancement with time in computer tomography.