Long-term Changes in Runoff from a Small
Agricultural Catchment
Kazimierz BANASIK and Leszek HEJDUK
Department of River Engineering, Faculty of Civil and Environmental Engineering, Warsaw University of Life Sciences – SGGW, Warsaw, Poland
Abstract: River runoff is an important indicator of environmental changes, which usually include climate and/or land use changes, and is also the basis of catchment water management. This study presents results of monitoring and analysis of 48-year precipitation and runoff from a small agricultural catchment located in central Poland. No land use changes in that period have been reported. Mean monthly distributions of precipitation and runoff for the long-term period showed that July was the wettest month in respect of precipitation and a drier one in respect of runoff, aver-aging 12.9% and 5.2% of their annual values, respectively. To evaluate the trend of three annual hydrometeorological parameters, i.e. precipitation, runoff and runoff coefficient, the Mann-Kendall test was applied. It indicated no trend in respect of precipitation, and decreasing trends of runoff and runoff coefficient at a 95% level of significance. Lin-ear approximation of the annual runoff values indicated a decrease in runoff of ca. 1.2 mm per yLin-ear for the analysed period. A few other functions were also used for better approximation of runoff data.
Keywords: climate change; Poland; runoff variability; small watershed; trend analysis
Changes in land use, population density and climate cause spatial and temporal changes in river runoff, called also renewable water resource. For better understanding of these changes and for effec-tive management of water resources, hydrological investigations in river catchments are carried out around the world. A special case of the investiga-tion is the study of hydrological processes in site-specific, small catchments (Rodier 1976; Amatya & Trettin 2011; Mitchell et al. 2001). Some of them are focused on presenting the effect on changes in the catchment response caused by land use (Kostadinov & Mitrovic 1994; Banasik et al. 1999; Endale et al. 2006; Garbrecht 2008; Kliment & Matoušková 2008) or by climate changes (Fernandez & Garbrecht 1994; Keim et al. 1995; Holko et al. 2006; Pekarova et al. 2010), and others provide data for the testing of mathematical models of hydrological processes or form a base for the understanding of complex hydrological processes (Kovář & Kadlec 2009;
Beven 2010; Herrmann et al. 2010; Sikorska & Banasik 2010; Warmerdam & Stricker 2010).
The Zagożdżonka River, located in the centre of Poland, is presented to identify the mean an-nual distribution of precipitation and runoff as well as to determine trends in the annual values of hydrometeorological parameters.
MATERIAL AND METHODS
Location and characteristics of the investigated area
at Płachty (51°26'43.8''N; 21°27'35.6''E), have been carried out by the Department of Water Engineer-ing of Warsaw University of Life Sciences since 1962. Daily values of precipitation and discharge were taken for analysis from the period of 48 hy-drological years (1963–2010). In the initial period, the river water stages were recorded by an observer who read the staff gauge three times a day, except flood periods when reading was usually carried out each hour. Since 1980 the monitoring of the river water stages was carried out with the use of a mechanical water stage recorder, and since the middle of the last decade of the previous century with the use of an electronic system for data record-ing, logging and transmitting. In recent periods,
the traditional reading of the staff gauge once a day has continued for checking the records and eliminating possible errors. For precise estimation of the river flow a rating curve has been estab-lished and verified at least once a year based on hydrometric measurements (Byczkowski 1999) conducted ca. 10–12 times a year. A view of this natural channel gauging station at Płachty is shown in Figure 2 and a view of the meteorological site at Czarna is in Figure 3.
The catchment area at the Płachty gauging sta-tion is 82.4 km2. The lowland catchment of the
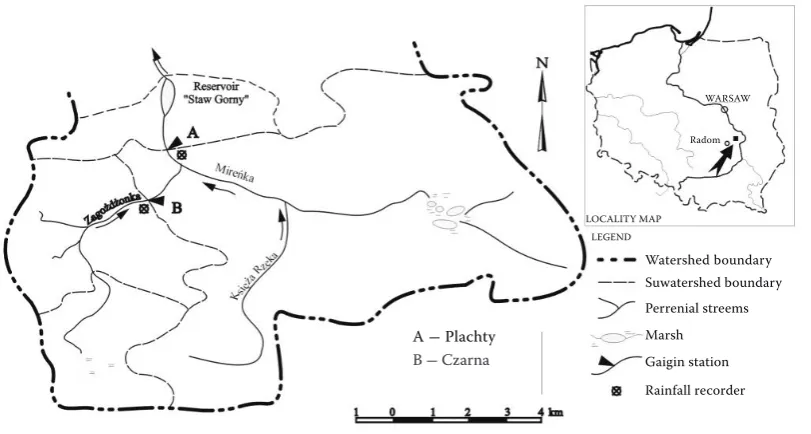
[image:2.595.96.502.82.299.2]Zagożdzonka River has topography typical of this part of Poland. The mean elevation of the catchment is about 163 m above sea level, and Figure 1. Locality map of the Zagożdżonka catchment and gauging stations
Figure 2. View of the stream gauge station at Płachty
(the photo is looking downstream) Figure 3. Meteorological gauging station at Czarna in Zagożdżonka catchment WARSAW
Radom
LOCALITY MAP
Watershed boundary Suwatershed boundary Perrenial streems Marsh Gaigin station Rainfall recorder A - Plachty
B - Czarna
[image:2.595.66.290.549.721.2] [image:2.595.305.532.551.721.2]the absolute relief is 37.0 m, i.e. from 147.5 to 184.5 m a.s.l. (upstream of A, Figure 1). The mean slopes of the main channels range from 2.5 to 3.5 m per 1000 m. Local depressions, which do not contribute to direct runoff and sediment outflow from the catchment, constitute a significant part of the area, i.e. 19.8 km2 upstream of the Płachty
gauging station.
Land use is dominated by arable land (small grains and potatoes), which take up about 48% of the catchment, and about 41% is covered by forest and 11% is pasture (Banasik 1994). Sandy soils are dominant in the watershed area (loamy sand, 27.2%; light loamy sand, 60.6%; and organic soils, 12.1%).
Precipitation and runoff – source of data
The mean annual precipitation and runoff for the hydrological years 1963–2010 are estimated at
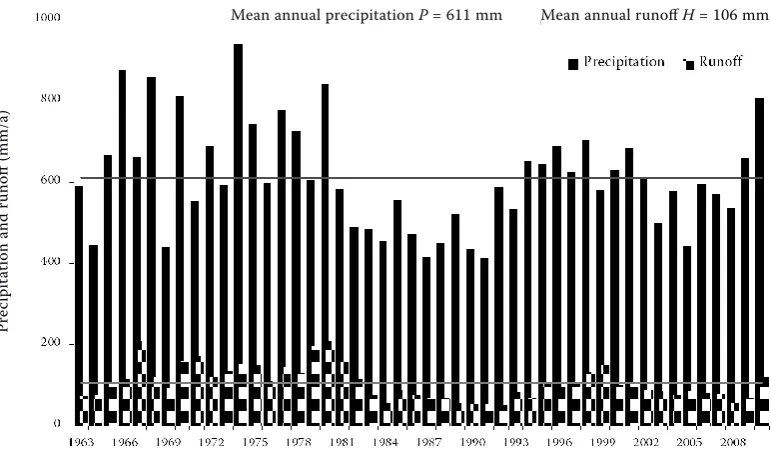
[image:3.595.95.481.81.308.2]611 mm and 106 mm, respectively, based on data collected by the Department of Water Engineering of Warsaw University of Life Sciences ‒ SGGW at Płachty, except precipitation data for the pe-riod 1963–1982, which were taken from available publications of the Polish hydrometeorological service (IMGW) for the nearest rain gauge, Zwolen (located about 15 km west of the Czarna gaug-ing station). The maximum and minimum values of annual precipitation are 941 mm (1974) and 414 mm (1991), respectively. Maximum annual runoff of 209 mm was measured in 1980, and the minimum of 52 mm was measured in 1992. Annual runoff coefficients (the ratio of runoff to precipitation) for the area of the Płachty gauging station range from 0.088 (1992) to 0.320 (1979), with the mean value of 0.173. Annual values of precipitation and runoff are shown in Figure 4. Statistical characteristics of the analysed series are presented in Table 1.
Figure 4. Annual precipitation and runoff depths for the Zagożdżonka catchment upstream of the Płachty gauge station for the hydrological years 1963–2010
Table 1. Main parameters of statistical series of precipitation, runoff and runoff coefficient for Zagożdżonka catch-ment at the Płachty gauge station for the period of 48 years (1963–2010)
Characteristics of the annual value Mean value SD Relative SD Skewness
Precipitation, P (mm) 611.2 129.4 0.212 0.558
Runoff, H (mm) 105.9 41.9 0.392 0.881
Runoff coefficient, c (–) 0.173 0.057 0.327 1.276
SD – standard deviation
Pr
ec
ipit
ation and r
unoff (mm/a)
[image:3.595.65.531.666.736.2]RESULTS AND DISCUSSION
Mean monthly distribution of precipitation and runoff in the 48-year period
Mean monthly distributions of precipitation, runoff and discharge for the period of 48 years are repre-sented in Figure 5. One can see from data prerepre-sented in Table 2 and Figure 5 that in respect of mean long-term precipitation, the wettest month is July with rainfall depth of 78.7 mm, i.e. 12.9% of the annual value, and the driest one is January with the equiva-lence of rainfall and snowfall depth of 31.6 mm, i.e. 5.2% of the annual value. In respect of mean long-term runoff, the wettest month is March with runoff depth of 15.5 mm, i.e. 14.7% of the annual value and the driest one is July with runoff depth of 5.4 mm i.e. 5.1% of the mean annual runoff.
Trend analysis of annual precipitation, runoff and runoff coefficient
To evaluate the trend of the three parameters, the Mann-Kendall test was selected as it is simple to use and it is often applied for climatological and hydrological trend analysis (Hipel & McLeod 1994; Khambhammettu 2005; Kundzewicz et al. 2005; Hamed 2008; Sahooa & Smith 2009; Węglarczyk 2010). The analysis procedure is presented with the use of annual values of precipitation, runoff and runoff coefficient, as described earlier. The Mann-Kendall test is a non-parametric test for identifying monotonic trends in time series data. One benefit of this test is that the data does not need to conform
to any particular distribution. The data values are evaluated as ordered time series. Each data value is compared with all subsequent data values. The initial value of the Mann-Kendall statistic, S, is assumed to be 0 (e.g. no trend). If a data value from a later time period is higher than a data value from an earlier time period, S is incremented by 1. On the other hand, if a data value from a later time period is lower than a data value estimated earlier, S is decremented by 1. The net result of all such increments and decrements yields the final value of S. Let x1, x2, … xnrepresent n data points where xjrepresents the data point at time j. Then the Mann-Kendall statistic (S) is given by the following formula:
[image:4.595.305.532.85.245.2](1)
Table 2. Monthly and annual values of precipitation and discharge in the Zagożdżonka River at the Płachty gauge station in the period of 1963–2010
Period XI XII I II III IV V VI VII VIII IX X Annual
Precipitation, P
P (mm) 43.5 38.9 31.6 31.9 33.1 43.9 62.6 75.2 78.7 72.5 57.1 42.3 611.2
Relative P (%) 7.1 6.4 5.2 5.2 5.4 7.2 10.2 12.3 12.9 11.9 9.3 6.9 100.0
Discharge, SQ
SQ (m3/s) 0.255 0.303 0.319 0.366 0.477 0.389 0.232 0.192 0.166 0.183 0.187 0.254 0.277
Relative SQ (%) 92.9 109.5 115.2 132.3 172.6 140.8 83.8 69.3 59.9 66.3 67.7 92.0 100.0
Runoff, H
H (mm) 8.0 9.8 10.4 10.7 15.5 12.2 7.5 6.0 5.4 6.0 5.9 8.3 105.9
[image:4.595.65.535.584.759.2]Relative H (%) 7.6 9.3 9.8 10.2 14.7 11.6 7.1 5.7 5.1 5.6 5.6 7.8 100.0
Figure 5. Mean annual distribution of precipitation and runoff in the Zagożdżonka catchment at the Płachty gauge station for the period 1963–2010
11 1
)
(
sign
n
k n
k
j j k
x
x
S
Months of hydrological year
N D J F M A M J J A S O
Pr
ec
ipit
ation/r
unoff (mm/mon
th)
80
60
40
20
where:
(2)
A very high positive value of S is an indicator of an increasing trend, and a very low negative value indicates a decreasing trend. However, it is neces-sary to compute the probability associated with S and the sample size, n, to statistically quantify the significance of the trend (Khambhammettu 2005). The Mann-Kendall statistics S for the ana-lysed parameters, computed according to Eq. (1) and (2), are given in Table 3.
Based on the normalised test statistic Z, comput-ed from the following formula (i.e. Węglarczyk 2010):
(3)
where:
VAR(S) – variance of S estimated, as the sample size is large, i.e. n > 30, by the equation:
(4)
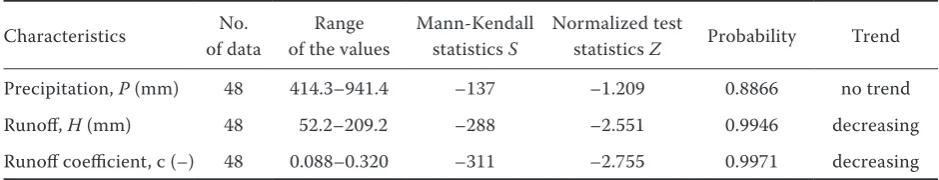
The probability, associated with the normalised test statistic Z, was computed using the Microsoft Excel function NORMSDIST. The computed values of normalised test statistic Z and probability are given in Table 3. The trend is said to be decreasing if Z is negative and computed probability is greater than the level of significance (95% typically). So, no trend was detected in the case of 48 years of annual precipitation values. Both for the series of annual runoff depths and annual runoff coefficients decreased trends were detected at the probability level of 95% (Table 3). The variation of annual runoff with time is discussed in the next chapter.
Temporal variations of annual values of runoff in the period 1963–2010
To analyse the variation of annual values of runoff from the Zagożdżonka catchment at the Płachty gauge station with time, the relations of two types were selected. The first one was composed of three commonly used relationships, i.e.:
linear trend:
y = a + bt (5)
periodic cycle
(6)
and linear trend with periodic cycle
(7)
where:
y – dependent value (annual runoff in mm)
t – independent value (hydrological year, i.e. 1963, 1964, …, 2010)
a, b, c and d – estimated parameters
As the annual values of runoff from 1963–2010 are higher in the first part of the period with a drop at the beginning of the 1980s (Figure 4), the other two relationships of runoff versus time are also presented, one from a group of transition functions and the other from a group of peak func-tions. To estimate the parameters of the earlier and later functions the TableCurve 2D software (Systat Software Inc., 2002) was used. In the case of the later functions the best fit functions from both groups were selected. The following func-tions were selected:
from the set of transition functions, the Log Normal Cumulative function:
[image:5.595.62.532.667.757.2] 0 1 0 0 0 1 ) ( sign k j k j k j k j x x if x x if x x if x x
Table 3. Mann-Kendall trend results (trend at 95% level of significance)
Characteristics of dataNo. of the valuesRange Mann-Kendall statistics S Normalized test statistics Z Probability Trend
Precipitation, P (mm) 48 414.3–941.4 –137 –1.209 0.8866 no trend
Runoff, H (mm) 48 52.2–209.2 –288 –2.551 0.9946 decreasing
Runoff coefficient, c (–) 48 0.088–0.320 –311 –2.755 0.9971 decreasing
2 1 ) ( VAR ) ( sign S S S
Z
( 1) (2 5)
181 ) (
VAR S n n n
d c t b a
y cos 2π
d
c
t
b
c
t
b
a
(8)
and
from the set of peak functions, the Symmetric Double Gaussian Cumulative (SDC) function:
(9)
where:
erf(...) ‒ error function
erfc(...) ‒ complementary error function
a, b, c, d, and e – estimated parameters, by the Table-Curve 2D software (Systat Software Inc., 2002), of Eq. (8) and (9) (a – intercept in mm; b –
tran-sition height in Eq. (8) and amplitude in Eq. (9), both in mm; c – transition centre in Eq. (8) and centre in Eq. (9), both as year; d – shape param-eter in Eq. (8) (–) and width in Eq. (9) (year);
e – shape parameter (year).
Parameters of Eq. (5)–(9) as well as measure of approximation functions with the recorded annual values, i.e. determination coefficients and standard errors of estimation, are presented in Table 4. The equations are also shown in Figure 6 and 7.
[image:6.595.61.532.413.735.2]The correlation coefficient of the linear rela-tionship (Eq. (5)) compared with the critical one confirms the significance (at the level of 95%) of the decreasing trend of annual runoff, which was ascertained earlier by the Mann-Kendall test. The correlation of annual runoff with time (expressed as hydrological years of the period 1963–2010), measured by determination coefficient (Table 4, column 4), becomes stronger for the periodic cycle (Eq. (6) ‒ no trend included) and for a linear trend with the periodic cycle (Eq. (7)). Parameters of both equations containing the trend element (i.e. Eq.
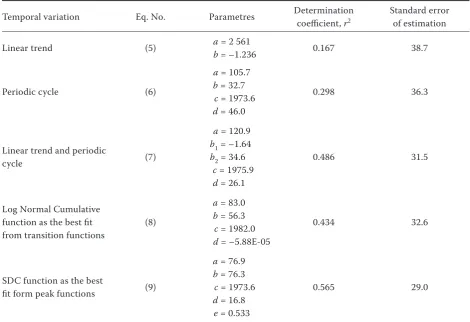
Table 4. Results of the analysis of temporal variation in runoff with various statistical relationships
Temporal variation Eq. No. Parametres Determination coefficient, r2 Standard error of estimation
Linear trend (5) ab = 2 561 = –1.236 0.167 38.7
Periodic cycle (6)
a = 105.7
b = 32.7
c = 1973.6
d = 46.0
0.298 36.3
Linear trend and periodic
cycle (7)
a = 120.9
b1 = –1.64
b2 = 34.6
c = 1975.9
d = 26.1
0.486 31.5
Log Normal Cumulative function as the best fit
from transition functions (8)
a = 83.0
b = 56.3
c = 1982.0
d = –5.88E-05
0.434 32.6
SDC function as the best
fit form peak functions (9)
a = 76.9
b = 76.3
c = 1973.6
d = 16.8
e = 0.533
0.565 29.0
a, b, b1, b2, c, d, e, – estimated parameters of the Eqs (5)-(9)
(5) and (7)) indicate the mean annual decrease in runoff of 1.24 mm and 1.64 mm for Eq. (5) and (7), respectively. The respective standard errors of both parameters are 0.403 mm and 0.358 mm. It is worth mentioning that a previous analysis of the runoff of the period of 37 years, i.e. from 1963 to 1999 (Byczkowski et al. 2001), also documented a significant decreasing trend of annual runoff with the decrease of 1.36 mm per year.
[image:7.595.78.516.84.312.2]The relatively high values of determination coef-ficients for the last two relationships (Eq. (8) and (9)), i.e. the Log Normal Cumulative function and the Symmetric Double Gaussian Cumulative (SDC) function, containing a sudden drop of runoff at the beginning of the 1980s (see parameter c in Eq. (8) and c + d/2 in Eq. (9)) may also indicate the existence of causes influencing the annual runoff. A similar drop of the warm half-year runoff in small forested Figure 6. Approximation Eqs (5)-(7) for the annual runoff of Zagożdżonka catchment at the Płachty gauge station for the period 1963–2010
Figure 7. Approximation equations 8 and 9 for the annual runoff of Zagożdżonka catchment at the Płachty gauge station for the period 1963–2010
Ann
ual r
unoff (mm)
Ann
ual r
[image:7.595.85.515.498.725.2]catchments at the beginning of the 1980s was found by Pierzgalski & Tyszka (2005). Further analysis should consider additional potential causes of the runoff decrease such as:
– meteorological parameters (i.e. air temperatures, evapotranspiration),
– land cover (i.e. crop yields).
To confirm the finding, further analysis is needed, in which also other rain and river gauges, located in the region, will be taken into account, as well as limitations of the Mann-Kendall test (DNR 2004) will be considered.
As no stream engineering works in the catchment have been reported, an increase of the analysed sample, i.e. to extend the period of observation and/or to include an earlier period into the analysis by identifying earlier annual runoff values, should help in finding the causes of the runoff decrease.
CONCLUSIONS
Results of long-term hydrological investigations provide very valuable information about the vari-ability of renewable water resources. The 48-year investigation carried out in a small agricultural catchment of the Zagożdżonka River located in the centre of Poland, characterized by mean precipita-tion of 611 mm/a and average runoff of 106 mm/a, indicated no trend in respect of precipitation, and decreasing trends of runoff and runoff coefficient at a 95% level of significance. Linear approximation of the annual runoff values indicated a decrease in runoff of ca. 1.2 mm per year for the analysed pe-riod. Mean monthly distributions of precipitation and runoff for the long period showed that July was the wettest month in respect of precipitation and a drier one in respect of runoff, averaging 12.9% and 5.2% of their annual values, respectively.
Acknowledgements. The paper was supported by a grant
from Iceland, Liechtenstein and Norway through the EEA Financial Mechanism and the Norwegian Financial Mecha-nism as well as by Polish Ministry of Sciences and Higher Education for the period 2008–2011. The support provided by these organizations is gratefully acknowledged.
References
Amatya D., Trettin C. (2011): Development of wa-tershed hydrologic research at Santee Experimental
Forest, Coastal South Carolina. Available at: http:// www.stream.fs.fed.us/afsc/pdfs/Amatya.pdf (accessed August 2011)
Banasik K. (1994): Sedimentgraph model of rainfall event in a small agricultural watershed. Theses & Monographs of Warsaw Agricultural University – SGGW, Warsaw. (in Polish with an English summary) Banasik K., Mitchell J.K., Walker S.E., Rudzka E.
(1999): Comparison of nutrient outputs from two low-land watersheds with different agricultural practices. IAHS Publ. No. 257, Wallingford, 13–16.
Beven K. (2010): Do we need research results from small basins for the further development of hydro-logical models? In: Proc. Status and Perspectives of Hydrology in Small Basins. March 30 –April 2, 2009, Goslar-Hahnenklee. IAHS Publ. No. 336, 279–285. Byczkowski A. (1999): Hydrology. Vol. I, Wydawnictwo
SGGW, Warsaw. (in Polish)
Byczkowski A., Banasik K., Hejduk L., Mandes B. (2001): Long term trends in rainfall and runoff pro-cesses in samll lowland catchments – on the base of Zagożdżonka River. In: Jaworski J., Szkutnicki J. (eds): Dynamics of Hydrological Processes in River Catchments. PTG – IMGW, Warsaw. (in Polish) DNR – Wisconsin Department of Natural Resources
(2004): Mann-Kendall Test – How to Apply Results.
ReNews, PUB-RR-716. Available at: http://dnr.wi.gov/ org/aw/rr/technical/mann.pdf (accessed December 2011).
Endale D.M., Fisher D.S., Steiner J.L. (2006): Hydrol-ogy of a zero-order southern piedmont watershed through 45 years of changing agricultural land use. Part 1. Monthly and seasonal rainfall-runoff relation-ships. Journal of Hydrology, 316: 1–12.
Fernandez G.P., Garbrecht J. (1994): Effect of trends and long-term fluctuations of rainfall on watershed runoff. Transactions of the ASABE, 37: 1841–1844. Garbrecht J.D. (2008): Multi-year precipitation
variations and watershed sediment yield in a CEAP benchmark watershed. Journal of Soil and Water Con-servation,63: 70–76.
Hamed K.H. (2008): Trend detection in hydrologic data: The Mann-Kendall trend test under the scaling hy-pothesis. Journal of Hydrology, 349: 350–363. Herrmann A., Schumann S., Holko L., Littlewood
I., Pfister L., Warmerdam P., Schroeder U. (eds) (2010): Status and Perspectives of Hydrology in Small Basins. IAHS Publ. No. 336, Wallingford.
Holko L., Herrmann A., Kulasova A. (2006): Chang-es in runoff regimChang-es in small catchments in Central Europe: Are there any? IAHS Publ. No. 308, 508–513. Keim B.D., Faiers G.E., Muller R.A., Grymes III J.M.,
Rohli R.V. (1995): Long-term trends of precipitation and runoff in Louisiana, USA. International Journal of Climatology, 15: 531–541.
Khambhammettu P. (2005): Mann-Kendall Analysis for the Fort Ord Site. USACE, HydroGeoLogic, Inc., Available at http://www.fortordcleanup.com/ar_pdfs/ AR-OU1-520C/Appendices/Appendix%20D. pdf (ac-cessed February 2011).
Kliment Z., Matoušková M. (2008): Long-term trends of rainfall and runoff regime in upper Otava River basin. Soil and Water Research, 3: 155–167.
Kostadinov S.C., Mitrovic S.S. (1994): Effect of for-est cover on the stream flow from small watersheds. Journal of Soil and Water Conservation, 49: 382–386. Kovář P., Kadlec V. (2009): Use of the KINFIL rainfall-runoff model on the Hukava catchment. Soil and Water Research, 4: 1–9.
Kundzewicz Z.W., Graczyk W., Maurer T., Pińskwar I., Radziejewski M., Svensson C., Szwed M. (2005): Trend detection in river flow series: 1. Annual maxi-mum flow. Hydrological Sciences Journal, 50: 797–810. Mitchell J.K., Banasik K., Hirschi M.C., Cooke
R.A.C., Kalita P. (2001): There is not always surface runoff and sediment transport. In: Ascough II J.C., Flanagan D.C. (eds): Proc. Int. Symp. Soil Erosion Research for the 21st Century. January 3–5, 2001,
Honolulu, 575–578.
Pekarova P., Miklanek P., Skoda P., Pekar J., Pacl J. (2010): Multi-annual discharge variability and trend analyses of the Bela River (Slovakia) in 1895–2006. In: Proc. Status and Perspectives of Hydrology in Small Basins. March 30–April 2, 2009, Goslar-Hahnenklee, IAHS Publ. No. 336, 59–64.
Pierzgalski E., Tyszka J. (2005): Water outflow during drought years in watersheds with various forest cover. Annals of Warsaw Agricultural University – SGGW, Land Reclamation, 36: 21–28.
Rodier J.A. (1976): Utilization of the results from rep-resentative and experimental basis with a view to the management of water resources. Hydrological Sci-ences Bulletin, 21: 531–544.
Sahooa D., Smith P.K. (2009): Hydroclimatic trend detection in a rapidly urbanizing semi-arid and coastal river basin. Journal of Hydrology, 367: 217–227. Sikorska A., Banasik K. (2010): Parameter identification
of a conceptual rainfall-runoff model for a small ur-ban catchment. Annals of Warsaw University of Life Sciences – SGGW, Land Reclamation, 42: 279–293. Systat Software Inc. (2002): TableCurve 2D v5.01 for
Windows. Chicago, IL, USA.
Warmerdam P., Stricker H. (2010): Fundamental hydrological research results drawn from studies in small catchments. In: Proc. Status and Perspectives of Hydrology in Small Basins. March 30–April 2, 2009, Goslar-Hahnenklee, IAHS Publ. No. 336, 47–53. Węglarczyk S. (2010): Statistics in Environmental
En-ginering. Kraków, Politechnika Krakowska. (in Polish)
Received for publication October 3, 2011 Accepted after corrections January 29, 2012
Corresponding author:
Prof. Kazimierz Banasik, Warsaw University of Life Sciences – SGGW, Faculty of Civil and Environmental Engineering, Department of River Engineering, ul. Nowoursynowska 166, PL-02-787 Warsaw, Poland