Abstract—Dengue Fever, existing throughout the contemporary history of mankind, poses an endemic threat to most tropical regions. Dengue virus is transmitted to humans mainly by the Aedes Aegypti mosquito. It has been observed that there are significantly more Aedes Aegypti mosquitoes present in tropical areas than in other climate areas. As such, it is commonly believed that the tropical climate suits the life-cycle of the mosquito. Thus, studying the correlation between the climatic factors and trend of dengue cases is helpful in conceptualising a more effective pre-emptive control measure towards dengue outbreak. In this paper, we proposed to use Wavelet transformation for data pre-processing before employing a Support Vector Machines (SVM)-based Genetic Algorithm to select the most important features. After which, regression based on SVM is used to perform forecasting of the model. The analytical result drawn from this model based on dengue data in Singapore shows improvement in prediction performance of dengue cases ahead. This can help the health control agency to improve its strategic planning for disease control to combat dengue outbreak. The experimental result arising from this model also suggests strong correlation between the monsoon seasonality and dengue virus transmission. It also confirms with previous work that mean temperature and monthly seasonality have minimal contribution to the outbreak.
Index Terms— Dengue Fever Modelling, Wavelet, SVM, Infectious Disease, Data Mining.
I. INTRODUCTION
Among all vector-borne diseases, mosquito-borne ones are one of the greatest health threats in the world. It is estimated that about 50 to 100 million people have been infected by dengue virus, which is transmitted to human mainly by the Aedes Aegypti mosquito [8]. However, mosquitoes can only survive in certain climate conditions, e.g. the Aedes Aegypti mosquito dies below the temperature of 0°C [3]. Round the world, apart from global warming, the climate has displayed enormous short-term abnormalities. This gives greater chances for mosquitoes to survive longer and penetrate
Manuscript received March 22, 2008.
Yan Wu is with the Institute of High Performance Computing, 1 Science Park Road #01-01, Singapore 117528 (phone: 65-6419-1217; fax: 65-6419-1111; e-mail: [email protected]).
Gary Lee is with the Institute of High Performance Computing, 1 Science Park Road #01-01, Singapore 117528 (e-mail: [email protected]).
Xiuju Fu is with the Institute of High Performance Computing, 1 Science Park Road #01-01, Singapore 117528 (e-mail: [email protected]).
Terence Hung is with the Institute of High Performance Computing, 1 Science Park Road #01-01, Singapore 117528 (e-mail: [email protected] .edu.sg)
through the temperate regions that were free from mosquito-borne diseases [3].
Dengue virus transmits from a female Aedes mosquito to a person or vice versa when it bites the person apart from the case of vertical transmission passes down to generations of mosquitoes.
A number of factors contribute to the time-series transmission profile of the dengue virus, e.g. geographical expansion of the presence of the Aedes mosquitoes and its associated density, the demographic distribution, mobility and susceptibility of human population and etc. This dynamic relationship is illustrated in the Fig. 1 below.
Susceptible Human Population
Dengue Infected Human Population
death infection rate
Contact Rate 1 MOSQUITO MOBILITY
HUMAN MOBILITY
Susceptible Mosquito Population death
infection rate Dengue Mosquito
Population
Contact Rate 2
birth rate
Climate Factors recover rate
birth rate
Fig.1 The dynamics of the spread of dengue virus A way to model the dynamics of the dengue outbreak is of course to precisely model every contributing element in the chain. However, it is very difficult to associate factors such as mobility of human population to an exact function in the model. Previous work done by Fu et al [2] incorporated time-lags of weather features into its model to account for these factors in its feature selection. This work assumes the usefulness of all levels of details present in the feature including noise. Although it is able to detect seasonal contributing factors to the outbreak of dengue fever, it yields a model with large dimensionality of features to describe the model which is subject to the problem of curse of dimensionality [16]. It also does not perform regression learning to test the generality of its feature selection model for case forecasting.
The following sections of this paper describe how a simple yet effective model can be constructed to accommodate the above constraints. In short, it pre-processes the data using
Detect Climatic Factors Contributing to Dengue
Outbreak based on Wavelet, Support Vector
Machines and Genetic Algorithm
Wavelet Transformation (WT) to separate information at different time resolutions superposed in the time-series. It then applies Genetic Algorithms (GA) with Support Vector Machines (SVM) for feature selection. After which, regression based on SVM is used to perform forecasting of the model. Conclusions drawn from the results of the sample dataset of dengue cases in Singapore have been studied, discussed and compared against those from [2].
II. MODEL CONSTRUCTION A. Data Representation
Data selected for the model should represent many of the variables affecting the spread of the dengue virus. Studies have shown that the population size of the mosquito depends largely on the presence of suitable breeding sites and climate conditions. As such, we can make the following generalisations of the data into and out of the model in the following manner:
‧ Variations in some of the weather data represent the breeding patterns of the Aedes mosquitoes
‧ The time-series of dengue cases in a relatively confined area represents the ensemble of the dengue spreading information such as susceptibility of human population to the virus and etc
The coding pattern of the above 2 pieces of information is unknown but most likely non-linear. Moreover, not all information at different time resolutions superposed in the time-series of an input feature, such as temperature, contributes to the fluctuation of dengue cases. It might just be one or more levels of details or trends encoded into the whole signal spectrum. In this model, the data input consists of the past dengue cases and 8 pieces of daily weather data, namely rainfall intensity, cloudiness, {max, mean and min} temperature and humidity.
B. Wavelet Decomposition
In order to separate the different levels of details encoded into all input elements of the system, wavelet decomposition of the time-series inputs is chosen. WT are similar to Fourier transforms. The fundamental difference is that instead of studying the spectral density of a give signal, WT projects the signal onto functions named wavelets with dilation parameter
a and translation parameter b of its mother wavelet:
)
(
1
)
,
(
a
b
t
a
b
a
=
ψ
−
ψ
(1)subject to the condition of:
∫
∞ +Ψ
=
Ψ
0 2)
(
ω
ω
ω
d
o is bounded (2)
where Ψ(ω) is the Fourier transform of ψ(ω) The continuous WT is defined as follows:
∫
+∞
∞ −
=
f
t
a
b
dt
f
T
a,b(
)
(
)
ψ
*(
,
)
or
)
(
),
(
)
(
,,
f
f
t
t
T
ab=
ψ
ab (3) where *,* denotes the scalar product in the space of f(t) Hence the reconstructed signal from the WT is:dc
a
da
b
a
f
T
o
t
f
∫ ∫
ab+∞ ∞ − +∞
Ψ
=
2 0 ,(
)
(
,
)
1
)
(
ψ
(4)If a finite number of terms are taken to represent the original signal, (4) can be rewritten as a multi-resolution approximation [16]:
∑
= ∧Ψ
=
N i i i ia
b
t
f
1)
,
(
)
(
ψ
(5)This can be interpreted as an ensemble of N levels of details {D1...DN} and a level of approximation {AN}. While the decomposed signals resemble the fundamental ideas of the use of time-lags, it separates signals at different levels which in turn separate potential noise from signals.
C. Genetic Algorithm
After Wavelet decomposition, each signal input into the model generates a series of daughter Wavelets inputs. As mentioned earlier, it might not be that all levels of details of all input signals are relevant and accountable for the fluctuation of the dengue cases. Thus, it is important to devise a way to filter those sub-signals that seem irrelevant to the output.
We implemented GA for this purpose with all inputs as chromosomes [14]. The evolution of chromosomes starts from the original population of data and propagates down their generations. In each generation, evaluation of the fitness of all individual in the entire population is carried out. Then, selection (a proportion of the existing population) and modification are done to form a new population and the process is repeated. In order to confirm and validate the feature selection model and generate a better representative set of contributing factors, a cross-validation technique is also introduced in this model. The converged solution of weights in 0s and 1s represents the non-selection/selection of a particular sub-signal by the GA.
D. Support Vector Machines
The core part within the GA is to construct the learning classifier. Supervised learning technique can be performed to correlate our input and output data. SVM is a renowned supervised learning method mapping the input vectors to a higher dimensional space where a maximum hyperplane is drawn [12]. In the case of SVM, given a set of input{(fi, yi)}, where yi is the corresponding output to the ith input feature fi. Φ(fi) maps fi into a higher dimensional space where a possible linear estimate function can be defined:
∑
=+
=
+
Φ
=
N i i i iT
f
b
a
y
K
f
f
b
w
t
y
1)
,
(
)
(
)
(
(6)where ( , ) ( ) ( j)
T i j
i x x x
x
)
)
,
(
2
1
min(
,
∑
−
∑
i
j i j i j j i
i
i
a
a
y
y
K
f
f
a
(7)subject to the condition of:
∑
=
≤
≤
i i i
i
C
a
y
a
0
0
where C is the capacity control penalty term. E. Regression Learning
After the SVM-based GA selects the precise features, we will then feed these features to a regression learning algorithm to generate a prediction model. If the relationship is linear, a simple linear regression can be employed. Otherwise, a SVM regression (SVR) method based on the material discussed in Section D above can be used for non-linear learning by setting a threshold ε analogous to the function of C in SVM Classification [13].
F. Model Assessment Criteria
We will compare the predicted results to the actual data in the following 2 simple ways in order to assess the model.
1. Mean Squared Error (MSE) 2. Coefficient of Determination (R2)
The above two measurements assess the correlation between the predicted data and the actual data. A smaller MSE suggests a better modelling of the actual data while a R2 of very close to 1 predicts the same result.
III. RESULTS AND DISCUSSIONS
[image:3.595.305.549.468.614.2]As dengue fever happens all year round, we gathered the dengue case and weather data in Singapore over the years of 2001 to 2006. As shown in Fig. 2 below, this set of dengue data includes 2 consecutive peaks between Week 160 & Week 250 indicated by the 2 arrows.
Fig. 2 Weekly Dengue Cases in Singapore from ‘01 to ‘06 As Singapore is an area surrounded by sea, our generalisation stated in Section IIA is applicable in this case. Thus, the trend discovered in this model in Singapore should ultimately be inferential for other areas as well.
Dengue cases over these years in Singapore are reported weekly while climate data from weather stations were collected daily. We deal with this resolution difference by
first performing Wavelet transform of the weather data before averaging the samples into weeks. At the same time, we discard the finest 3 levels of details generated by Wavelet transforms as a down-sampling by 7 makes log2(7) levels (approximately 3 levels) of details redundant. The mother Wavelet employed here is the Daubechies 6 Wavelet. The reconstruction of the signal after suppression of the finest 3 levels of details shows best approximation of the original signal when Daubechies 6 is applied as compared to other Wavelets of Daubechies 2 and 4 etc.
All the input and output vectors are then normalised before sending to GA and SVM for learning. This normalisation process makes sure that none of the variables in the feature selections process is overwhelmed by others in terms of the distance measure. In this experiment, a zero-mean univariate normalisation is employed to give equal distance measure to all features and levels of details.
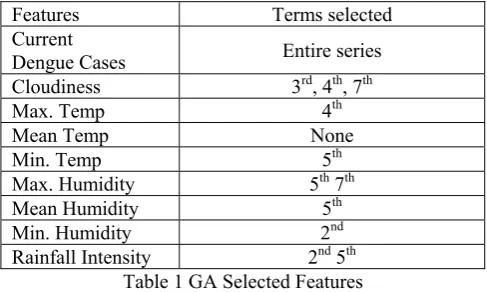
We then pass the current dengue cases and decomposed current weather series as input features with future dengue cases as output into GA with 10 cross-validations to give a general model of the data represented. A feature is selected if it is selected at least 7 times in the 10 validations cycles. The evaluation method employed in GA is a tournament with the aim of minimising the root mean squared error. A recursive method is used to tune the parameter C for best performance (C=1 in this case). There are only 13 terms selected by GA which are tabulated in Table 1 below. As compared to 50 features selected by the model in [2], the dimensionality needed to describe the dengue cases is significantly smaller in this model. In the Table, the 1st term of a feature denotes its most general trend (AN) while the 2nd to 7th term denotes different levels of details (DN to D1 respectively, where DN denotes the coarsest level of details).
Features Terms selected
Current
Dengue Cases Entire series
Cloudiness 3rd, 4th, 7th
Max. Temp 4th
Mean Temp None
Min. Temp 5th
Max. Humidity 5th 7th
Mean Humidity 5th
Min. Humidity 2nd
[image:3.595.50.287.490.674.2]Rainfall Intensity 2nd 5th Table 1 GA Selected Features
In [2], Fu suggests that time-lags of {0, 2, 6, 8, 12} weeks are considered to be important, which means a time-lag of 4 weeks is not selected. In our model, a time-lag of 4 weeks corresponds to an averaged detail of 4 weeks, i.e. 6th term in our feature vectors. From Table 1, none of the 6th terms has been selected in this model as well. Thus, both models suggest that the contribution of monthly seasonality in dengue virus transmission might not be significant
Moreover, both models suggest that the feature of “mean temperature” does not contribute to the prediction models at any level.
The general trend (7th term) present in Cloudiness and Max Humidity suggests that some positive correlation between the growth of dengue cases and the rise in these 2 features.
With GA MSE R2
Linear Regression
No Very Large* 0.15
Yes 0.083 0.96 RBF SVR No 0.27 0.75 Yes 0.091 0.92
[image:4.595.62.274.235.299.2]* Very large in MSE can be interpreted as over-fitting
Table 2 Performance of different approaches
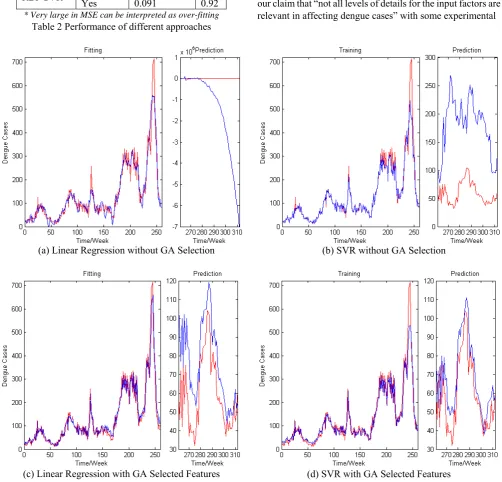
(a) Linear Regression without GA Selection
(c) Linear Regression with GA Selected Features
To investigate our claim that the coding pattern of weather data into dengue cases is likely to be non-linear, we perform linear regression with greedy constraint side-by-side with RBF (Radial Basis Function) SVR. The width γ used in RBF is set at the inverse of the sample size (312). The result is tabulated in Table 2 and the predictions are plotted in Fig. 3.
In Table 2, the trained output dengue cases from linear regression with GA yields the least MSE and the closest correlation with the actual cases. However, RBF SVR with GA does produce a similar performance as well. It can also be inferred that some of the irrelevant input features have been removed by GA in both regression techniques.
All the 4 example experiments shown in Fig 3 are carried out with data from the first 260 weeks as training sets and last 52 weeks as testing set. This is an illustration of how well the fitting and prediction are before and after performing GA feature selection. By comparing the prediction results of Fig. 3 (a) to (c) and (b) to (d), we can see that GA gives a significant boost in performance gain. This further supports our claim that “not all levels of details for the input factors are relevant in affecting dengue cases” with some experimental
(b) SVR without GA Selection
[image:4.595.47.550.287.769.2]ground. In comparison with the accuracy performance of linear regression and SVR, although linear regression yields a better overall correlation percentage, it is clear from Fig. 3 that SVR is better in the following:
‧ More reliable in prediction even in the event of over-fitting. This is demonstrated in comparison between the Prediction graphs of Fig. 3(a) and Fig. 3(b) where prediction of the linear regression goes totally out of range, that of SVR stays in the region.
‧ Better performance in prediction result, although training fitting is not as good as linear regression. This is illustrated in Prediction graphs of Fig. 3(c) and Fig. 3(d). The prediction result stays much closer to the actual result in Fig. 3(d) than that of Fig. 3(c).
IV. CONCLUSION
In this paper, we proposed the use of Wavelet decomposition as a means of data pre-processing. This technique, together with the SVM-based GA feature selection, proves to be effective in analysing a special case of infectious diseases – dengue virus infection in Singapore. We have also shown that SVR is a more stable algorithm in terms of forecasting as compared to a simple linear regression although it loses the battle in absolute linear fitting. Based on the result, we have shown that climate factors are definitely important in affecting dengue outbreak in Singapore. The analysis result drawn from this paper gives rise to more questions along the epidemiological research on dengue transmissions at least in the following ways:
‧ As low frequency terms denotes some general trends of the signal, from the results tabulated in Table 1, dengue outbreak trend seems to be closely related to the trends of rainfall and humidity.
‧ Although rise in average temperature results in accelerating mosquito’s breeding cycle, why is there no low frequency term of temperature represented in the model? Moreover, why are some moderate frequencies (between 2 – 4 months) of both max and min temperatures selected in the model?
‧ As Singapore is an area surrounded by sea, does this research finding fit well into other regions with dengue prevalence?
In order to reveal answers to these questions, further work has to be done so as to provide a more robust algorithm in predicting dengue outbreak. Predictions of longer durations ahead, such as 2 weeks onwards, can also be constructed to measure the performance of the model. While it is not possible to predict all outbreaks of diseases, a model such as this is useful in providing some form of risk assessment of the disease in a well defined area.
ACKNOWLEDGMENT
A heartfelt gratitude is expressed by all authors of this paper to National Oceanic and Atmospheric Administration (NOAA) of the U.S.A. for releasing the Singapore daily weather data free-of-charge for research and education.
REFERENCES
[1] Li Zhang, Weida Zhou, and Licheng Jiao, "Wavelet Support Vector Machine", IEEE Transactions on Systems, Man, and Cybernetics—Part B: Cybernetics, Vol. 34, No. 1, February 2004. [2] Xiuju Fu, Christina Liew, Soh, Harold Lee, Gary Hung, Terence
Lee-Ching Ng, “Time-series infectious disease data analysis using SVM and genetic algorithm”, IEEE Congress on Evolutionary Computation, 2007. CEC 2007, pg 1276-1280.
[3] Andrick, B., Clark, B., Nygaard, K., Logar, A., Penaloza, M., Welch, R., “Infectious disease and climate change: detecting contributingfactors and predicting future outbreaks”, Geoscience and Remote Sensing, 1997. IGARSS apos; 97. Remote Sensing - A Scientific Vision for Sustainable Development., 1997 IEEE International Volume 4, Issue , 3-8 Aug 1997, pp. 1947 - 1949. [4] Bartley LM, Donnelly CA, Garnett GP. “The seasonal pattern of
dengue in endemic areas: mathematical models of mechanisms”, Trans R Soc Trop Med Hyg. 2002 Jul-Aug;96(4), pp. 387-97.
[5] Bin-Sheng Liu, Yi-Jun Li, Zhan-Wen Xing, Yu-Peng Hou, Xue-Shen Sui , “Research on Freight Traffic Forecast Based on Wavelet and Support Vector Machine”, 2006 International Conference on Machine Learning and Cybernetics, Aug. 2006, pp. 2524 – 2530.
[6] Taeshik Shon, Yongdae Kim, Cheolwon Lee, Jongsub Moon,"A machine learning framework for network anomaly detection using SVM and GA", Information Assurance Workshop, 2005. IAW '05. Proceedings from the Sixth Annual IEEE SMC, June 2005, pp. 176- 183.
[7] National Environment Agency, Singapore, “Climatology of
Singapore”. [Online]. Available: http://app.nea.gov.sg/cms/htdocs/article.asp?pid=1088
[8] World Health Organisation, “Dengue Reported Cases”. [Online]. Available:
http://www.searo.who.int/en/Section10/Section332_1101.htm [9] K. Nakhapakorn and N. K. Tripathi, ”An information value based
analysis of physical and climatic factors affecting dengue fever and dengue haemorrhagic fever incidence”, International Journal of Health Geographics , Vol. 4, No. 13, 2005.
[10] E. Ooi, T. Hart, H. Tan, S. Chan, "Dengue seroepidemiology in Singapore", The Lancet, Volume 357, Issue 9257, Pages 685-686 [11] Ministry of Health, “Weekly Infectious Diseases Bulletin”. [Online].
Available:
http://www.moh.gov.sg/mohcorp/statisticsweeklybulletins.aspx [12] C.J.C. Burges, “A tutorial on support vector machines for pattern
recognition”, Data Mining and Knowledge Discovery, 2(2),pp.955-974, 1998.
[13] F. Girosi, S. Mukherjee, E. Osuna, “Nonlinear prediction of chaotic time series using support vector machines”, Proceedings of the 1997 IEEE Workshop on Neural Networks for Signal Processing, pp. 511 -520, Sep 1997.
[14] J. J. Grefenstette, Genetic algorithms for machine learning, Kluwer Academic Publishers, 1993.
[15] Bellman, R.E. “Dynamic Programming”. Princeton University Press, Princeton, NJ. 1957.
[16] Stephane G. Mallat, “Multi-resolution Approximations and Wavelet Orthonormal Bases of L2(R) ”, Transactions of the American
Mathematical Society, Vol. 315, No. 1 (Sep., 1989), pp. 69-87 [17] Gubler DJ (1998). "Dengue and dengue hemorrhagic fever". Clin.
Microbiol. Rev. 11 (3): 480–96.