DOI:10.1051/0004-6361/201322987
c
ESO 2014
Astrophysics
&
Dynamic properties of bright points in an active region
P. H. Keys
1,2, M. Mathioudakis
1, D. B. Jess
1, D. H. Mackay
3, and F. P. Keenan
11 Astrophysics Research Centre, School of Mathematics and Physics, Queen’s University Belfast, Belfast, BT7 1NN, Northern Ireland, UK
e-mail:[email protected]
2 Solar Physics and Space Plasma Research Centre (SP2RC), The University of Sheffield, Hicks Building, Hounsfield Road, Sheffield, S3 7RH, UK
3 School of Mathematics and Statistics, University of St. Andrews, North Haugh, St. Andrews, Fife, KY16 9SS, UK
Received 5 November 2013/Accepted 12 May 2014
ABSTRACT
Context.Bright points (BPs) are small-scale, magnetic features ubiquitous across the solar surface. Previously, we have observed and noted their properties for quiet Sun regions. Here, we determine the dynamic properties of BPs using simultaneous quiet Sun and active region data.
Aims.The aim of this paper is to compare the properties of BPs in both active and quiet Sun regions and to determine any difference in the dynamics and general properties of BPs as a result of the varying magnetic activity within these two regions.
Methods. High spatial and temporal resolution G-band observations of active region AR11372 were obtained with the Rapid Oscillations in the Solar Atmosphere instrument at the Dunn Solar Telescope. Three subfields of varying polarity and magnetic flux density were selected with the aid of magnetograms obtained from the Helioseismic and Magnetic Imager on board the Solar Dynamics Observatory. Bright points within these subfields were subsequently tracked and analysed.
Results.It is found that BPs within active regions display attenuated velocity distributions with an average horizontal velocity of∼0.6 km s−1, compared to the quiet region which had an average velocity of 0.9 km s−1. Active region BPs are also∼21% larger than quiet region BPs and have longer average lifetimes (∼132 s) than their quiet region counterparts (88 s). No preferential flow directions are observed within the active region subfields. The diffusion index (γ) is estimated at∼1.2 for the three regions.
Conclusions.We confirm that the dynamic properties of BPs arise predominately from convective motions. The presence of stronger field strengths within active regions is the likely reason behind the varying properties observed. We believe that larger amounts of magnetic flux will attenuate BP velocities by a combination of restricting motion within the intergranular lanes and by increasing the number of stagnation points produced by inhibited convection. Larger BPs are found in regions of higher magnetic flux density and we believe that lifetimes increase in active regions as the magnetic flux stabilises the BPs.
Key words.Sun: activity – Sun: magnetic fields – Sun: photosphere
1. Introduction
Bright points (BPs) are ubiquitous in the solar atmosphere. With field strengths of the order of a kilogauss, they are thought to be the foot-points of magnetic flux tubes that have formed as magnetic flux is advected from the centre of granules into inter-granular lanes (Stenflo 1985;Solanki 1993). Reduced pressure within the flux tube and the hot bottom effect result in BPs ap-pearing as localised intensity enhancements in the photosphere (Spruit 1976;Steiner et al. 1998;Uitenbroek & Tritschler 2006). Away from disk centre, the inclination of the partially evacu-ated flux tube allows the hot wall of the adjacent granule to be observed. Observations in theG-band (4305 Å) are often used as a proxy for studying BPs as they appear brighter due to the reduced abundance of the CH molecule at higher temperatures (Steiner et al. 2001).
The magnetic field enclosed within the boundary of a BP can act to guide waves in the solar atmosphere (de Wijn et al. 2009). Recent 3D magnetohydrodynamic models (van Ballegooijen et al. 2011; Asgari-Targhi & van Ballegooijen 2012) have in-vestigated the effect of Alfvén waves generated by the motion of BPs. In addition to being linked to Alfvén wave generation, BPs have been employed to identify locations of photospheric vortices (Bonet et al. 2008) by observing rotational elements in
their motions as they move towards downdraughts. They have also been observed in simulated studies (Vögler et al. 2005) with localised vortex flows found at the location of some simulated BPs (Shelyag et al. 2011). Observational work has also shown the propagation of waves through BPs (Jess et al. 2012a), while other research suggests they are the source of spicule oscillations (Jess et al. 2012b).
Several studies have focused on BP properties such as size, velocity distribution and peak intensity (Langhans et al. 2002;
Sánchez Almeida et al. 2004;Crockett et al. 2010;Keys et al. 2011). In particular,Keys et al. (2011) investigated the trans-verse velocities of over 6000 BPs usingG-band observations of a quiet Sun region and numerical simulations. The observed veloc-ities were as high as 7 km s−1, average velocities were 1 km s−1,
and the BP lifetime was around 90 s. This study was ex-tended to the upper photosphere/lower chromosphere using the Ca
ii
K core where delays were found in the motion of BPs between the two layers (Keys et al. 2013) along with elevated velocities observed in Caii
K BPs. A subsequent, independent study of SUNRISE data byJafarzadeh et al.(2013) found similar elevated velocities in Caii
H BPs.Berger et al.(1998) investigated quiet Sun and network BPs and found mean velocities of 1.1 km s−1 and 0.95 km s−1,
re-spectively. The results were obtained with a temporal resolution
A&A 566, A99 (2014)
of 25 s and a spatial resolution of 0.83.Criscuoli et al.(2012) studied both a decaying active region and a quiet Sun region with the Interferometric BIdimensional Spectrometer (IBIS;Cavallini 2006) and found that the velocities follow a Gaussian distribu-tion with values as high as 2 km s−1, but did not highlight any
differences between BPs found in an active region compared to a quiet region. Likewise,Möstl et al.(2006) observed BPs in a sunspot moat and found a mean velocity of 1.11±0.7 km s−1. They suggested that the velocity values are attenuated in an ac-tive region by 0.2–0.35 km s−1compared to the solar network.
Another important component related to BP dynamics is dis-persion (Berger & Title 1996;Berger et al. 1998;Möstl et al. 2006;Utz et al. 2010;Abramenko et al. 2011). The dispersion of magnetic elements is thought to be induced by photospheric flows (Hagenaar et al. 1999). A scalar diffusion coefficient (K) and the diffusion index (γ) are frequently estimated to determine the efficiency and the mechanism of diffusion, respectively. The diffusion index,γ, can be established by monitoring the squared displacement (sd) of each BP over each time-step (τ) in the BPs lifetime and is given by the relation sd∝τγ. Ifγ=1 the disper-sion is defined as normal diffusion (i.e. a random walk) whereas
whenγ < 1 the process is described as sub-diffusive and when
γ >1 the process is described as super-diffusive.
Previous studies which use BPs as tracers in establishing this diffusion have found varying values for K andγand therefore varying diffusive regimes.Lawrence & Schrijver(1993) found a sub-diffusive regime in photospheric images of an active region with sub-diffusive motions also observed in a study byCadavid et al.(1999). However,Cadavid et al.(1999) reported that the sub-diffusive motions were found for timescales of 0.3–22 min, while normal diffusion occurs in the timescale of 25–57 min. More recent studies of photospheric BPs (Abramenko et al. 2011;Chitta et al. 2012;Giannattasio et al. 2013) provide ev-idence of motions which are super-diffusive.Jafarzadeh et al.
(2014) also found super-diffusive motions in Ca
ii
H images of the lower chromosphere/upper photosphere. It has been sug-gested (Hagenaar et al. 1999) that estimations of the diffusion index may be effected by the lifetimes of the magnetic elements used to calculate the value.In this study we compare the dynamic properties of BPs such as size, lifetime, diffusivity and horizontal velocity distri-butions in simultaneously observed active and quiet Sun regions, using high spatial and temporal resolution observations of the photosphere.
2. Observations and data reduction
Observations were obtained using the Rapid Oscillations in the Solar Atmosphere (ROSA; Jess et al. 2010a) instrument at the 76 cm Dunn Solar Telescope (DST) in New Mexico, USA. Data were acquired on 2011 December 10 under ex-cellent seeing conditions that remained consistent for approx-imately 2 h. The target was AR 11372, located at N7.6W4.2 in the conventional heliographic co-ordinate system. For this study, a 9.2 Å wide filter centred at 4305 Å (G-band) was employed to study a 70×70 field-of-view (Fig.1) with a spatial scale of 0.069 pixel−1. Speckle reconstruction algorithms (Wöger
et al. 2008) were employed utilising bursts of 64 images for a single speckle reconstruction, resulting in a post reconstruc-tion cadence of 2.112 s. Image destretching was performed using a 40×40 grid (equating to a≈1.7 separation between spatial samples;Jess et al. 2008).
Line-of-sight (LOS) magnetograms for the active region were obtained with the Helioseismic and Magnetic Imager
(HMI; Schou et al. 2012) on-board the Solar Dynamics Observatory (SDO; Pesnell et al. 2012). The instrument was employed with a cadence of 45 s and a two-pixel resolution of 1.0. Additionally, one contextual HMI continuum image was obtained to aid the co-alignment of magnetograms with those from the lower solar atmosphere. The HMI data was processed with the standardhmi_preproutine, including the removal of energetic particle hits. Subsequently, subfields were chosen from the processed data, with a central pointing similar to that of the ground-based image sequences. The HMI continuum image was used to define the absolute solar co-ordinates before the ground-based observations were subjected to cross-correlation techniques to provide sub-pixel co-alignment accuracy between the two imaging sequences. Following co-alignment, the maxi-mumx- andy-displacements were both less than one tenth of a HMI pixel, or 0.05 (≈38 km). A sample of a co-aligned ROSA G-band image and a HMI magnetogram is shown in Fig.1.
The spatial resolution of the reconstructedG-band images was estimated using methods outlined by Beck et al. (2007, Appendix A) andPuschmann & Beck(2011). A spatial resolu-tion of around 0.17 was established across a range of images in the dataset. This value was found to be roughly constant through-out and is close to the theoretical diffraction limit (0.14) for the telescope at this wavelength.
3. Data analysis and results
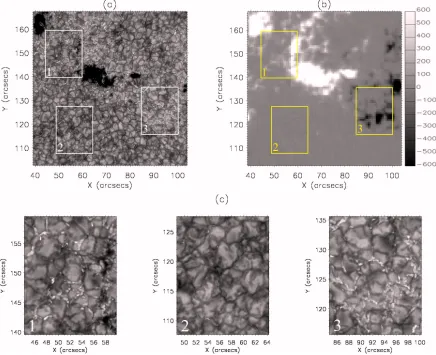
We selected three areas of equal dimensions (15.5×20) from the G-band data for further analysis (Fig. 1a). These regions were selected based on a combination of the relative density of BPs in the region, and their position with respect to the polarity of the active region as determined from co-aligned HMI images (Fig.1b). One of the regions lies between two pores of the same polarity (averageΦ =169 G; average|Φ|=169 G; Fig.1c: 1), the second in a relatively quiet region in the field-of-view (aver-ageΦ =3 G; average|Φ|=7 G; Fig.1c: 2) and the third in a region of opposite polarity to the first region, with reduced mag-netic flux (averageΦ = −101 G; average|Φ|=107 G; Fig.1c: 3). It must be stressed that the dimensions of all three regions were kept equal so that a meaningful comparison can be carried out. All results are summarised in Table1.
Once the three regions were selected, the BPs in each were tracked using the algorithm employed by Keys et al. (2011). Some of the most important aspects of this code will be dis-cussed here, but for a full discussion seeCrockett et al.(2009) and for improvements and additions implemented seeCrockett et al.(2010) andKeys et al.(2011).
The code has two main procedures; detection and tracking. The detection part of the code maps out the intergranular lanes and a binary map is produced of both the granules and the BPs. A compass search is then combined with intensity thresholding to remove granules from the resulting binary map. Because of the sharp turning points present at BP boundaries, this method allows an accurate determination of the boundaries. To avoid spurious detections of noise, the minimum threshold size for a BP to be detected is set at 4 pixels (≈10 000 km2).Crockett
et al.(2010) demonstrated that this is a suitable lower limit, with BP areas found to follow a log-normal distribution with a peak significantly above this limit. To avoid the detection of fragment-ing granules, the upper limit for BP area is set at 200 pixels (≈500 000 km2). This limit is sufficiently high to avoid
exclud-ing larger BP chains.
Fig. 1.a)Full field-of-view of the ROSAG-band image of AR 11372.b)Corresponding HMI magnetogram. The white boxes ina)and the yellow boxes inb)show the three subfields used in the study which are expanded inc). The numbers in the boxes indicate which boxes in the full field-of-view correspond to their respective expanded views. A colour bar inb)indicates the magnetic flux density (in Gauss), saturated at±600 G to assist visualisation of the field complexities.
Table 1.Summary of BP characteristics in AR 11372.
Region 1 2 3
No. of BPs 2755 851 2843
Av.Φ(G) 169 3 -105
Av.|Φ|(G) 169 7 107
Av. lifetime (s) 136±40 88±23 128±38
Av. area (km2) 29 000±2 600 24 000±2 100 28 000±2 500 Av. velocity (km s−1) 0.6±0.3 0.9±0.4 0.7±0.4
Max. velocity (km s−1) 5 7 5.3
Diffusion index (γ) 1.23±0.22 1.21±0.25 1.19±0.24 Diffusion coefficient (K; km2s−1) 109±43 123±45 137±56
algorithm to assign each detected feature with a tracking num-ber and to establish essential properties such as area and the BP barycentre. For each BP detected, the algorithm searches an area around the detected BP in subsequent frames to find associ-ated features. If another object falls within the search area, then the two features are considered as the same object and treated as such. If nothing is seen in the search area in subsequent frames, the object is considered to no longer exist. For cases in which a feature is missed in a frame before being found again in the next frame, e.g. due to a slight drop in seeing conditions in the data, the binary for the feature prior to being lost and immediately after being discovered again is used to determine the location of the missed feature. This ensures that the feature is tracked
across all frames. Important information related to each feature, such as the area and barycentre for each frame, is then recorded for future use. For this study we ignore any BP that is found to originate from or found to pass beyond the boundary of our three selected regions. This alleviates certain issues that may arise in such scenarios, particularly with regards to the lifetimes of these features.
The average horizontal velocity established for the first region in Fig. 1 (hereafter region 1) was 0.6 km s−1 from
the 2755 BPs observed. For this region the highest velocity ob-served was 5 km s−1, the average BP lifetime was 136 s and
[image:3.595.133.464.515.624.2]A&A 566, A99 (2014)
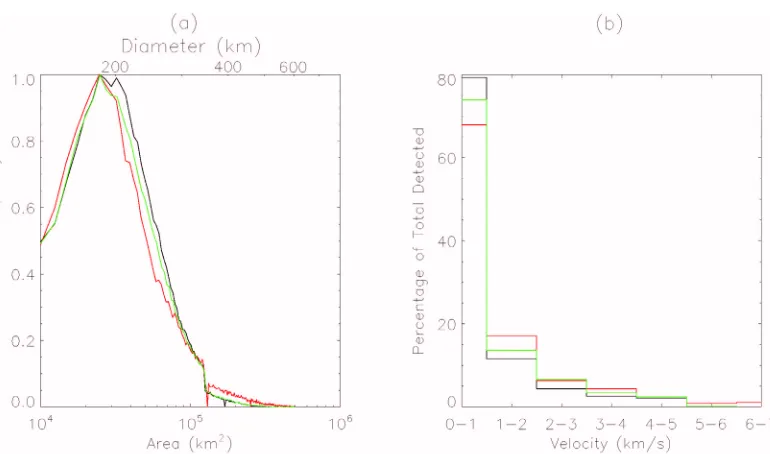
Fig. 2.a)A semi-log graph of the area distributions for the BPs observed in region 1 (black), region 2 (red) and region 3 (green). Regions with higher field strengths show slightly larger and broader peaks. Velocity histograms for the three subfields studied in AR 11372 are shown inb). Again, black, red, and green represent the distributions for region 1, 2, and 3, respectively. The quiet region (region 2) shows the presence of more elevated velocities than those found in the two more active regions.
displayed remarkably similar characteristics to the quiet Sun re-sults ofKeys et al.(2011). The average horizontal velocity for this region was found to be 0.9 km s−1, with the highest velocity
measured being∼7 km s−1. The corresponding average lifetime is 88 s and the longest-lived BP was observed for∼15 min. Our third area was located between two regions of opposite polarity within AR 11372 (hereafter region 3) and its BPs had charac-teristics similar to region 1. The average horizontal velocity of the 2843 BPs detected in this region was 0.7 km s−1, maximum
velocity 5.3 km s−1, average BP lifetime 128 s and the
maxi-mum lifetime approximately 19.5 min. In Fig.2 we show the corresponding velocity distributions for each region.
Our results highlight that BPs in active regions exist longer than their quiet Sun counterparts, with lifetimes of both region 1 (136 s) and region 3 (128 s) longer than region 2 (88 s).
The areas for the BPs were observed to follow a log-normal distribution (Fig.2). This semi-log plot reveals peaks in region 1, 2, and 3 at roughly 29 000 km2, 24 000 km2, and 28 000 km2,
respectively. This gives a∼21% increase in size from the quiet to the more active regions. The size of a BP is often reported as the diameter that one would have if assumed to be a circle. With this, the peak diameter for the three subfields considered in this study are 190 km, 175 km, and 189 km for regions 1, 2, and 3, respectively. The number of BPs detected in both active subfields is 0.38 BPs per Mm2, compared to only 0.09 BPs per Mm2in the quiet region.
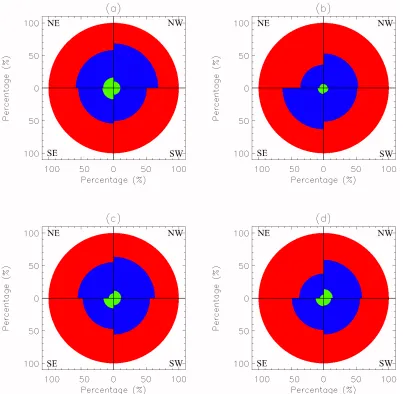
Given the ability of the algorithm to track large numbers of BPs, we decided to investigate if the BPs experience any prefer-ential flow directions in their motions within each subfield. We examined the motions in relation to the centre-point of each of the three subfields and find no overall preferential flow direction (Fig.3). In region 1, where the centre-point is between 2 pores of the same polarity, 43% of the detected BPs move away from the centre of the dataset, about 48% move towards the centre, while the remaining 9% experience no change in direction. The average velocity of those BPs moving towards or away from the centre point is 1.1 km s−1and 1 km s−1, respectively. Hence there
is no real difference in the velocities of BPs moving towards or
away from the centre of the subfield. The values are, however, slightly elevated in comparison to the average for the entire re-gion (an overall average velocity of 0.6 km s−1 was established
for this dataset). This is expected due to the fact that a BP moving towards or away from the centre point will have some velocity component. By contrast, the overall distribution will also contain stationary BPs, which will lower the mean horizontal velocity component observed for the region as a whole. In region 2 it was observed that 50% move away from the centre and 45% move towards it, with the remaining 5% experiencing no change in direction. Again, the average velocity for both moving towards and away from the centre point is slightly elevated at 1.5 km s−1
and 1.4 km s−1, respectively, when compared to the average ve-locity for the region. Within region 3 there is no preferential flow direction from the centre of the subfield, with 46% moving away from the centre point, 46% moving towards it and 8% having no preferential direction. Velocities are similar to those found in region 1.
Additionally, we studied motions about the neutral line be-tween two pores of opposite polarity in AR 113721. The neutral line was found using LOS magnetograms of region 3 and was employed as a point of reference to establish the movements between these two pores. About 51% of the BPs in the field-of-view move away from the LOS null-point and 41% move to-wards it. The velocity values for BPs moving away from the neu-tral line are 1.1 km s−1, compared to 1.3 km s−1for those moving
towards it. Figure3shows that there is some evidence of flows between quadrants in each subfield, however, more studies need to be carried out on various active region data sets to verify if these are real aspects of BP dynamics or anomalies.
Fig. 3.Polar area diagrams showing flows in four quadrants in the three subfields. The percentage of BPs in a quadrant that move towards (blue) and away from (red) the reference point are represented alongside those BPs that experience no change throughout their lifetime (green). The percentage for each flow direction in each individual quadrant is stacked as concentric arcs to aid the visualisation of flow directions within a quadrant.a),b), andc)show the flows with reference to the centre of the subfield in region 1, 2, and 3, respectively.d)shows the flows with respect to the neutral line found in region 3 with HMI LOS magnetograms.
We findγwith the gradient of the plot as the two variables are related by the equation:
sd(τ)=Cτγ, (1)
whereCis a constant of proportionality. As a value ofCcan be evaluated from the log-log plot (C = 10γintercept), we then
estab-lish the diffusion coefficient (Monin & Iaglom 1975) with the equation:
K(τ)=Cγ 4 τ
γ−1· (2)
This method finds values forγin region 1, 2, and 3 as 1.23±0.22, 1.21±0.25, and 1.19±0.24, respectively. This suggests nor-mal diffusion to slightly super-diffusive motions in the BPs in all three subfields. The corresponding diffusion coefficients for the three regions are 109±43 km2s−1, 123±45 km2s−1, and 137±
56 km2s−1, respectively. The time ranges for these estimates
of the diffusion coefficients are∼0.5–50 min,∼0.5–15.5 min, and∼0.5–19.5 min, respectively.
4. Discussion
4.1. Horizontal velocity properties and lifetimes
The histograms showing the velocity distributions for the three regions (Fig.2) reveal, as do the average and maximum trans-verse velocity values, that BPs within areas of stronger magnetic field appear to have less dynamic behaviour. BPs with higher velocities (>2 km s−1) have been linked to the production of
magneto-sonic kink waves (Choudhuri et al. 1993;de Wijn et al. 2009). Region 2 has the highest fraction of BPs with veloci-ties>2 km s−1, with about 15% of the BPs studied having
A&A 566, A99 (2014)
observed in region 1, as the HMI magnetograms show that the maximum flux density is higher in this region (≈1700 G) com-pared to region 3 (≈1100 G).
Our transverse velocities compare well with studies of BPs around active regions. Most of these (Berger et al. 1998;Möstl et al. 2006;Criscuoli et al. 2012) find mean horizontal veloci-ties for BPs in active regions in the range 1–2 km s−1, similar to
those found here. It is also noteworthy that some observations (Berger et al. 1998;Möstl et al. 2006) find that BP velocities are attenuated in active regions compared to quiet Sun regions, as in the present work. IndeedMöstl et al.(2006) find that veloci-ties in active regions are attenuated by about 0.2–0.35 km s−1,
while in our study the velocities between the quiet Sun re-gion and the two active rere-gion subfields are also attenuated by about 0.2–0.3 km s−1.
Also of note are the results with regard to region 2. The hor-izontal velocity value of 0.9 km s−1found for the 851 BPs
stud-ied is remarkably similar to the quiet Sun disk centre study of
Keys et al.(2011), who observed over 6000 BPs and determined an average velocity of 1 km s−1. These results, coupled with the
HMI magnetograms provides confidence that the subfield of re-gion 2 within the active rere-gion data presented here is indeed a quiet region. This, therefore, leads to a meaningful comparison between the quiet region and the two active region subfields. It should also be noted that the results presented here help improve our current understanding of the properties of BPs in active re-gions, as the dynamic properties are established simultaneously in quiet Sun and active region data.
With regards to BP lifetimes, the results for region 2 echo the 90 s average lifetime reported for the quiet Sun disk centre observations ofKeys et al.(2011).Criscuoli et al.(2012) find similar lifetimes for quiet Sun BPs in their study. It should be noted thatMöstl et al. (2006) report a mean lifetime of 263± 137 s for BPs observed in an active region which is longer than the value derived in the present study. However, the error bars are large in the case ofMöstl et al.(2006). Lifetimes of BPs can be difficult to ascertain exactly. The main issue arises in deter-mining when the BP first appears and then disappears. Therefore the method employed for tracking the BP can have an impact on the lifetime. For example, methods that require human input in the identification process will tend to have larger lifetime es-timates as the observer may actively look for associated features in subsequent frames and may introduce human error by actively trying to associate erroneous bright features to the BP being tracked. With fully-automated algorithms this is less of an issue but there needs to be some method for the algorithm to search for associated features or else the lifetimes will be underestimated. The algorithm used in this study looks 30 s ahead for associated features. If something is found, then it is treated as a continu-ation of the original feature. If nothing is observed within that time frame, then the feature is determined to have disappeared. We believe that the longer lifetimes displayed in the active re-gion subfields in this study are the result of a higher magnetic flux density within these regions stabilising the BPs compared to quiet regions.
4.2. Area distributions and BP numbers
The area distributions shown in Fig.2for the three regions fol-low a similar log-normal distribution to those found in previous studies (Berger et al. 1995;Beck et al. 2007;Crockett et al. 2010;
Feng et al. 2013;Keys et al. 2013).Berger et al.(1995) suggest that this distribution is the result of a fragmentation mechanism,
similar to that found in sunspot umbrae (Bogdan et al. 1988). As well as having a peak at a larger value, the width of the peak is also larger for the active regions compared to the quiet one. Such a broader distribution with a larger peak between active region and quiet Sun data is also observed byRomano et al.(2012). However, a study byFeng et al.(2013) suggests that there is lit-tle difference in both their active region and quiet Sun data with regards to the area distribution. Such differences can often be at-tributed to the resolution of the data (Berger et al. 2004;Utz et al. 2009) and the feature tracking algorithm employed, specifically in this case, how the algorithm treats BP chains (Puschmann & Wiehr 2006).
In terms of BP diameters, a study ofG-band BPs in an ac-tive region byWiehr et al.(2004) found a distribution of diam-eters between 100–300 km with the peak at 160 km. Similarly,
Romano et al.(2012) used IBIS to scan Fe
i
in both a bi-polar active region (7090 Å scan) and a quiet Sun region (6302.5 Å scan) and estimated the size distribution of BPs in both re-gions. In particular, they observed a peak in the active region distribution at 326 km and one in the quiet region at 181 km. However, the authors note that the high value found in their ac-tive region distribution is likely the result of poor seeing con-ditions during the acquisition of the dataset and the lower spa-tial resolution of IBIS.Keys et al.(2013) find similar results on the effect of spatial resolution on BP size distributions. In their study, the photospheric level of a Nai
D1 IBIS scan observed apeak in BP size distributions at a diameter of 255 km, whereas ROSAG-band images had a peak in the distribution at a diame-ter of 200 km. Given that the data in the current paper are from three subfields within the one field-of-view, our results are more readily comparable as all three subfields will be subjected to the same seeing conditions over the duration of the observations.
The number of BPs found in the active region subfields (0.38 BPs per Mm2) are again comparable to previous
esti-mates of 0.3 BPs per Mm2 (Sánchez Almeida et al. 2004)
and 0.34 BPs per Mm2(Romano et al. 2012) in active regions.
However, the value for region 2 is quite low in comparison to other studies. For example, 0.222BPs per Mm2(Romano et al. 2012) and 0.19 BPs per Mm2(Keys et al. 2011). This is likely
a consequence of the smaller field-of-view used to obtain the results, or perhaps the region selected is particularly quiet and far away from a network boundary. It should also be noted that recent estimates bySánchez Almeida et al.(2010) indicate BP densities three times higher than those found previously, with a value of 0.97 BPs per Mm2reported. The authors attribute this difference to automated detection algorithms which they argue miss fainter objects. However, there is also an argument that over segmentation of longer BP chains is undesirable as it will in-crease the density of BPs reported. The next generation of solar telescopes and instruments will aid in improving these estimates of BP number densities and area distributions as they will allow a more accurate description of BP chains, and therefore, will al-low us to determine if these chains can be segmented or not.
4.3. Flow directions and diffusion
direction. We expanded on this by analysing the flow directions in each quadrant of the three regions about the centre-point and the neutral line found in region 3. The results in Fig.3show that there are slightly elevated numbers flowing away or towards the reference point under investigation in some quadrants, for ex-ample, the polar area diagram for the motions with respect to the neutral line (Fig.3d) suggests a greater number moving away from the neutral line in the NE quadrant (i.e. towards the pore near the centre of the data set). Given that only one active re-gion was analysed in this study we cannot comment on whether such motions are a feature of the BPs dynamic properties with any degree of certainty. Also, with the lack of sufficient spatial resolution in regards to the magnetic field information for the BPs in this data set, we cannot formulate any theories or possi-ble drivers that would explain these motions or if they are just random anomalies.
To aid in defining the reasons for the attenuation of veloc-ities in region 1 and 3, we established the diffusion index (γ) and the diffusion coefficient (K) using the methods described byAbramenko et al.(2011). Our results suggest that the diff u-sion mechanism in all three regions is the same and shows that the BPs have normal diffusion (i.e. a random walk) to slightly super-diffusive motions. This is can be seen because we find values forγin region 1, 2, and 3 as 1.23±0.22, 1.21±0.25, and 1.19±0.24, respectively.
The coefficientK indicates the efficiency of the dispersion of the BPs as it measures the rate of increase in the dispersal area in units of time for all the BPs. Values forKwere found to be 109±43 km2s−1, 123±45 km2s−1, and 137±56 km2s−1
in region 1, 2, and 3, respectively. The values ofKthat we es-tablish in the three regions indicate that the BPs in region 3 ex-perience the quickest rate of diffusion while those in region 1 experience the slowest rate of diffusion of the three subfields. This may seem unusual, as one may expect regions with higher dynamic behaviour (such as region 2) to have a higher diffusion coefficient. However, the error bars on the value ofKestimated for region 3 are significantly larger than those for the other two regions.
These results, to an extent, are similar to previous studies.
Berger et al.(1998) studied BPs inG-band and found values in the range 50–80 km2s−1. When the authors reconstructed the
ve-locity field using correlation tracking techniques, they employed artificial passive corks which showed diffusion coefficients of 77, 176, and 285 km2s−1 in magnetic, network and quiet regions, respectively. Likewise, Schrijver & Martin (1990) find values of 110 and 250 km2s−1 in the core of a plage region and sur-rounding quiet regions, respectively.
The results from region 2 in this study (i.e. the quiet re-gion) are at odds with previous results. As highlighted in pre-vious studies (Hagenaar et al. 1999; Giannattasio et al. 2013), the temporal scales can effect the diffusion coefficient.Hagenaar et al.(1999) report diffusivities of 70–90 km2s−1for timescales
of less than three hours and values between 200–250 km2s−1for
timescales longer than eight hours. As the timescale that the val-ues for region 2 are estimated from are considerably short, this may influence the diffusion values we find. Also, similar to the estimation of BP lifetimes, the method for tracking the BPs may effect the diffusion coefficients estimated. Taking the example of manual feature tracking again, by over-estimating the lifetime, the squared displacement values will be higher and there may be more Lévy flights in the BP paths which would increase the esti-mates ofγandK. Furthermore, as diffusion can occur at varying spatial scales (Manso Sainz et al. 2011), the total diffusion within the region under investigation is the resultant of the diffusivity at
varying spatial scales (i.e. at granular and super-granular scales). This could lead to anomalies, however, we would only know for certain by expanding this study to numerous active region data sets.
The results with regards to the diffusion processes in these three regions do provide some important clues to the dynamic properties of BPs, however. The diffusion index established for the three regions shows that the same diffusion mechanism is found in both the quiet subfield and the active region subfields. This is important in that it shows that the motion of BPs is gov-erned mainly by the buffeting motion of the granules within which these features are confined. This would suggest that the magnetic flux is passively tracing granular evolution. This pro-cess may explain the attenuation of BP velocities in active re-gions. In an active region where convection is inhibited by the magnetic field, there will be more stagnation points at the inter-section of several granules. The motion of BPs in these stagna-tion points will be reduced and therefore will result in less dy-namic behaviour and the attenuation of the velocities. Values for Kobtained previously at both quiet and active regions (Schrijver & Martin 1990;Berger et al. 1998) appear to support a greater number of stagnation points (Giannattasio et al. 2013) in ac-tive regions which would lead to reduced velocities compared to quiet regions.
5. Conclusions
The work presented here has studied the differences in the prop-erties of BP found in both active regions and quiet Sun regions using high spatial and temporal resolution observations of the photosphere obtained with ROSA. Three subfields were consid-ered in theG-band observations of an active region: an inter-pore region, a quiet region and a negative polarity region. These were chosen using HMI magnetograms and selected for their varying magnetic environments.
The results suggest that the transverse velocity component of BPs is reduced (∼0.6 km s−1) within the two active regions
compared to BPs in quiet regions (0.9 km s−1). This is believed
to be the result of a combination of an increase in magnetic flux density within the intergranular lanes in active regions confining the BPs and the disruption of normal convection leading to an increase in the number of stagnation points. The net effect then is a reduction in the width of the velocity distributions of the BPs. BPs were observed to have longer lifetimes, on average, in the two high field strength regions (∼132 s) compared to the quiet region (88 s). Again, this is attributed to the higher field strength within the active region subfields, which we believe produces BPs with greater stability. As expected, a higher number density of BPs is observed in the active regions (0.38 BPs per Mm2), compared to the quiet region (0.09 BPs per Mm2) which is also
attributed to the higher magnetic flux density within the former. Similar to previous studies, a log-normal distribution of BP areas was observed for the active region subfields as well as for the quiet region. The peak of the distributions for the two active region subfields is both larger and broader than the quiet region subfield and suggests that BPs in active regions are∼21% larger than their counterparts in quiet regions. HMI images show that the average magnetic flux density in the quiet region (aver-age|Φ|=7 G) was much reduced in comparison to the other two regions under investigation (average|Φ| ≈138 G).
A&A 566, A99 (2014)
in previous studies on diffusivity in the photosphere. As similar values are found across the three subfields, the results support the idea that the buffeting motion of the granules controls the dynamics of the BPs. In an active region, convective processes are inhibited by the higher magnetic flux density in the region. This results in a greater number of stagnation points within the active region which acts to attenuate the velocity characteristics of BPs found in the active region, which we observe in this study. More studies should be performed to determine the extent of this effect and to what extent the higher magnetic flux density within the lanes plays a role in reducing BP velocities.
Acknowledgements. The authors wish to thank the anonymous referee whose
comments enhance the work presented. P.H.K. would like to thank Dr. Christian Beck for useful discussion of previous work. This work has been supported by the UK Science and Technology Facilities Council (STFC). Observations were obtained at the National Solar Observatory, operated by the Association of Universities for Research in Astronomy, Inc. (AURA), under cooperative agree-ment with the National Science Foundation. D.B.J. would like to thank the STFC for an Ernest Rutherford Fellowship. We are also grateful for support sponsored by the Air Force Office of Scientific Research, Air Force Material Command, USAF under grant number FA8655-09-13085.
References
Abramenko, V. I., Carbone, V., Yurchyshyn, V., et al. 2011, ApJ, 743, 133 Asgari-Targhi, M., & van Ballegooijen, A. A. 2012, ApJ, 746, 81
Beck, C., Bellot Rubio, L. R., Schlichenmaier, R., & Sütterlin, P. 2007, A&A, 472, 607
Berger, T. E., & Title, A. M. 1996, ApJ, 463, 365
Berger, T. E., Schrijver, C. J., Shine, R. A., et al. 1995, ApJ, 454, 531 Berger, T. E., Löfdahl, M. G., Shine, R. A., & Title, A. M. 1998, ApJ, 506, 439 Berger, T. E., Rouppe van der Voort, L. H. M., Löfdahl, M. G., et al. 2004, A&A,
428, 613
Bogdan, T. J., Gilman, P. A., Lerche, I., & Howard, R. 1988, ApJ, 327, 451 Bonet, J. A., Márquez, I., Sánchez Almeida, J., Cabello, I., & Domingo, V. 2008,
ApJ, 687, L131
Cadavid, A. C., Lawrence, J. K., & Ruzmaikin, A. A. 1999, ApJ, 521, 844 Cattaneo, F., Emonet, T., & Weiss, N. 2003, ApJ, 588, 1183
Cavallini, F. 2006, Sol. Phys., 236, 415
Chitta, L. P., van Ballegooijen, A. A., Rouppe van der Voort, L., DeLuca, E. E., & Kariyappa, R. 2012, ApJ, 752, 48
Choudhuri, A. R., Dikpati, M., & Banerjee, D. 1993, ApJ, 413, 811
Criscuoli, S., Del Moro, D., Giorgi, F., et al. 2012, Mem. Soc. Astron. It. Supp., 19, 93
Crockett, P. J., Jess, D. B., Mathioudakis, M., & Keenan, F. P. 2009, MNRAS, 397, 1852
Crockett, P. J., Mathioudakis, M., Jess, D. B., et al. 2010, ApJ, 722, L188
de Wijn, A. G., Stenflo, J. O., Solanki, S. K., & Tsuenta, S. 2009, Space Sci. Rev., 144, 275
Feng, S., Deng, L., Yang, Y., & Ji, K. 2013, Ap&SS, 348, 17 Giannattasio, F., Del Moro, D., Berrilli, F., et al. 2013, ApJ, 770, L36
Hagenaar, H. J., Schrijver, C. J., Title, A. M., & Shine, R. A. 1999, ApJ, 511, 932
Jafarzadeh, S., Solanki, S. K., Feller, A., et al. 2013, A&A, 549, A116 Jafarzadeh, S., Cameron, R. H., Solanki, S. K., et al. 2014, A&A, 563, A101 Jess, D. B., Mathioudakis, M., Crockett, P. J., & Keenan, F. P. 2008, ApJ, 688,
L119
Jess, D. B., Mathioudakis, M., Christian, D. J., et al. 2010a, Sol. Phys., 261, 363 Jess, D. B., Shelyag, S., Mathioudakis, M., et al. 2012a, ApJ, 746, 183 Jess, D. B., Pascoe, D. J., Christian, D. J., et al. 2012b, ApJ, 744, L5 Keys, P. H., Mathoiudakis, M., Jess, D. B., et al. 2011, ApJ, 740, L40 Keys, P. H., Mathioudakis, M., Jess, D. B., et al. 2013, MNRAS, 428, 3220 Langhans, K., Schmidt, W., & Tritschler, A. 2002, A&A, 394, 1069 Lawrence, J. K., & Schrijver, C. J. 1993, ApJ, 411, 402
Lemen, J. R., Title, A. M., Akin, D. J., et al. 2012, Sol. Phys., 275, 17 Manso Sainz, R., Martínez González, M. J., & Asensio Ramos, A. 2011, A&A,
531, L9
Monin, A. S., & Iaglom, A. M. 1975 (Cambridge, Mass., MIT Press), 882 Möstl, C., Hanslmeier, A., Sobotka, M., Puschmann, K., & Muthsam, H. J. 2006,
Sol. Phys., 237, 13
Pal, P., & Kumar, K., 2012, Eur. Phys. J. B, 85, 201
Pesnell, W. D., Thompson, B. J., & Chamberlin, P. C. 2012, Sol. Phys., 275, 3 Puschmann, K. G., & Beck, C. 2011, A&A, 533, A21
Puschmann, K. G., & Wiehr, E. 2006, A&A, 445, 33
Romano, P., Berrilli, F., Criscuoli, S., et al. 2012, Sol. Phys., 280, 407 Ribeiro, H. V., Lenzi, E. K., Mendes, R. S., & Santoro, P. A. 2011, Phys. Scr.,
83, 045007
Sánchez Almeida, J., Márquez, I., Bonet, J. A., et al. 2004, ApJ, 609, L91 Sánchez Almeida, J., Bonet, J. A., Viticchié, B., & Del Moro, D. 2010, ApJ, 715,
L26
Schou, J., Scherrer, P. H., Bush, R. I., et al. 2012, Sol. Phys., 275, 229 Schrijver, C. J., & Martin, S. F. 1990, Sol. Phys., 129, 95
Solanki, S. K. 1993, Space Sci. Rev., 63, 1
Shelyag, S., Keys, P. H., Mathioudakis, M., & Keenan, F. P. 2011, A&A, 526, A5
Spruit, H. C. 1976, Sol. Phys., 50, 269
Steiner, O., Grossmann-Doerth, U., Knoelker, M., & Schuessler, M. 1998, ApJ, 495, 468
Steiner, O., Hauschildt, P. H., & Bruls, J. 2001, A&A, 372, L13 Stenflo, J. O. 1985, Sol. Phys., 100, 189
Uitenbroek, H., & Tritschler, A. 2006, ApJ, 639, 525 Utz, D., Hanslmeier, A., Möstl, C., et al. 2009, A&A, 498, 28 Utz, D., Hanslmeier, A., Muller, R., et al. 2010, A&A, 511, A39
Van Ballegooijen, A. A., Asgari-Targui, M., Cranmer, S. R., & DeLuca, E. E. 2011, ApJ, 736, 3