ISSN Online: 2327-5227 ISSN Print: 2327-5219
DOI: 10.4236/jcc.2019.710005 Oct. 14, 2019 52 Journal of Computer and Communications
Initial Value Filtering Optimizes
Fast Global K-Means
Jintao Han, Haiming Li
*School of Computer Science and Technology, Shanghai University of Electric Power, Shanghai, China
Abstract
K-means clustering algorithm is an important algorithm in unsupervised learning and plays an important role in big data processing, computer vision and other research fields. However, due to its sensitivity to initial partition, outliers, noise and other factors, the clustering results in data analysis, image segmentation and other fields are unstable and weak in robustness. Based on the fast global K-means clustering algorithm, this paper proposed an im-proved K-means clustering algorithm. Through the neighborhood filtering mechanism, the points in the neighborhood of the selected initial clustering center have not participated in the selection of the next initial clustering cen-ter, which can effectively reduce the randomness of initial partition and im-prove the efficiency of initial partition. Mahalanobis distance was used in the clustering process to better consider the global nature of data. Compared with the traditional clustering algorithm and other optimization algorithms, the results of real data set testing are significantly improved.
Keywords
K-Means, Cluster, Neighbourhood, Mahalanobis Distance
1. Introduction
With the development of artificial intelligence, researchers have explored more and more application scenarios for intelligent algorithms [1], and various ma-chine learning algorithms have become research hotspots. Mama-chine learning al-gorithms can be roughly divided into supervised learning, unsupervised learning and semi-supervised learning. K-means algorithm is an important clustering al-gorithm in unsupervised learning [2]. It plays an important role not only in the field of big data analysis, but also in the field of computer vision, such as image segmentation [3].
How to cite this paper: Han, J.T. and Li, H.M. (2019) Initial Value Filtering Opti-mizes Fast Global K-Means. Journal of Computer and Communications, 7, 52-62.
https://doi.org/10.4236/jcc.2019.710005
Received: September 2, 2019 Accepted: October 11, 2019 Published: October 14, 2019
Copyright © 2019 by author(s) and Scientific Research Publishing Inc. This work is licensed under the Creative Commons Attribution International License (CC BY 4.0).
http://creativecommons.org/licenses/by/4.0/
DOI: 10.4236/jcc.2019.710005 53 Journal of Computer and Communications K-means algorithm is simple and easy to understand, usually as the first choice for large sample cluster analysis algorithm [4]. However, in the traditional K-means algorithm, the number of clustering centers is observed from the data according to experience, and the initial location of clustering centers is random. This results in the weak stability of the algorithm, which is easily affected by noise and outliers. In recent years, many optimization algorithms have been developed by researchers [5]-[12]. For example, paper [5] used the method of residual analysis to automatically obtain the initial cluster center and number of class clusters from the decision graph, which solves the problem of manually specify-ing the number of class clusters. However, this method is complex to implement and has poor effect on the sparsely distributed data set. In paper [6], median was used as the clustering center object and K-means++ clustering method makes the clustering effect better than traditional clustering method, but the algorithm size is large and time complexity increases. Literature [7] takes the point with the largest number of nearest neighbor data points as the initial center point, which is effectively applied to the anomaly detection of Marine data, but the corres-ponding effect of massive high-dimensional data is weak.
This paper presents a fast global K-means optimization algorithm based on neighborhood screening. On the basis of optimizing the random selection of K traditional clustering centers, the speed of searching the clustering centers in the in-itial test is improved. In addition, Mahalanobis distance [13] is used in the process of clustering, which improves the global consideration of the clustering process and makes the algorithm more suitable for application in image processing.
2. K-Means Clustering
K-means algorithm is a very classical clustering algorithm with a wide range of applications. This chapter mainly concludes this algorithm and its derived opti-mization algorithm.
2.1. Traditional K-Means Clustering
The execution process of the classic K-means algorithm is divided into the fol-lowing steps:
Step 1: The value of user input parameter K [5], which is the number of initial clustering centers and is generally obtained from given data samples based on empirical observation. The algorithm randomly generates K clustering centers
1, , ,2 k
m m m , represent clusters c c1, , ,2 ck.
Step 2: To calculate the Euclidean distance from each sample point xiin data set D to K clustering centers [6], and put the samples into the cluster c ii
(
=1,2, , k)
where the nearest clustering center is located. D=
{
x xi| i∈R im, =1,2, , n}
.Euclidean distance represents the similarity degree between the sample point and the cluster center. The smaller the distance, the higher the similarity degree. The calculation formula is shown in formula (1).
(
) (
) (
T)
,
i j i j i j
DOI: 10.4236/jcc.2019.710005 54 Journal of Computer and Communications
{
1,2, ,}
i∈ n , j∈
{
1,2, , k}
.Step 3: To calculate the mean value of all sample points in each cluster, and update all clustering centers in step 1 with the obtained mean value.
Step 4: Repeat step 1 and step 2 until the clustering center obtained two times in a row is no longer changed, then ending the clustering.
The traditional K-means clustering algorithm is simple in thought and easy to implement, which is one of the widely studied and applied clustering algorithms. However, random selection of the initial clustering center also causes unstable clustering results and clustering efficiency, as well as local optimal problems [7].
2.2. Fast Global K-Means
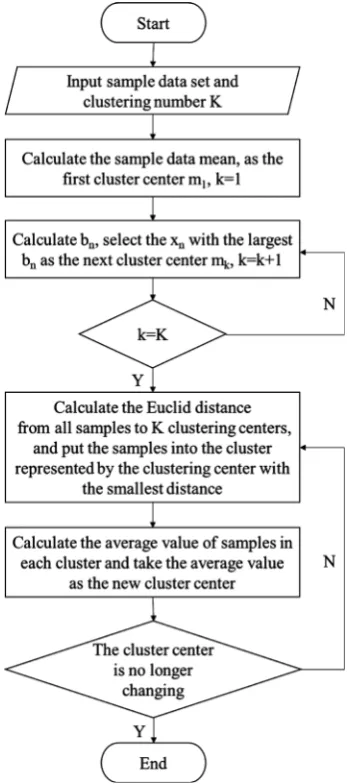
[image:3.595.286.460.315.708.2]The fast global K-means algorithm is an improvement on the traditional K-means algorithm. By considering global data, the initial clustering center is found to reduce the sensitivity of the algorithm to outliers and noise [14] [15]. The algo-rithm flow chart is shown in Figure 1.
DOI: 10.4236/jcc.2019.710005 55 Journal of Computer and Communications The calculation formula of bn is shown in formula (2). Where N is the total number of samples, dkj−1 is the minimum distance between sample point xj and k initial clustering centers, and xnis the sample points except the clustering center.
(
2)
1
1max ,0
N j
n j k n j
b =
∑
= d− − x −x(2)
This algorithm can effectively solve the random problem of the initial cluster-ing center [8], and can effectively reduce the clustering times and thus shorten the clustering time. However, in the selection process of clustering center, repeated distance calculation is required for each sample point, which increases the time complexity of initial value selection.
2.3. Global K-Means Algorithm
The global K-means algorithm mentioned in literature [9] replaces the maximum relative distance bn from the existing clustering center in the Fast Global K-means algorithm with the maximum absolute distance xn−xj 2 between two points. During the selection of the initial cluster center, dj is only calculated as the distance between the pre-selected cluster center xn and other sample points xj, and dj is summed up. Finally, the point with minimum accumulation value is selected as the clustering center.
This method reduces the computational steps when the initial cluster center is selected and reduces the time complexity of the algorithm to some extent. How-ever, the influence of the selected initial clustering center on the next initial clus-tering center is ignored, which reduces the constraint conditions of initial value selection and improves the randomness.
3. Initial Value Filtering Optimizes Fast Global K-Means
In this paper, the selection of initial cluster center is optimized by neighborhood screening. When selecting the initial clustering center, the points within the min-imum radius of the existing clustering center do not participate in the selection of the next initial clustering center, which reduces the time complexity of the Fast Global K-means algorithm in selecting the initial value. In the process of updat-ing the clusterupdat-ing center, Mahalanobis distance is used instead of Euclidean dis-tance, which increases the consideration of global data of the algorithm and is more suitable for the application of computer vision field.3.1. Neighborhood Filter
DOI: 10.4236/jcc.2019.710005 56 Journal of Computer and Communications the number of clustering centers k.
Suppose the first initial cluster center m1 is located at the middle point of the sample, and sample xmax is the farthest sample point from m1, and the distance is dmmax. In the extreme case, K initial clustering centers are evenly distributed on the line segment formed by xmax and m1, and the vertex of the line segment is two initial clustering centers, so the distance between each two initial clustering cen-ters is dr =dmmax
(
k−1)
. After comprehensive consideration, sufficient samplepoints are ensured to serve as the next initial clustering center after each initial clustering center is determined, and the time complexity of the algorithm is mi-nimized. In this paper, R is selected as formula (3)
(
)
(
)
max 2 1
m
R d= ∗ k− (3)
where k is the number of clustering centers, dmmax is the maximum distance be-tween all sample points and the first initial clustering center (i.e., sample median).
Taking the selection of the second initial clustering center as an example, calcu-late the distance dm between all samples in the initial sample set D x x
{
1, , ,2 xn}
and the first initial clustering center m1. D x x1{
1, , ,2 xm}
, the set composed of dm sample points, is selected. From D1, each sample xnis respectively selected as the second clustering center. According to formula (2), bn is calculated to deter-mine the second initial clustering center m2.Then, the distance between all sample points in D1 and m2 is calculated re-spectively, and the points whose distance is greater than the minimum radius R are formed into the set D2. m m3, , ,4 mk can be obtained according to the
above methods.
3.2. Mahalanobis Distance
In the current researches on K-means clustering algorithm, most of them con-duct clustering based on Euclidean distance, but Euclidean distance is only appli-cable to clustering of spherical structure, and the correlation between variables and the difference in importance of each variable are not considered when processing data [10]. It has some defects in the application of high correlation data and image fuzzy segmentation. Mahalanobis distance is a method of calculating distance si-milarity proposed by P. C. Mahalanobis, an Indian statistician. Can be used to calculate both follow the same distribution and its covariance matrix of the Σ degree of difference between random variables. When the covariance matrix Σ matrix for the unit, the Mahalanobis distance can be converted into Euclidean distance. The Mahalanobis distance formula is shown in formula (4).
(
) (
)
T 1(
)
,
i j i j i j
M x x = x x− Σ− x x− (4)
The xi, xj for two vectors of the same sample concentration, Σ as the cova-riance matrix of the sample, M(xi, xj) for the Mahalanobis distance between two samples.
DOI: 10.4236/jcc.2019.710005 57 Journal of Computer and Communications internal relationship between sample attributes [11], can effectively describe the global relationship between two sample points, and contains more neighborhood information and spatial information [12], which can play a better analysis effect in big data processing and image segmentation.
3.3. Average Error
The K-means clustering algorithm usually uses the square sum of clustering er-ror D to represent the clustering effect, which is the sum of the distance from each sample to K cluster centers, and is defined as the formula (5).
2 1 1
K N
i j
j
D=
∑ ∑
= x m−(5) where, xi represents the ith sample, and there are N samples, mjrepresents the jth clustering center, with a total of K clustering centers. In order to facilitate the observation of values, this paper uses the average error L to represent the clus-tering effect, which is defined as the formula (6).
1
L D
N
= (6)
For the same data set, the smaller the value of L is, the better the clustering ef-fect is.
3.4. Algorithm Steps
Steps of fast global K-means clustering algorithm based on neighborhood screen-ing and Mahalanobis distance:
Input: K: The number of cluster clusters; D: A data set containing n objects. Output: Sets and categories of K clusters Method:
(1) Calculate the median value of all samples as the initial cluster center of the first cluster, and set s = 1.
(2) Calculate the distance dj from each sample point xi to its clustering center m1, taking dmmax =max ,
( )
dj j=1,2, , n, and D1=D.(3) Calculate the minimum radius R in set Di, as shown in formula (3). (4) Set s = s + 1, if s > k jumps to (7).
(5) As m m1, , ,2 ms−1 are the first s − 1 cluster center, to calculate the
dis-tance dsj−1 from each sample xj in the set Ds−1 to the cluster center ms−1. The
new data set D x xi
{
1, , ,2 xm}
is composed of d > R sample xj.(6) To calculate bn, for example, formula (2), select the xnwith the largest bn as the s-th cluster center ms, and jump to (3).
(7) The Mahalanobis distance from x jj
(
=1,2, , n)
of all samples in set D to m ii(
=1,2, , k)
of k cluster centers is calculated respectively, and thesam-ple points are divided into clusters closest to the cluster center. (8) Calculate the sample mean N
i
DOI: 10.4236/jcc.2019.710005 58 Journal of Computer and Communications (9) Output the set, class number and average error of K clusters to end the clustering.
4. Experiment and Results
Experimental environment: Windows10 system, python3.5 development envi-ronment, Pycharm compiler, Intel Core i5 8th Gen CPU, 8G memory and 64-bit operating system were used.
Experimental data: data sets of two-dimensional data and Wine quality-red standard data sets in UCI were selected in the experiment. Data source:
http://archive.ics.uci.edu/ml/.
4.1. Simulation Result
In this paper, the algorithm time and the mean value of error sum square are used as the evaluation criteria of clustering effect.
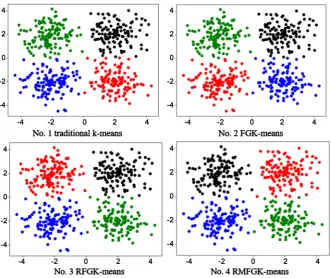
Clustering experiments were carried out on traditional K-means algorithm, Fast Global K-means algorithm (FGK-means), fast global K-means algorithm based on neighborhood screening (RFGK-means), and fast global K-means algo-rithm based on neighborhood screening and Markov distance (RMFGK-means), respectively. Set the number of clustering centers to 4, and the clustering effect is shown in Figure 2.
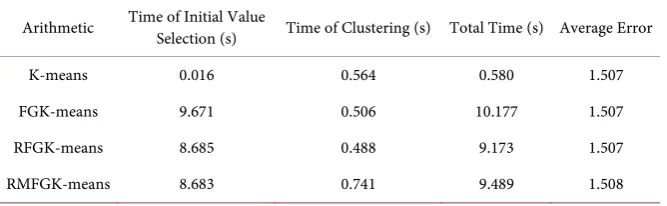
[image:7.595.209.541.433.711.2]After 10 times of clustering simulation, the average value is obtained. The time and average error of each algorithm are shown in Table 1 (kept three de-cimal places).
DOI: 10.4236/jcc.2019.710005 59 Journal of Computer and Communications There are 1600 pieces of data in Wine quality-red, and each piece of data has 12 characteristics, among which the data under the quality attribute can be used as sample labels. After removing the title and the last quality feature, 1599 pieces of data are used, and 11 feature data of each piece of data are normalized for clustering. The number of cluster centers was set to 6, and the average value was obtained after 10 cluster simulations. The clustering results were shown in Table 2 (kept three decimal places).
In this paper, the ratio of the number of correctly classified samples to the to-tal number of samples was defined as the correct classification rate, which was used to test the clustering effect of RFGK-means and RMFGK-means.
According to the 6 qualities of Wine quality-red, the original samples are clas-sified into classes D1 to D6, and the clustering results are clasclas-sified into classes DA1 to DA6 respectively. Each data sample in DA1 is fitted with samples from D1 to D6 respectively, and the number of the same samples is recorded. The fit-ting results of RFGK-means are shown in Table 3. Finally, the sample quality classification set with the largest number of samples and no duplication with other category sets as the similar set of clustering results, and statistics the num-ber of identical samples in similar sets. Similar set results of RFGK-means are shown in Table 4.
The fitting results and similar set results after RMFGK-means clustering are shown in Table 5 and Table 6 respectively.
By analyzing the above results, the clustering effects of RFGK-means and RMFGK-means are shown in Table 7 (kept three decimal places).
According to the above data, the correct classification rate of samples obtained by RMFGK-means clustering is higher than that obtained by RFGK-means clus-tering.
Table 1. Clustering results of two-dimensional simulation data set.
Arithmetic Time of Initial Value Selection (s) Time of Clustering (s) Total Time (s) Average Error
K-means 0.016 0.564 0.580 1.507
FGK-means 9.671 0.506 10.177 1.507
RFGK-means 8.685 0.488 9.173 1.507
[image:8.595.208.542.497.600.2]RMFGK-means 8.683 0.741 9.489 1.508
Table 2. Clustering results.
Arithmetic Time of Initial Value Selection (s) Clustering (s) Time of Total Time (s) Average Error
K-means 0.238 7.625 7.862 0.107
FGK-means 184.426 6.158 190.585 0.104
RFGK-means 112.670 5.514 118.184 0.100
DOI: 10.4236/jcc.2019.710005 60 Journal of Computer and Communications
Table 3. Results of RFGK-means fitting.
RFGK-means D1 D2 D3 D4 D5 D6
DA1 2 6 140 178 67 6
DA2 1 5 272 143 13 0
DA3 7 28 389 231 29 0
DA4 0 10 42 166 31 4
DA5 0 3 22 133 123 10
DA6 0 1 40 17 8 0
Table 4. Results of RFGK-means similar set.
Classification of clustering results DA1 DA2 DA3 DA4 DA5 DA6
Classification of sample quality D4 D1 D3 D2 D5 D6
[image:9.595.208.541.323.443.2]Same sample size 178 1 389 10 123 0
Table 5. Fitting results of RMFGK-means.
RMFGK-means D1 D2 D3 D4 D5 D6
DA1 0 6 211 64 7 1
DA2 1 3 137 210 59 6
DA3 1 1 18 10 1 0
DA4 6 36 389 295 42 1
DA5 2 6 135 271 159 12
DA6 0 1 15 18 3 0
Table 6. RMFGK-means similar set results.
Classification of clustering results DA1 DA2 DA3 DA4 DA5 DA6
Classification of sample quality D2 D5 D1 D3 D4 D6
Same sample size 6 59 1 389 271 0
Table 7. Comparison of clustering effect.
Arithmetic Number of correctly classified samples Correct classification rate
RFGK-means 701 0.438
RMFGK-means 726 0.454
4.2. Experimental Analysis
[image:9.595.205.537.556.603.2]DOI: 10.4236/jcc.2019.710005 61 Journal of Computer and Communications in the selection of initial clustering center. Mahalanobis distance is used to take into account the global distribution of data, instead of Euclidean distance, which can improve the accuracy of clustering results in real data sets.
5. Conclusion
The fast global K-means algorithm based on neighborhood screening can effec-tively shorten the time used for initial value search, enhance the robustness of the algorithm, and its clustering effect is basically consistent with the fast global K-means algorithm. The use of Mahalanobis distance instead of Euclidean dis-tance in the clustering process can fully consider the integrity of data, effectively improve the anti-noise ability of the algorithm and improve the clustering accu-racy. However, due to a large amount of calculation of Mahalanobis distance, the clustering time is increased to some extent, which makes the total time of the algorithm increase. RMFGK-means algorithm can exert greater advantages when clustering highly correlated data.
Conflicts of Interest
The authors declare no conflicts of interest regarding the publication of this pa-per.
References
[1] Cui, Y.H., Shang, C., Chen, S.Q. and Hao, J.Y. (2019) Overview of AI: Develop-ments of AI Techniques. Radio Communications Technology, 45, 225-231.
[2] Gbadoubissa, J.E.Z., Ari, A.A.A. and Gueroui, A.M. (2018) Efficient K-Means Based Clustering Scheme for Mobile Networks Cell Sites Management. Journal of King Saud University—Computer and Information Sciences.
https://doi.org/10.1016/j.jksuci.2018.10.015
[3] Han, X. (2017) Research of the Micro Pipeline Robot Based on Machine Vision. Master Thesis, Tianjin University of Technology, Tianjin.
[4] Cong, S.A. and Wang, X.X. (2018) Research Review on K-Means Algorithm. Elec-tronic Technology & Software Engineering, No. 17, 155-156.
[5] Jia, R.Y. and Li, Y.G. (2018) K-Means Algorithm of Clustering Number and Centers Self-Determination. Computer Engineering and Applications, 54, 152-158.
[6] Liu, Y., Wu, S., Zhou, H.-H., Wu, X.-J. and Han, L.-Y. (2019) Research on Optimi-zation Method Based on K-Means Clustering Algorithm. Information Technology, 43, 66-70.
[7] Jiang, H., Ji, F., Wang, H.-J., Wang, X., Luo, Y.-D., Jiang, H., Ji, F., Wang, H.-J., Wang, X. and Luo, Y.-D. (2018) Improved Kmeans Algorithm for Ocean Data Anomaly Detection. Computer Engineering and Design, 39, 3132-3136.
[8] Wang, H. and Qin, L.B. (2012) Method of Image Segmentation Based on Fast Glob-al K-Means Algorithm and Region Merging. Computer Engineering and Applica-tions, 48, 187-190+223.
[9] Tao, Y., Yang, F., Liu, Y. and Dai, B. (2018) Research and Optimization of K-Means Clustering Algorithm. Computer Technology and Development, 28, 90-92.
DOI: 10.4236/jcc.2019.710005 62 Journal of Computer and Communications Clustering Algorithm Based on Mahalanobis Distance. Journal of Jiangxi Normal University (Natural Science), 36, 284-287.
[11] Liu, Y.H. (2018) Design and Implementation of an Improved K-Means Clustering Algorithm for Natural Image Segmentation. Journal of Huainan Normal University, 20, 120-125.
[12] Wang, Y., Qi, X.H. and Duan, Y.X. (2019) Image Segmentation of FCM Algorithm Based on Kernel Function and Markov Distance. Application Research of Comput-ers, 1-5.
[13] Hoffelder, T. (2019) Equivalence Analyses of Dissolution Profiles with the Mahala-nobis Distance. Biometrical Journal, 61, 779-782.
https://doi.org/10.1002/bimj.201700257
[14] Liu, C. and Xie, D.-Y. (2015) An Improved Fast Global K-Means Clustering Seg-mentation Algorithm. Journal of Qinghai Normal University (Natural Science Edi-tion), 31, 1-5.
[15] Lai, J.Z.C. and Huang, T.-J. (2010) Fast Global K-Means Clustering Using Cluster Membership and Inequality. Pattern Recognition, 43, 1954-1963.