ACS Photonics is published by the American Chemical Society. 1155 Sixteenth Street
using anti-reflection coated microparticles.
Derek Craig, Alison McDonald, Michael Mazilu, Helen Rendall, Frank Gunn-Moore, and Kishan Dholakia
ACS Photonics, Just Accepted Manuscript • DOI: 10.1021/acsphotonics.5b00178 • Publication Date (Web): 11 Sep 2015
Downloaded from http://pubs.acs.org on September 18, 2015
Just Accepted
Enhanced optical manipulation of cells using
anti-reflection coated microparticles
Derek Craig,
†,‡Alison McDonald,
†,‡Michael Mazilu,
†Helen Rendall,
†Frank
Gunn-Moore,
†,¶and Kishan Dholakia
∗,†SUPA, University of St. Andrews, Department of Physics and Astronomy, St. Andrews,
Fife, United Kingdom, KY16 9SS.
E-mail: [email protected]
Abstract
We demonstrate the use of anti-reflection (AR) coated microparticles for the
en-hanced optical manipulation of cells. Specifically, we incubate CHO-K1, HL60 and
NMuMG cell lines with AR coated titania microparticles and subsequently performed
drag force measurements using optical trapping. Direct comparisons were performed
between native, polystyrene microparticle and AR microparticle tagged cells. The
optical trapping efficiency was recorded by measuring the Q value in a drag force
ex-periment. CHO-K1 cells incubated with AR microparticles show an increase in the
Q value of nearly 220% versus native cells. With the inclusion of AR microparticles,
cell velocities exceeding 50µm/s were recorded for only 33mW of laser trapping power.
Cell viability was confirmed with fluorescent dyes and cells expressing a fluorescent
ubiquitination-based cell cycle protein (FUCCI) which verified no disruption to the
cell cycle in the presence of AR microparticles.
∗To whom correspondence should be addressed †University of St. Andrews
‡Contributed equally to this work
¶University of St. Andrews, School of Biology, St. Andrews, Fife, United Kingdom, KY16 9SS.
Keywords
Optical Trapping, Dielectric Tagging, Anti-Reflection, Microparticles, Biophotonics, Cell
Viability
From the first demonstration of optical manipulation of microparticles, the field has
pro-liferated into various areas of the natural sciences.1–3 A single beam trap in the form of
optical tweezers, has enabled advancement in the study of single molecule biophysics and
cell micro-rheology.4,5 In molecular studies, an optically trapped bead may be functionalised
to attach to a specific molecule, whereas in cell studies, direct manipulation with the
opti-cal field is usually employed. Using this approach several methods may be used to measure
forces with an optical trap. However, each has its limitations and requires an accurate
knowl-edge of the sample parameters.6,7 In particular force measurements can be challenging when
working with non spherical particles or in environments with an inhomogeneous viscosity,
such as inside the cell. Recent developments in the field are moving towards obtaining direct
force measurements by detecting light momentum changes.8 For this approach, the
calibra-tion factor only comes from the deteccalibra-tion instrumentacalibra-tion, and negates the requirement to
recalibrate for changes in experimental conditions. Additionally, measurements are also no
longer restricted by the linear regime.
In optical trapping, the forces generated are typically in the pN range and efforts to
maximise this have largely focused on shaping the light field to minimise aberrations.9 10,11
As an alternative, recent studies have focused on enhancing the physical properties of the
microparticle or trapped object itself. High refractive index microparticles hold promise
for enhanced trapping due to the increased refractive index mismatch with the surrounding
media. However, the resultant enhanced scattering force makes it difficult to trap these
microparticles in three dimensions.12,13
Indeed, as a consequence of the modest dielectric contrast, that is the minimal refractive
index mismatch between a cell and its surrounding media, the optical forces for direct
bio-logical (e.g. cell) manipulation are weak.14Furthermore, photo-damage of biological samples
can occur due to prolonged exposure to a tightly focused laser spot.15 To overcome these
limitations, an optical handle, such as a silica or polystyrene microparticle, can be integrated
within a cell by a process known as endocytosis or attached via the plasma membrane using a
linker molecule.16,17 Optically manipulating cells using this method is of importance for cell
sorting applications.4 Sorting of sub populations of cells can be achieved by selectively
tag-ging the cells of interest with a chosen microparticle. Naturally for all optical manipulation
of cells maintaining a low incident laser power is essential to ensure cell viability.
Based upon these considerations, we have explored the use of anti-reflection coated
mi-croparticles to enhance the velocity at which we can successfully transport cells, without
resorting to an increase in the laser power. This could be used to develop a high throughput
cell sorting system. Optically, an anti-reflection coating is a powerful approach to reduce
deleterious reflections from a surface.18 Recent studies have shown high refractive index
anatase microparticles can be coated with an amorphous titania surrounding and drag force
studies on such microparticles indicated forces in viscous media in excess of a
nanoNew-ton.18,19
However, no study has been reported using AR microparticles in biological systems
to verify their biological compatibility. Here, we address both of these issues and demonstrate
the use of anti-reflection coated microparticles for cell trapping and manipulation.
Specifically, we incubated CHO-K1, NMuMG and HL60 cells with various concentrations
of both AR coated and polystyrene microparticles, which are internalised within these cells.
The Q values measured by drag force studies indicate that AR microparticle containing cells
provided a significant increase over native CHO-KI (220%) and HL60 (140%) cells, as well
as an increase in comparison to polystyrene microparticle containing CHO-KI(150%) and
HL60 (115%) cells. Cell viability studies showed that cells remained healthy and were not
compromised by the internalisation of microparticles.
Results and Discussion
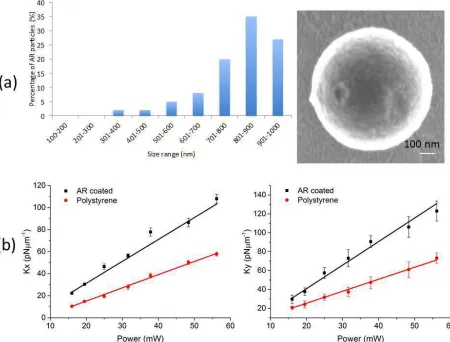
As a precursor to the particle internalisation studies, we characterised the lateral trap
stiff-ness of the AR microparticles in comparison to polystyrene microparticles of a comparable
size (800 nm). The trap was found to be asymmetric due to laser beam ellipticity leading to
a slight difference in the x and y trap stiffness values recorded (Figure 1). The trap stiffness
for the AR coated microparticles was found to be 2.07 ± 0.06 pN nm-1W-1 and 2.32 ± 0.15
pN nm-1W-1 in the x and y directions respectively. Whereas for polystyrene microparticles,
we measured a lateral trap stiffness of 1.21± 0.03pN nm-1W-1 and 1.30±0.04 pN nm-1W-1.
The AR microparticles outperformed polystyrene microparticles by approximately 100%,
which is comparable to results previously reported.18 We note that batches of AR coated
microparticles exhibited a polydispersity in diameter of 20%. Whereas, the polydsipersity
reported previously was only 5%.19
This increase in polydispersity can be attributed to
dif-ferences in experimental conditions from those used in previous studies which are outwith
our control. As only a narrow size regime of particles have been found to be optimised to
trap at 1064 nm then the increase in polydispersity obtained is not a significant development.
Previous studies on AR particles by Jannasch and Schaffer demonstrated that trapping
ca-pabilities of these particles were directly linked to the ratio between particle core size and
shell thickness, with particles surrounded by thinner or thicker shells than the optimal ratio
proving difficult to trap. Further to this problems were also encountered when attempting
to trap smaller particles due to spherical aberrations at the glass-water interface.18
In our study, we were not able to measure the exact particle dimensions during trapping
experiments. Therefore, the average AR coated microparticle size was used in all calculations.
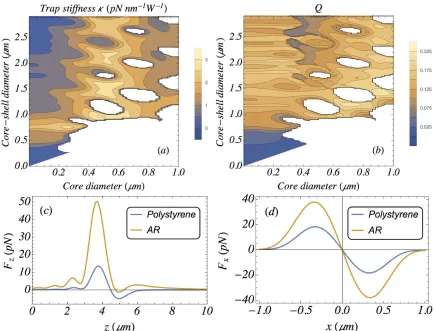
The simulations (Figure 2) were performed using Mie scattering theory and taking into
account spherical aberrations (matlab source code20). We observe, that considering the
core-shell size of our particles, there is a two to three fold improvement in trap stiffness and
Q value. Our results further indicate performing optical sorting of the microparticles prior
to internalisation experiments would be beneficial for future studies.21In addition measuring
the force using the state of the art full force measurements would also be advisable given
the polydispersity of the sample.22
Figure 1: (a) AR microparticles with diameters sized using SEM imaging. (b) Lateral trap stiffness for both AR coated and polystyrene microparticles as a function of trapping power for the x and y directions. Trap stiffness was determined from the corner frequency averaged over 5 power spectra at each power. Measurements were taken for a trapped microparticle held 5µm above the cover slip. Data is averaged over five 800nm polystyrene microparticles and ten AR coated microparticles.
The Q value measurements were taken for both native AR microparticles and for polystyrene
microparticles. Additionally Q values were determined for native CHO-K1, HL60 and
NMuMG cells and finally for cells containing internalised microparticles (see supplementary
information containing figure S1 and Q value protocol). Average Q values were obtained
using the drag force method and the resulting Q values are presented in Table 1.
The Q values show a significant increase in trapping efficiency of approximately 45% for
[image:6.612.82.532.125.467.2]Figure 2: Numerical simulations showing enhanced trapping of AR coated microparticles (nominally trapped 5µm above glass slide). (a,b) Trap stiffness and Q factor enhancement as a function of the core and core-shell diameter. (c) Axial force comparison (33mW laser power) between the AR (450nm core and 900nm core-shell) particle and a 800nm polystyrene bead. (d) Same for the lateral force showing for the polystyrene bead κ = 1.25 pN nm−1
W−1 with Q= 0.058 and for the AR particle κ= 2.55 pN nm−1 W−1 with Q= 0.12. 3
Table 1: Relative Q value measurements taken using a 1070 nm laser based single beam optical trap. A 100x magnification Oil Objective (NA=1.4) was used for all measurements. The Q value of ten individual cells at 5 different laser powers (which were 13 mW, 17 mW, 22 mW, 28 mW and 33 mW) was measured. The average Q value from these results is shown in the table. The velocity ranges and force ranges detailed are measurements calculated at the lowest and highest powers used in this experiment of 13 mW and 33 mW respectively. The variance in Q value is the standard deviation of 10 replicate measurements.
Sample Q Value /x10-2 Velocity(µm/s) Force Range (pN) Polystyrene 2.9 ± 0.7 346 - 536 2.3 - 3.6
AR 4.2 ± 0.5 345 - 846 5.9 - 11.4
CHO-K1 1.1 ± 0.2 4.3 - 17.3 0.5 - 1.9 CHO-K1 Polystyrene 1.4 ± 0.3 8.7 - 31.4 0.9 - 3.2 CHO-K1 AR 3.5 ± 0.4 16.6 - 56.1 1.7 - 5.7 HL60 1.7 ± 0.5 9.4 - 34.5 1.1 - 3.8 HL60 Polystyrene 1.9 ± 0.3 10.2 - 40.2 0.9 - 3.6 HL60 AR 4.1 ± 0.3 19.6 - 57.2 1.8 - 5.1
NMuMG 1.4 ± 0.3 5 - 14.7 0.6 - 1.7
NMuMG Polystyrene 1.8 ± 0.3 7 - 22.5 0.8 - 2.7 NMuMG AR 4.2 ± 0.4 6 - 31.3 2.0 - 3.6
AR microparticles in comparison to polystyrene microparticles. As expected the Q values
obtained for the (trypsinised) normally adherent CHO-K1 and NMuMG cells as well as the
non-adherent HL60 cells, were considerably lower than those obtained for the either of the
native particle solutions. This can be attributed to the weak dielectric contrast between
the cells and the surrounding media. Interestingly, when drag force studies were performed
on each of the cell lines following the internalisation of polystyrene microparticles only a
small increase in the Q value of 10-20% was obtained. In contrast, internalisation of AR
microparticles increased the Q values by 220% and 140% with respect to the native cell
lines. Comparison of the Q value obtained for the native AR particles in comparison to the
internalised AR values shows that within statistical error there does not appear to be a loss of
enhancement in trapping efficiency. We believe that a high trapping efficiency is maintained
when these particles are internalised within each cell line due to the high refractive index
of these particles significantly increasing the refractive index mismatch between the cells
and their surrounding media. The particle tagged cell complexes shall experience a stronger
gradient force due to their increased refractive index in comparison to the unlabelled cells.
It is also possible to guide the particle tagged cells more rapidly than native cells due to
the spheres experiencing stronger radiation pressure arising from increased scattering in the
opposing direction to the propagating beam. The refractive index of the AR particles used
was assumed to be between 1.7-1.8 which takes into account possible variations in particle
shell thickness. The enhancement increase for AR particles over polystyrene particles of a
similar size can also be accounted for in terms of differences in refractive index with the
polystyrene particles used for comparison in this study having a refractive index of 1.5. It is
worth noting that we have assumed that the cells are spherical and we have not taken into
account deformations of the cell due to the hydrodynamic drag.23 The comparative increase
in Q value between the AR particle incubated adherent CHO-K1 and MNuMG cells and the
suspension HL60 cells can be attributed to the differences in the physical properties of both
cell lines. When the particles are incubated with adherent cells they will interact with the
cells for a longer period of time as the particles will fall onto the surface upon which the cells
are adhered to, whereas for the non-adherent cells which are suspended freely in solution
there will be a shorter interaction time with the particles.As such the Q value measurements
for the NMuMG cells follow the same trend as the CHO-K1 cells.
To further optimise the trapping efficiency an incubation study was performed to
deter-mine the maximum Q value possible to be obtained in comparison to the number of particles
present in each cell. The particle numbers present in each cell were altered through changing
the concentration of the particle solution added to the cells during the incubation process.
The number of particles present in each cell was elucidated using bright field microscopy
prior to Q value measurements. The corresponding data for this study is shown in Figure
S1. It was deemed possible to limit the number of particles internalised within the cells to
<10 through addition of a low concentration of particles during the incubation process. The
resulting Q values showed a significant enhancement in favour of the AR containing cells
over the polystyrene containing cells. However, as the concentration of the particle solutions
was increased it became increasingly difficult to control the number of particles entering
each cell. Therefore, it was not possible to control the addition of the particles to the cells
within a region of 10 - 20 particles. When>20 particles were present within each cell the Q
value enhancement previously gained for the AR particle containing cells was significantly
reduced. This was attributed to the formation of large aggregate clusters of particles within
the cell cytoplasm which we hypothesise could affect the net mass of the cells and retard
their movement through solution and therefore, decrease their trapping efficiency. The
lo-calisation of the particles within the cells imaged appeared to be mostly in the cytoplasmic
region, although there were instances where the particles appeared to be on the membrane
layer. In future studies, further functionalisation of the particles with organelle targeting
ligands could be a potential route to fully elucidate particle location following incubation.
Table 1, also shows the velocity and force ranges able to be exerted on the cell lines and
particles. As expected the Q values obtained for the native cell lines are significantly less
than those for cells internalised with AR particles. This is reflected in the velocity and force
measurements when at the highest power of 33 mW, it was observed that the maximum
velocities of 17.5µm/s and 34.5 µm/s for the native CHO-KI and HL60 cells were obtained
respectively, with maximum forces exerted at this power on the native cells being 1.9 and 3.8
pN respectively. In contrast, cells that had internalised <10 AR microparticles, displayed a
maximum velocity of 56 and 57µm/s for the CHO-K1 and HL60 cell lines respectively. It was
possible to exert maximum forces of 5.7 and 5.1 pN respectively. As would be expected the
forces measured for each sample increased linearly in correlation with the increasing power
level. The power levels used in this study were relatively modest, and reflect the power that
you would wish to use to avoid compromising cell viability post optical handling. We did
not perform measurements with the maximum optical power available from our system as
this would compromise cell viability.
We used two fluorescence viability assays to study the biocompatibility of the
micropar-ticles over a 24 hour incubation period. For the CHO-K1 and HL60 cell lines we tested
cell viability using the fluorescent stains calcein AM and propidium iodide.24 With respect
to calcein AM, live cells exhibit uniform fluorescence staining of the cytoplasm after
ace-toxymethyl ester hydrolysis by intra-cellular esterases.24 Non viable cells were identified by
punctate calcein AM staining or by fluorescence of propidium iodide within the nuclear
region. We found >90% cell viability between the untreated cells and those treated with
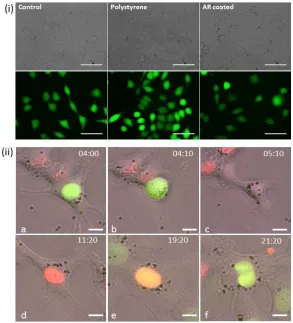
AR coated or polystyrene microparticles for both cell lines. Representative images of viable
CH0-K1 cells are shown in (Figure 3). To further study the effect of particle internalisation
on the development of the cells in culture, we performed timelapse imaging on NMuMG cells
which express the FUCCI fluorescent assay system. A series of images from a time-lapse
study with AR coated microparticles showing the life cycle of one cell and its daughter cell,
are shown in Figure 3. We found no significant variation between the life cycle of
con-trol cells and cells containing microparticles. Additionally, microparticles were shown to be
transported around the cytoplasm of the cell and were successfully distributed between the
daughter cells. It should be noted that the cell viability studies described were performed in
order to determine that the cells remained viable pre and post incubation with the AR and
polystyrene particles and not pre and post optical trapping.
Parameters such as laser power and exposure time have to be carefully considered to
ensure that cell viability is not compromised after trapping experiments. Furthermore,
stud-ies have investigated the further growth of CHO-K1 cells post-optical trapping with one
study reporting that trapping with a 1064nm laser source significantly reduced the cloning
efficiency of CHO-K1 cells to <40% after 5 minutes exposure with >80mW power.26 Our
approach of enhancing the dielectric contrast between the cells and the surrounding media
allows for manipulation of cells using a significantly lower power. Using AR coated
micropar-ticles provides the means to reduce this further. Combined with the proven biocompatibility
of these microparticles, our study shows great promise of enhanced optical handling without
compromising the viability of the cells.
Figure 3: (i) Representative brightfield (top row) and epi-fluorescence images (bottom row) of CHO-K1 cells labelled with calcein AM. Cells imaged after a 24-hour incubation with polystyrene or AR coated microparticles are compared with a non treated control population. 50µm scale bar.(ii) Snapshots of FUCCI expressing cells showing successful internalisation of AR microparticles. Overlay of GFP, RFP and brightfield images taken over 24 hours (images are time stamped). (a) Cell at the G2 phase, (b) M phase, (c-d) undergoing cell division G1 phase, (e) G1/S phase and (f) S phase. These images demonstrate that the cell progressed through each cell cycle check point.25 10µm scale bar
.
[image:12.612.153.446.166.489.2]Conclusion
We have demonstrated the first application of anti-reflection coated particles for enhanced
cell manipulation. Our study details the first direct comparison between polystyrene particles
and anti-reflection coated particles for the indirect optical manipulation of cells via optical
tagging. Significant increases in trapping efficiency were obtained when AR tagged cells were
compared to both polystyrene tagged and native cell lines. We have also proven that cell
viability is not compromised during the internalisation of these AR microparticles. Future
applications of this technique could include further particle functionalisation to target specific
cell sub populations for subsequent cell sorting or for enhanced force measurements inside
living cells. The ability to use lower laser powers to optically manipulate cells containing
anti-reflection coated particles should allow for faster optical manipulation during cell sorting
experiments without inducing irreversible cell damage. The use of these particles could also
be used for other indirect optical manipulation studies such as single molecular studies of
DNA and RNA, the manipulation and stretching of cells such as red blood cells and further
studies of molecular interactions. In the studies listed previously there has been a persistent
need to use an increasing number of optical handles in order to exert increased forces on
these objects, whereas, with the advent of these AR particles it could be possible to exert
these forces not only on a smaller number of particles but at significantly less laser power
than previously required.
Methods
AR microparticle synthesis and characterisation
Synthesis of AR microparticles was successfully achieved using a combination of two
meth-ods.18,19
Briefly, 0.23g of titanium butoxide is mixed with anhydrous ethylene glycol then
added to a 100 mL of acetone containing 0.24g of Tween-20. Following sedimentation
overnight and purification by centrifugation, the obtained seeds were calcined at 500◦C for 2
hours. The resulting anatase seeds were re-suspended in 10 mL of ethanol prior to adding a
further 10 mL of ethanol containing 0.14g of titanium butoxide. The combined solution was
sonicated for 2 hours, prior to purification by centrifugation. The microparticles were then
dried at 50◦C for 2 hours.We used SEM imaging to measure the diameter of the particles
before and after coating to find the mean core diameter as well as the final diameter post
coating.
Cell culture and particle incubation
We cultured three cell lines, two adherent and one non-adherent, for particle incubation and
trapping experiments. All cell lines were cultured in a 37◦C, 5% CO
2 humidified incubator.
The adherent chinese hamster ovary (CHO-K1) and mouse mammary gland (NMuMG) cell
lines were grown in Minimum eagles medium (SIGMA) supplemented with 10% (v/v) Fetal
bovine serum, 2mM L-glutamine and 1% penicillin-streptomycin and 0.5 mg/mL geneticin.
Cells were plated onto plastic bottom petri dishes for particle incubation experiments and
allowed to grow for 24 hours before adding each particle set. Following the addition of
both AR and polystyrene microparticles to the cells, they were incubated for a further 24
hours prior to trypsinisation and re-suspension in fresh pre-warmed media. Non adherent
human promyelocytic leukemia cells (HL60) were grown in RPMI-1640 media (SIGMA),
supplemented as above. As this was a suspension culture we did not have to plate out cells
24 hours before adding particles.The microparticle incubation procedure was the same as
described for the adherent cell lines.
Cell viability assays
We performed two cell viability assays following the 24 hour microparticle incubation. The
first assay used calcein AM and propidium iodide fluorescent labelling. We used this method
to test the viability for the CHO-K1 and HL60 cell lines. The cells where incubated with
3µM propidium iodide and 2µM calcein AM solutions in 1x phosphate buffered saline. We
visualised the cells using epi-fluorescence imaging with FITC and TRITC filter cubes. The
number of live and dead cells were counted over a population of 500 cells per dish, and the
experiments were conducted in triplicate. The NMuMG cell line used in these experiments
had been previously transfected with the FUCCI constructs and cryo-preserved.25 Using
time-lapse epi-fluorescence microscopy, we were able to image the stage in the life cycle
for each cell and could track the progression on a single cell basis. We studied the cell
development with and without microparticles present.We conducted these experiments in
triplicate and due to the limited field of view we were only able to track the development
of on average 10 cells per dish. Cells were maintained in a microscope stage top incubator,
37◦C, 5% CO
2, for the 24 hours imaging period. Fluorescence and brightfield images were
taken at 5 minute intervals.
Preparation of cells for trapping experiments
All cells to be analysed in drag force measurements were placed onto BSA (3% w/v) coated
glass dishes (Fluorodish, World Precision Instruments). The size of the cell was measured
from the brightfield image and noted prior to trapping. The measured cell diameters were
in the range of 11.8-17.3µm for CHO-K1, 12.1-15.0µm for NMuMG and 12.8-17.4µm for the
HL60 cells. The number of internalised microparticles was counted in each trapped cell using
bright-field microscopy. Cells were then broadly categorised into three cohorts (<10, 10-20
and >20 internalised microparticles).
Optical trapping system
The optical trap was built around a commercial inverted microscope (Nikon, Eclipse Ti)
and used a continuous-wave Ytterbium fibre laser emitting at 1070 nm (10W maximum
power). The laser was operated at a fixed current well above threshold. The power available
for the optical trap was controlled using a combination of a half wave plate and polarising
beam splitter (PBS) cube. The laser beam was expanded to overfill the back aperture of
the objective lens, resulting in a diffraction limited focal spot. We used a 60x/1.4 N.A
oil immersion objective lens with a measured optical transmission of 39% for trap stiffness
measurements and a 100x/1.4N.A oil objective for Q value measurements (transmission of
30%). The optical power at the trapping plane was accurately determined from the measured
power at the back aperture and the transmission of the objective lens.
Trap stiffness measurements were performed using back focal plane (BFP)
interferom-etry in transmission mode by imaging the BFP of a detection objective onto a quadrant
photodiode (QPD). This allowed tracking in the time domain of the position of the trapped
microparticle. Data was acquired at 50kHz sampling frequency over 10s, and saved
us-ing custom LabVIEW software (Elliot Scientific). The data was analysed usus-ing the power
spectrum method to obtain the corner frequency using freely available MATLAB code.27
Measurements were taken at varying power to measure the linear power dependence on the
lateral trap stiffness for both AR coated and polystyrene microparticles. We estimated the
linear region of the trap to be 170nm. The height of the trap above the cover slip was
measured relative to a fixed point on the coverslip surface. For drag force measurements, we
used a motorised stage (M¨arzh¨auser Wetzlar) to control the translation speed of the sample
relative to the stationary beam.
Optical trapping model
We have modelled the optical forces acting on coated and uncoated microparticle using a
Mie scattering approach. The Mie coefficients were calculated using the MATLAB MatScat
package28 and spherical aberration was implemented using angular spectral decomposition
approach.29 The optical force calculation only took into account the optical eigenmodes of
the system30,31
and were performed using the MATLAB EigenOptics package.20
Q Value measurement protocol
The trap efficiency was determined by the established by drag force approach to determine
the Q value for each cell/microparticle in question.32 Solutions of each set of particle were
freshly prepared prior to each set experiments by re-suspending the microparticles in a
solution of MilliQ water at a concentration of 1 mg/mL. Dilutions were then made from
each stock solution accordingly. Solutions of AR and polystyrene microparticles at 25% and
37.5% of the original stock concentration respectively, were incubated with each cell line for
24 hours.
Acknowledgement
We thank the UK Engineering and Physical Sciences Research Council under grants EP/J01771X/1
and EP/M000869/1, the University of St Andrews, the BRAINS 600th anniversary appeal
and Dr. Killick for funding. We thank Professor David Cole-Hamilton for advice on AR
particle synthesis.
Supporting Information Available
Raw data and simulation data are available online.33 The numerical model is available
on-line.20
Supplementary figure, Figure S1 is included in the supplementary information.
This material is available free of charge via the Internet at http://pubs.acs.org/.
Notes and References
(1) Ashkin, A. Acceleration and Trapping of Particles by Radiation Pressure. Phys. Rev.
Lett. 1970, 24, 156–159.
(2) Perkins, T. T. Angstrom-Precision Optical Traps and Applications. Annu. Rev.
Bio-phys. 2014, 43, 279–302.
(3) Dholakia, K.; Cizmar, T. Shaping the future of manipulation.Nat. Photonics 2011,5,
335–342.
(4) Mthunzi, P.; Lee, W. M.; Riches, A. C.; Brown, C. T. A.; Gunn-Moore, F. J.;
Dho-lakia, K. Intracellular Dielectric Tagging for Improved Optical Manipulation of
Mam-malian Cells.IEEE J. Sel. Top. Quantum Electron. 2010, 16, 608–618.
(5) Block, S. M.; Goldstein, L. S. B.; Schnapp, B. J. Bead movement by single kinesin
molecules studied with optical tweezers.Nature 1990, 348, 348–352.
(6) Neuman, K. C.; Block, S. M. Optical trapping. Rev. Sci. Instrum. 2004, 75.
(7) Perkins, T. T. Optical traps for single molecule biophysics: a primer. Laser Photonics
Rev. 2009,3.
(8) Farre, A.; Montes-Usategui, M. A force detection technique for single-beam optical
traps based on direct measurement of light momentum changes. Opt. Express 2010,
18.
(9) Neuman, K. C.; Nagy, A. Single-molecule force spectroscopy: optical tweezers, magnetic
tweezers and atomic force microscopy. Nat. Methods 2008, 5, 491–505.
(10) Wulff, K. D.; Cole, D. G.; Clark, R. L.; DiLeonardo, R.; Leach, J.; Cooper, J.;
Gib-son, G.; Padgett, M. J. Aberration correction in holographic optical tweezers. Opt.
Express 2006,14, 4170–4175.
(11) Cizmar, T.; Mazilu, M.; Dholakia, K. In situ wavefront correction and its application
to micromanipulation. Nat. Photonics 2010, 4, 388–394.
(12) Hu, Y.; Nieminen, T. A.; Heckenberg, N. R.; Rubinsztein-Dunlop, H. Antireflection
coating for improved optical trapping.J. Appl. Phys. 2008,103, 093119.
(13) van der Horst, A.; van Oostrum, P. D. J.; Moroz, A.; van Blaaderen, A.; Dogterom, M.
High trapping forces for high-refractive index particles trapped in dynamic arrays of
counterpropagating optical tweezers.Appl. Opt. 2008, 47, 3196–3202.
(14) Wang, M. M.; Tu, E.; Raymond, D. E.; Yang, J. M.; Zhang, H. C.; Hagen, N.; Dees, B.;
Mercer, E. M.; Forster, A. H.; Kariv, I.; Marchand, P. J.; Butler, W. F. Microfluidic
sorting of mammalian cells by optical force switching.Nat. Biotechnol.2005,23, 83–87.
(15) Neuman, K. C.; Chadd, E. H.; Liou, G. F.; Bergman, K.; Block, S. M. Characterization
of photodamage to Escherichia coli in optical traps. Biophys. J. 1999, 77, 2856–2863.
(16) Ozkan, M.; Wang, M.; Ozkan, C.; Flynn, R.; Birkbeck, A.; Esener, S. Optical
ma-nipulation of objects and biological cells in microfluidic devices. Biomed. Microdevices
2003, 5, 61–67.
(17) Rabinovitch, M. Professional and nonprofessional phagocytes - an introduction.Trends
Cell Biol. 1995,5, 85–87.
(18) Jannasch, A.; Demirors, A. F.; van Oostrum, P. D. J.; van Blaaderen, A.; Schaffer, E.
Nanonewton optical force trap employing anti-reflection coated, high-refractive-index
titania microspheres. Nat. Photonics 2012, 6, 469–473.
(19) Demir¨ors, A. F.; Jannasch, A.; van Oostrum, P. D. J.; Sch¨affer, E.; Imhof, A.; van
Blaaderen, A. Seeded Growth of Titania Colloids with Refractive Index Tunability and
Fluorophore Free Luminescence. Langmuir 2011,27, 1626–1634.
(20) Mazilu, M. EigenOptics [Online]; University of St. Andrews, St. Andrews, UK, 2015.
DOI:10.17630/f039c29b-12fe-4b4b-9b0b-907c72634ad8 (accessed July 2, 2015).
(21) MacDonald, M.; Spalding, G.; Dholakia, K. Microfluidic sorting in an optical lattice.
Nature 2003, 426, 421–424.
(22) Farre, A.; Marsa, F.; Montes-Usategui, M. Optimized back-focal-plane interferometry
directly measures forces of optically trapped particles. Opt. Express 2012,20.
(23) Foo, J. J.; Liu, K. K.; Chan, V. Viscous drag of deformed vesicles in optical trap:
Experiments and simulations. Aiche J.2004, 50.
(24) Antkowiak, M.; Torres-Mapa, M. L.; Gunn-Moore, F.; Dholakia, K. Application of
dynamic diffractive optics for enhanced femtosecond laser based cell transfection. J.
Biophotonics 2010,3, 696–705.
(25) Sakaue-Sawano, A.; Kurokawa, H.; Morimura, T.; Hanyu, A.; Hama, H.; Osawa, H.;
Kashiwagi, S.; Fukami, K.; Miyata, T.; Miyoshi, H.; Imamura, T.; Ogawa, M.;
Ma-sai, H.; Miyawaki, A. Visualizing Spatiotemporal Dynamics of Multicellular Cell-Cycle
Progression. Cell 2014,132, 487–498.
(26) Liang, H.; Vu, K. T.; Krishnan, P.; Trang, T. C.; Shin, D.; Kimel, S.; Berns, M. W.
Wavelength dependence of cell cloning efficiency after optical trapping. Biophys. J.
1996, 70, 1529–1533.
(27) Toli´c-Nørrelykke, I. M.; Berg-Sørensen, K.; Flyvbjerg, H. MatLab program for precision
calibration of optical tweezers. Comput. Phys. Commun.2004,159, 225–240.
(28) Sch¨afer, J.-P. Implementierung und Anwendung analytischer und numerischer
Ver-fahren zur L¨osung der Maxwellgleichungen f¨ur die Untersuchung der Lichtausbreitung in
biologischem Gewebe. Ph.D. thesis, Universit¨at Ulm. Fakult¨at f¨ur Naturwissenschaften,
2011.
(29) Ranha Neves, A. A.; Fontes, A.; Cesar, C. L.; Camposeo, A.; Cingolani, R.;
Pisig-nano, D. Axial optical trapping efficiency through a dielectric interface. Phys. Rev. E
2007, 76, 061917.
(30) Baumgartl, J.; Kosmeier, S.; Mazilu, M.; Rogers, E. T. F.; Zheludev, N. I.; Dholakia, K.
Far field subwavelength focusing using optical eigenmodes.Appl. Phys. Lett.2011,98,
181109.
(31) De Luca, A. C.; Kosmeier, S.; Dholakia, K.; Mazilu, M. Optical eigenmode imaging.
Phys Rev A 2011, 84, 021803(R).
(32) Lee, W. M.; Reece, P. J.; Marchington, R. F.; Metzger, N. K.; Dholakia, K. Construction
and calibration of an optical trap on a fluorescence optical microscope. Nat. Protoc.
2007, 2, 3226–3238.
(33) Craig, D., McDonald, A., Mazilu, M., Rendall, H. A., Gunn-Moore, F. J.,
Dho-lakia, K. Data Underpinning - Enhanced optical manipulation of cells using
anti-reflection coated microparticles, University of St. Andrews, St. Andrews, UK, 2015.
DOI:10.17630/6b2cc9f9-90f2-4b83-9990-35cff3ff31e5 (accessed July 2, 2015).