http://go.warwick.ac.uk/lib-publications
Original citation:Simms, Victoria, Gilmore, Camilla, Cragg, Lucy, Marlow, Neil, Wolke, Dieter and Johnson, Samantha. (2013) Mathematics difficulties in extremely preterm children : evidence of a specific deficit in basic mathematics processing. Pediatric Research, Vol.73 (No.2). pp. 236-244.
Permanent WRAP url:
http://wrap.warwick.ac.uk/53959
Copyright and reuse:
The Warwick Research Archive Portal (WRAP) makes the work of researchers of the University of Warwick available open access under the following conditions. Copyright © and all moral rights to the version of the paper presented here belong to the individual author(s) and/or other copyright owners. To the extent reasonable and practicable the material made available in WRAP has been checked for eligibility before being made available.
Copies of full items can be used for personal research or study, educational, or not-for-profit purposes without prior permission or charge. Provided that the authors, title and full bibliographic details are credited, a hyperlink and/or URL is given for the original metadata page and the content is not changed in any way.
Publisher’s statement:
http://dx.doi.org/10.1038/pr.2012.157
First published in Pediatric Research published by Nature Publishing Group.
A note on versions:
The version presented here may differ from the published version or, version of record, if you wish to cite this item you are advised to consult the publisher’s version. Please see the ‘permanent WRAP url’ above for details on accessing the published version and note that access may require a subscription.
Mathematics difficulties in extremely preterm children:
Evidence of a specific deficit in basic mathematics processing.
Running title: Mathematics difficulties in EP children
Victoria Simms1, Camilla Gilmore2, Lucy Cragg3, Neil Marlow4, Dieter Wolke5, Samantha
Johnson1
1Department of Health Sciences, University of Leicester, Leicester, UK.
2Centre for Mathematics Education, Loughborough University, Loughborough, UK.
3School of Psychology, University of Nottingham, UK.
4Institute for Women’s Health, University College London, London, UK.
5Department of Psychology and Division of Mental Health and Wellbeing, Warwick Medical School,
University of Warwick, Coventry, UK.
Address for correspondence:
Dr Samantha Johnson,Ph.D, CPsychol.
Department of Health Sciences
University of Leicester
22-28 Princess Road West
Email: [email protected]
Tel: +44 (0)116 252 5444
Fax: +44 (0)116 252 3272
Funding.This study was funded by the Medical Research Council (MRC), London, UK.
Category of study.Population study.
Abstract
BackgroundExtremely preterm (EP, <26 weeks gestation) children have been observed to
have poor academic achievement in comparison to their term-born peers, especially in
mathematics. This study investigated potential underlying causes of this difficulty.
Methods.219 extremely preterm participants were compared with 153 term-born control
children at 11 years old. All children were assessed by a psychologist on a battery of
standardised cognitive tests and a number estimation test assessing children’s numerical
representations.
Results.EP children underperformed in all tests in comparison to the term controls (the
majority of p’s<.001). Different underlying relationships between performance on the
number estimation test and mathematical achievement were found in extremely preterm
compared to control children. That is, even after controlling for cognitive ability, a
relationship between number representations and mathematical performance persisted for
EP children only (EP: r= .346, n= 186, p< .001; Control: r= .095, n=146, p= .256).
Conclusion.Interventions for EP children may target improving children’s numerical
Despite sustained increases in survival rates for children born extremely preterm (EP; <26
weeks gestation)1, the prevalence of severe neurodevelopmental impairments has remained relatively static and cognitive deficits continue to be the most prevalent
disability2.In addition to global cognitive impairments present in up to 45% of survivors3, specific neuropsychological difficulties include deficits in attention4, executive function5,6, working memory7, processing speed8and visuo-spatial skills9. These are evident even in the preschool years10,11and contribute to the poor educational outcomes observed in this population3,12. EP children also have specific difficulties in processing simultaneously, rather than sequentially, presented information13.
Although there is considerable individual variation in outcomes, as a group EP children have
poorer academic attainment than term-born peers across all school subjects9,14and up to
two-thirds have some special educational needs (SEN)3. One of the most consistent findings
is that EP children have specific difficulties with mathematics that impact markedly upon
their attainment at school13,15. When comparing EP children to term born peers the most
substantial deficits are consistently in mathematics. In contrast to reading, performance,
group differences in mathematics performance remain after controlling for neurosensory
impairments or general cognitive ability3,16.
As yet, little is known about the specific nature of mathematics difficulties in preterm
populations and there is a paucity of studies investigating the underlying mechanisms that
may account for these deficits17. Emerging research with typically developing children has revealed that both domain-general and domain-specific skills play a critical role in individual
predictors of attainment in mathematics include visuospatial skills, working memory,
shifting and inhibitory control19,20and there is also evidence that language abilities perform an essential role21.In addition, domain-specific skills such as retrieval speed of answers22, use of efficient strategies23and procedural competency24also contribute to mathematical success. In particular, the accuracy and precision of internal numerical representations,
typically assessed using measures of children’s estimation skills or the ability to enumerate
or discriminate between quantities, have been found to be predictive of achievement in
mathematics25.
Investigating EP children’s numerical representations and mathematical processing in detail
is thus an important first step in understanding their mathematical difficulties and in
developing targeted interventions for this group. This study aimed to (1) investigate the
association between numerical representations and attainment in mathematics and (2)
identify domain-general and domain-specific processes that may underlie poor
mathematical attainment in EP children.
Results
Effect of EP birth on standardised and experimental tests
Control children completed all of the tasks, except for one child who did not complete the
Mathematics Estimation Test (MET) due to time constraints. Three EP children were unable
to complete the Wechsler Individual Achievement Test-Reading (WIAT-RS), two did not
complete the developmental neuropsychology test (NEPSY-II) Attention/Executive
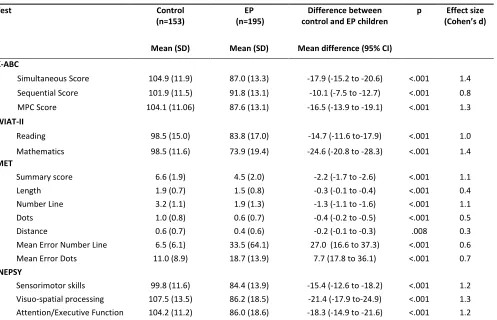
Functioning sub-task and one did not complete the MET. Table 1 shows descriptive statistics
As expected, EP children underperformed on all measures in comparison to term-born
children. There were large effect sizes for between group differences in accuracy on all
measures, except for three of the four MET subcomponents (length, dots and distance)
wherein small to medium effect sizes were observed. Not only were control children
significantly more accurate on all subcomponents of the MET, but they also made
significantly fewer erroneous responses to the dot and number line questions (Table 1).
Group differences in the magnitude of error for the number line and dots subcomponent
also showed large effect sizes. There were no significant sex differences in the control group
on any measure. Sex differences were observed for the EP group for Mental Processing
Composite (MPC) scores (Male: M= 85.4, SD=12.2, Female: M=89.3, SD= 13.6; t(196)=-2.1,
p=.04), Kaufman Assessment Battery for Children (K-ABC) Simultaneous (Male: M= 84.8,
SD=12.5, Female: M=88.8, SD=13.6; t(196)=-2.1, p=0.03), Sensorimotor (Male: M= 81.7,
SD=15.1, Female: M=86.5, SD= 13.1; t(193)=-2.4, p=.02) and Attention/Executive Function
(Male: M= 80.2, SD=17.2, Female: M=90.4, SD= 18.4; t(195)=-3.9, p<.001), with females
having higher scores than males. There were no significant differences in any test scores
between EP children born at 22-24w vs. 25w.
Associations between mathematics attainment and domain-specific and domain-general
measures
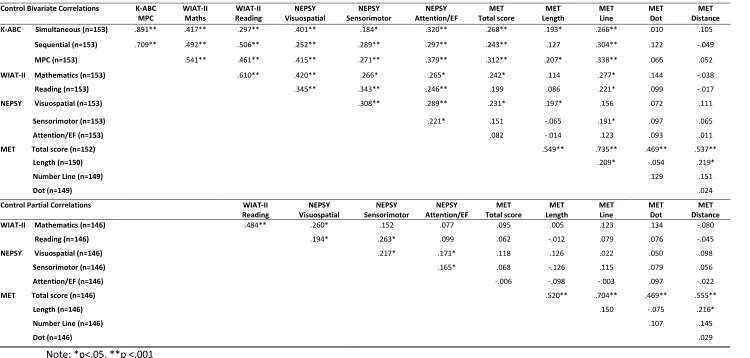
Bivariate correlations between all measures for control and EP children are shown in Table
2. There were significant correlations between Wechsler Individual Achievement
Test-Mathematics (WIAT-MS) and all domain-general and domain-specific measures for both
the only significant correlation was between WIAT-MS and number line scores. In contrast,
for EP children, significant correlations were observed between WIAT-MS and number line,
dot and length sub-components. Fisher r-to-z transformations revealed that all correlations
between WIAT-MS scores and other measures were significantly stronger for EP than
control children (z range: -2.61 to -4.75, all p<.05). The most substantial differences in
correlations between EP and control children were for WIAT-MS and MET scores (z=-4.75,
p=.003) and WIAT-MS and Number Line sub-component scores (z= -4.58, p<.001) with
significantly stronger associations found for EP children.
Partial correlations were conducted to control for MPC (Table 2). For control children, the
only correlations with WIAT-MS scores that remained significant were with WIAT-RS and
NEPSY Visuospatial scores. For EP children correlations between WIAT-MS scores and the
other main measures remained significant (p<.05). For the domain-specific skills the
correlation with WIAT-MS and both MET total score and number line MET sub-component
remained significant. After adjustment for MPC, the correlation between MET and WIAT-MS
was no longer significant for control children (p= .250), but this correlation remained so for
EP children (r= .346, n= 186, p< .001) (Figure 1).
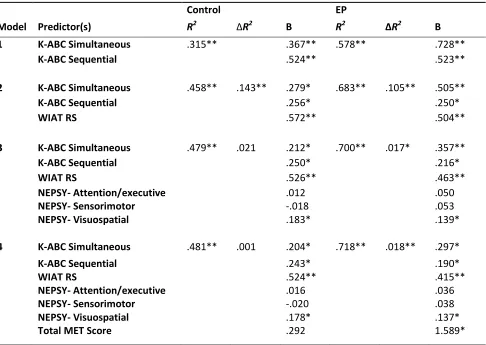
Predicting attainment in mathematics
Hierarchical step-wise multivariable linear regression was conducted to evaluate the
contribution of domain-general (K-ABC Simultaneous, K-ABC Sequential, , WIAT-RS, NEPSY
Sensorimotor, NEPSY Visuospatial and NEPSY Attention and Executive Function) and
domain-specific (MET) measures to attainment in mathematics (WIAT-MS). This analysis
of the contribution of the measures within each group (Table 3). Regression analysis
indicated that K-ABC Simultaneous, K-ABC Sequential, WIAT-RS and NEPSY Visuospatial
scores significantly contributed to both EP and control children’s attainment in
mathematics, explaining a substantial amount of the variance in WIAT-MS scores (Control=
48%, EP= 72%). Simultaneous processing was a stronger predictor of WIAT-MS than
sequential processing for EP children; the reverse was true for control children (EP
Simultaneous: B= .30, p=.001, 95% CI= .12 to .48; EP Sequential: B= .19, p=.02, 95% CI= .03
to .35; Control Simultaneous: B= .20, p=.02, 95% CI= .03 to .38; Control Sequential: B= .24,
p=.01, 95% CI= .05 to .43). MET scores only contributed significantly to EP children’s
WIAT-MS, explaining an extra 2% of the variance for this group of children (EP MET: B= 1.59,
p=.001, 95% CI= .66 to 2.52; Control MET: B= .29, p>.05, 95% CI= -.69 to 1.27).
Discussion
The results of this study confirm those of previous investigations and demonstrate that, by
the end of primary education, EP children have markedly poorer attainment in mathematics
compared with children born at term. As expected, term-born control children
outperformed EP children on all measures with large effect sizes for the majority of
comparisons. The observed between-group discrepancies in performance are consistent
with previous studies that have reported significant deficits in academic performance in EP
children with the most substantial differences in standardised measures of attainment in
This study also confirmed previous research that has shown that both literacy skills and
visuospatial skills are important for success in mathematics in both EP and control groups as
quantified in Table 322,24,25. The relationship between these domain-general skills and
mathematics attainment observed for both groups emphasises the importance of a wide set
of neuropsychological skills in the development of mathematical ability. In contrast, we did
not observe a significant contribution to WIAT-MS scores from sensorimotor or
attention/executive skills for both the control and EP group. This may be a surprising in light
of previous studies that have suggested the importance of attention, executive functions
and motor skills for success in mathematics22-24and academic performance in general26.
A contrasting relationship between scores on the K-ABC Sequential and Simultaneous scales
was noted for EP and control children. EP children did not perform as well as control
children on either of these scales; however EP children had greater difficulty with processing
simultaneously presented information rather than sequentially presented information, a
result replicating that of previous studies13,14. In fact, simultaneous, rather than sequential,
processing score was a stronger predictor of WIAT-MS for the EP group, the reverse was
true for control children. Therefore our results suggest that EP children may have a specific
difficulty in integrating information, a skill that appears to be important for mathematical
processing.
To our knowledge, this is the first study to investigate specific components of mathematic
processing in EP children. Initially we observed significant correlations with WIAT-MS and
MET scores for both control and EP children, indicating a relationship between attainment
and is consistent with previous studies of typically developing children that have
demonstrated a relationship between numerical representations and mathematical ability27.
However, we observed a different relationship between numerical representations and
attainment in mathematics for EP and control children. Associations between the measures
of attainment and numerical representations were significantly stronger for EP children.
After controlling for overall cognitive ability (MPC), the relationship between WIAT-MS and
MET scores remained significant for EP children only. This suggests that, in contrast to
control children, EP children’s attainment in mathematics was associated with their
underlying accuracy of numerical representations and was not simply a component of their
general cognitive ability. This was further exemplified in the results of the step-wise
regression analyses in which MET scores contributed significantly to WIAT-MS scores above
the other domain general measures only for EP children. This study therefore pinpoints that
EP children have specific difficulty in numerical estimations – a basic mathematical skill
-that contributed significantly to their overall mathematical performance. Thus we have
demonstrated that mathematics learning difficulties in the EP population may not arise
solely as part of the spectrum of domain-general cognitive impairments typically associated
with preterm birth, but may involve additional deficits in specific components of
mathematical processing which contribute significantly their underachievement in this area.
Solving mathematical tasks involves different brain areas and the collaboration of large
neural networks. The 4CAPS model of complex cognitive neuroarchitecture proposes that
when resource demands exceed the resource supply of the first centre, processing spills
Considering that EP children have greater general domain limitations, this spill-over is likely
to occur sooner and requires the recruitment of specific skills, such as numerical
representations. Thus, it appears consistent with the 4CAPS model, that recruiting more
centres leads to costs such as bandwith limitations and more co-ordination, all which can be
costly for overall performance.
Our finding of the importance of numerical representations for achievement in mathematics
in the EP population may perhaps have been expected. A previous neuroimaging study has
suggested that preterm children’s poor magnitude representations may contribute to their
overall difficulty in mathematics29. In addition, it is interesting to note that mathematical
difficulties have been associated with poor internal representations of number in other
populations of children with neurodevelopmental disorders, for example in children with
William’s Syndrome30, Downs Syndrome30and Velio Cardial Facial Syndrome31.
These results suggest that potential educational interventions aiming to improve
mathematics attainment in EP children might be best targeted specifically to this population
and may involve attempting to improve numerical representations. Indeed, interventions
designed to increase children’s accuracy of numerical representations have been shown to
concurrently improve general mathematical performance32. However, given the significant association between attainment and other domain-general measures observed in this study,
the potential of targeting improvement in these other skills, such as visuospatial skills that
require simultaneous information processing, for improving outcomes in mathematics
focusing on both numerical representations and visuospatial skills, in contrast to
interventions used with term-born children experiencing pure mathematical difficulties.
The strengths of this study may be attributed to its use of gold-standard contemporary
measures of children’s cognitive ability and academic attainment, the high level of
inter-rater reliability achieved and the care taken to ensure psychologists were blind to the child’s
birth status. The EP children comprised a large, whole-population based sample drawn from
children across the whole of the UK and Ireland who were assessed with a
contemporaneous comparator group who achieved a distribution of scores on standardised
tests that would be expected of the general population. This is the first time that numerical
representations in relation to mathematics abilities has been reported in EP children;
however the MET itself, although sensitive for detecting group differences, is a brief
measure. On the other hand, it makes the MET highly usable in both research and school
settings. Of course, numerical representations are a single component of a range of
separable mathematical processes shown to underlie performance in curriculum-based
tests. Thus, future studies should assess a wider range of processes and skills to further
investigate the specific difficulties that EP children have with mathematics and the
underlying processes associated with these problems.
The results of this study advance our understanding of the likely causes of EP children’s
difficulties in mathematics and have indicated that one contributing factor may be
erroneous numerical representations. A further, more in-depth investigation of preterm
these difficulties occur and what strategies may be effective in improving academic
outcomes for these children.
Method
Participants
Children were recruited from the EPICure Study, a national study of outcome following EP
birth (www.epicure.ac.uk). All babies born <26 weeks gestational age in the whole of the UK
and Ireland from March through December 1995 and who were admitted for neonatal
intensive care (n=811) were invited to participate in the EPICure study. Of surviving children
at each time point, 283 (90%) were assessed at 2.5 years33, 241 (78%) at 6 years34and 219 (71%) at 11 years of age2.
Analyses for this report use data obtained from follow-up assessments at 11 years of age. At
this age, 219 EP children were assessed with a comparison group of 153 children born at
term and matched for age, sex and ethnic group where possible to an EP child in
mainstream school. Controls were not selected for children in special schools. A detailed
description of the full sample at 11 years is published previously3. Of these, 21 EP children
were unable to complete the full battery of mathematics tests and were excluded from this
study. Reasons for exclusion were as follows: functioning below the level of the test (14
children), blindness (2 children), attention difficulties (2 children), Autism (1 child), limited
language (1 child) and poor motor skills (1 child). Nineteen of the excluded children were
classified as having a serious disability. Participants thus comprised 195 EP children (mean
control children (mean age at assessment 131.2m; SD: 6.6m; range: 117-147m; males: 42%).
There were no significant differences in mean age at assessment (t(349)=0.3, p= .781) or sex
(t(351)=0.1, p=0.8) between EP children and controls. Of EP children, 34.8% had a cognitive
impairment (Intelligence quotient (IQ) score <-2SD of control reference data measured with
the K-ABC MPC35, and 4.5%, 5.6% and 1% had a motor, vision or hearing impairment. In contrast, 1.3% of term-controls had a cognitive impairment and none had visual, hearing or
motor impairments.
Procedure
Parents and children received study information leaflets and parents provided informed
consent for their child’s participation at 11 years of age. Children were assessed individually
by a psychologist in a quiet area in the child’s school (92%), at their home (7%) or a hospital
(1%). Psychologists had no prior knowledge of the child and were blind to study group
allocation. The study was approved by the Southampton and South West Hampshire
Research Ethics Committee.
Measures
One of three study psychologists administered the reading and mathematics scales of the
Wechsler Individual Achievement Test-II (WIAT-IIUK 36). This is the most contemporary standardised test of curriculum-based attainment from which standardised scores (mean
100; SD 15; range 40-160) were derived for attainment in reading and mathematics.
WIAT-RS sub-scales assessed reading comprehension, word reading and pseudo-word decoding.
WIAT-MS sub-scales comprised numerical operations (paper and pencil test of performance
presented test of ability to apply mathematics in everyday scenarios, e.g., telling the time,
using money).
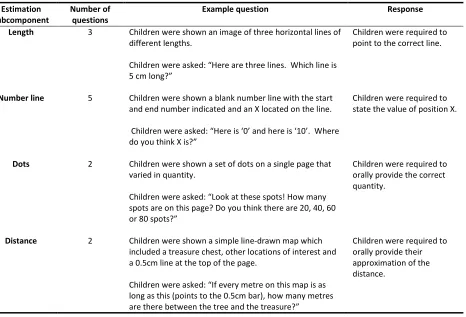
To assess domain-specific numerical representations, children completed the English
version of the MET37previously used with very preterm and fullterm children in a German sample. This task was presented to children in book form and required oral or manual
responses to 12 items assessing approximations of four sub-components of numerical
estimations: length, number line, dot and distance (Table 4). Item responses were scored
for accuracy and a total score (range 0-12) was summed in addition to summary scores for
each of the four sub-components of the test. Error scores for the number line and dot tasks
were also calculated by subtracting the correct answer from the child’s response in order to
establish the magnitude of error on these tasks.
Two tests of domain-general abilities were administered. IQ was assessed using the K-ABC35.
The K-ABC comprises eight age-appropriate subtests which generate two separate global
scales: Sequential (3 subtests) and Simultaneous (5 subtests) Processing. These two global
scales were also combined into a MPC (standardised mean 100; SD 15; range 40-160) score
for global cognitive ability (IQ). Children also completed the NEPSY38a standardised developmental neuropsychological test battery. Standardised scores (mean 100; SD 15;
range 50-150) for Sensorimotor, Visuospatial Processing and Attention and Executive
Functioning were derived. Psychologists achieved excellent inter-rater reliability on all tests
(agreement on >95% item scores) prior to commencing data collection.
Data were double entered, verified and analysed using SPSS v18.0. Independensamples
t-tests were used to compare performance on all measures between EP and control children
and Cohen’s d was calculated to determine standardised effect sizes across tests. Effect
sizes were defined as small (0.2-0.3), medium (0.3-0.5) or large (>0.5)39. Bivariate
correlations (two-tailed) between all measures were conducted for EP and control children
separately and partial correlations (two-tailed) were conducted controlling for MPC. Fischer
r-to-z transformations were also calculated to assess the difference in magnitude between
correlations for the EP and control group on the same measures. Separate hierarchical
step-wise multivariable linear regressions were conducted for control and EP children to identify
predictors of mathematics attainment. WIAT-MS was the dependent variable and
independent variables were entered in the following order (domain general to domain
specific): Step 1 K-ABC Simultaneous and Sequential Processing; Step 2 WIAT-RS; Step 3
NEPSY Sensorimotor, Visuospatial Processing and Attention and Executive Functioning; Step
References
1Field DJ, Dorling JS, Manktelow BN, Draper ES. Survival of extremely premature babies in a
geographically defined population: Prospective cohort study of 1994-9 compared with
2000-5. BMJ 2008; 336: 1221-3.
2Johnson S, Fawke J, Hennessy E, et al. Neuro-developmental disability through 11 years of
age in children born before 26 weeks of gestation. Pediatrics 2009; 124: e249-7.
3Johnson S, Wolke D, Hennessy E, Smith R, Trikic R, Marlow N. Academic attainment and
special educational needs in extremely preterm children at 11 years of age: the EPICure
Study. Arch Dis Child Fetal Neonatal Ed 2009; 94: F283-9.
4Anderson P J, De Luca CR, Hutchinson E, Spencer-Smith MM, Roberts G, Doyle LW, Victoria
Infant Collaborative Study Group. Attention problems in a representative sample of
extremely preterm/extremely low birth weight children. Dev Neuropsycol 2011; 36: 57-73.
5Mulder H, Pitchford N, Haggar MS, Marlow N. Development of executive function and
attention in preterm children: A systematic review.Dev Neuropsychol 2009; 34: 393-421.
6Marlow N, Hennessy EM, Bracewell MA, Wolke D. Motor and executive function at 6 years
of age after extremely preterm birth. Pediatrics 2007; 120: 793-804.
7Luciana M, Lindeke L, Georgieff M, Mills M, Nelson CA. Neurobehavioral evidence for
working-memory deficits in school-aged children with histories of prematurity. Dev Med
8Rose SA, Feldman JF. Memory and processing speed in preterm children at eleven years: a
comparison with full-terms. Child Dev 1996; 67: 2005-21.
9Johnson S, Wolke D, Hennessy E, Marlow N. Educational outcomes in extremely preterm
children: neuropsychological correlates and predictors of attainment. Dev Neuropsycol
2011; 36: 74-95.
10 Taylor G, Klein N, Anselmo MG, Minich N, Espy KA, Hack M. Learning problems in
kindergarten students with extremely preterm birth. Arch Pediatr Adolesc Med 2011; 165:
819-25.
11Woodward LJ, Moor S, Hood K, et al. Very preterm children show impairments across
multiple neurodevelopmental domains by age 4 years.Arch Dis Child Fetal Neonatal Ed2009;
94: F339-44.
12Hornby G, Woodward LJ. Educational needs of school-aged children born very and
extremely preterm: a review. Educ Psychol Rev 2009; 21: 247–66.
13Wolke D, Meyer R. Cognitive status, language attainment, and prereading skills of
6-year-old very preterm children and their peers: the Bavarian longitudinal study. Dev Med Child
14Johnson S, Marlow N, Wolke D. Assessing educational outcomes in middle childhood:
validation of the teacher academic attainment scale. Dev Med Child Neurol 2012; 54:
544-51.
15Taylor G, Espy KA, Anderson P J. Mathematics deficiencies in children with very Low Birth
Weight or Very Preterm Birth. Dev Disabil Res Rev 2009; 15: 52-9.
16Anderson P, Doyle W, the Victorian Infant Collaborative Study Group. Neurobehavioural
outcomes of school-age children born extremely low birth weight or very preterm in the
1990s. J Am Med Ass 2003; 289: 3264-72.
17Wocadlo C, Rieger I. Phonology, rapid naming and academic achievement in very preterm
children at eight years of age. Early Hum Dev 2007; 83: 367-77.
18Geary D C, Hoard, MK, Byrd-Craven J, Nugent L, Numtee C. Cognitive mechanisms
underlying achievement deficits in children with mathematical learning disability. Child Dev
2007; 78: 1343-59.
19Mazzocco MM, Bhatia NS, Lesniak-Karpiak K. Visuospatial skills and their association with
math performance in girls with Fragile X or Turner Syndrome. Child Neuropsychol 2006; 12:
20Bull R, Espy KA, Wiebe S. Short-term memory, working memory and executive
functioning: longitudinal predictors of mathematics achievement at age 7. Dev
Neuropsychol 2008; 33: 205-28.
21 LeFevre J-A, Fast L, Skwarchuk S-L, et al. Pathways to mathematics: longitudinal
predictors of performance. Child Dev 2010; 81: 1753-67.
22Geary DC. Mathematical disabilities: Cognitive, neuropsychological, and genetic
components. Psychol Bull 1993; 114: 345-62.
23Torbeyns J, Verschaffel L, Ghesquière P. Strategy development in children with
mathematical disabilities: Insights from the choice/no-choice method and the chronological
age/ability-level-match design. J Learning Disabil 2004; 37: 119-31.
24Geary DC, Brown SC. Cognitive addition: Strategy choice and speed-of-processing
differences in gifted, normal, and mathematically disabled children. Dev Psychol 1991; 27:
398-406.
25De Smedt B, Verschaffel L, Ghesquière P. The predictive value of numerical magnitude
comparison for individual differences in mathematics achievement. J Exp Child Psychol
26Jaekel J, Bartmann P, Wolke, D. Poor attention rather than hyperactivity/Impulsivity
predicts academic achievement in very preterm and fullterm adolescents. Psychol Med
2012;FirstViewArticle: 1-14.
27Gilmore CK, McCarthy SE, Spelke ES. Non-symbolic arithmetic abilities and mathematics
achievement in the first year of formal schooling. Cognition 2010; 115: 394-406.
28Just MA, Varma, S. The organization of thinking: what functional brain imaging reveals
about the neuroarchitecture of complex cognition. Cog Affect Behav Neurosci 2007; 7:
153-91.
29Issacs EB, Edmonds C J, Lucas A, Gadian DG. Calculation difficulties in children of very low
birth weight: A neural correlate. Brain 2001; 124: 1701-7.
30Paterson SJ, Girelli L, Butterworth B, Karmiloff-Smith A. Are numerical difficulties
syndrome specific? Evidence from Williams syndrome and Down Syndrome. J Child Psychol
Psychiatry 2006; 47: 190-204.
31De Smedt B, Swillen A, Devriendt K, Fryns JP, Verschaffel L, Ghesquière P. Mathematical
disabilities in children with Velo-Cardio-Facial Syndrome. Neuropsychologia 2007; 45:
885-95.
32Ramani GB, Siegler R S. Reducing the gap in numerical knowledge between low- and
33Wood N, Costeloe K, Gibson A, Hennessy E, Marlow N, Wilkinson A. The EPICure study:
associations and antecedents of neurological and developmental disability at 30 Months of
age following extremely preterm birth. Arch Dis Child Fetal Neonatal Ed 2005; 90: F134-40.
34Marlow N, Wolke D, Bracewell M, Samara M. Neurologic and developmental disability at 6
years of age following extremely preterm birth. New Engl J Med 2005; 352: 9-19.
35Kaufman, AS, Kaufman, NL. Kaufman-ABC. 2ndedn. Circle Pines, MN: American Guidance
Service, 2004.
36Weschler D. Weschler Individual Achievement Test. 2ndUK edn. Oxford, UK: Pearson
Assessment/PsychCorp, 2005.
37Wolke, D., Schulz, J., & Meyer, R. (2001). Entwicklungslangzeitfolgen bei ehemaligen, sehr
unreifen Fruehgeborenen. (Long term developmental outcome of ex very preterm born
children). Monatsschrift fuer Kinderheilkunde 2001; 149: S53-61.
38Korkman M, Kirk U, Kemp S. NEPSY: A developmental neuropsychological assessment. San
Antonio, TX: The Psychological Corporation, 1998.
39Cohen J. Statistical power analysis for the behavioral sciences. 2nd edn. Hillsdale, NJ:
Figure legend text
Figure 1: The relationship between WIAT Mathematics and total MET score standardized
WIA
T
M
S Stan
d
ard
iz
ed Re
sid
u
al
Note: K-ABC MPC= Kaufman ABC Mental Processing Composite Score. Range of scores: K-ABC MPC (Control= 68 -143; EP= 47-123), WIAT-II
MS (Control= 68-131; EP= 40-117 ), WIAT-II RS (Control= 67- 125, EP= 41-122), MET summary score (Control= 3-11; EP=0-9 ), NEPSY
Sensorimotor skills (Control= 66-132; EP= 49- 120), NEPSY Visuospatial processing (Control= 68-139; EP= 49-124), NEPSY
Attention/Executive Function(Control= 74-135; EP= 49-124).
Test Control
(n=153)
EP (n=195)
Difference between control and EP children
p Effect size (Cohen’s d)
Mean (SD) Mean (SD) Mean difference (95% CI)
K-ABC
Simultaneous Score 104.9 (11.9) 87.0 (13.3) -17.9 (-15.2 to -20.6) <.001 1.4 Sequential Score 101.9 (11.5) 91.8 (13.1) -10.1 (-7.5 to -12.7) <.001 0.8
MPC Score 104.1 (11.06) 87.6 (13.1) -16.5 (-13.9 to -19.1) <.001 1.3
WIAT-II
Reading 98.5 (15.0) 83.8 (17.0) -14.7 (-11.6 to-17.9) <.001 1.0
Mathematics 98.5 (11.6) 73.9 (19.4) -24.6 (-20.8 to -28.3) <.001 1.4
MET
Summary score 6.6 (1.9) 4.5 (2.0) -2.2 (-1.7 to -2.6) <.001 1.1
Length 1.9 (0.7) 1.5 (0.8) -0.3 (-0.1 to -0.4) <.001 0.4
Number Line 3.2 (1.1) 1.9 (1.3) -1.3 (-1.1 to -1.6) <.001 1.1
Dots 1.0 (0.8) 0.6 (0.7) -0.4 (-0.2 to -0.5) <.001 0.5
Distance 0.6 (0.7) 0.4 (0.6) -0.2 (-0.1 to -0.3) .008 0.3
Mean Error Number Line 6.5 (6.1) 33.5 (64.1) 27.0 (16.6 to 37.3) <.001 0.6
Mean Error Dots 11.0 (8.9) 18.7 (13.9) 7.7 (17.8 to 36.1) <.001 0.7
NEPSY
[image:26.595.35.532.149.469.2]Note: *p<.05, **p <.001 Control Bivariate Correlations K-ABC
MPC WIAT-IIMaths ReadingWIAT-II VisuospatialNEPSY SensorimotorNEPSY Attention/EFNEPSY Total scoreMET LengthMET METLine METDot DistanceMET K-ABC Simultaneous (n=153) .891** .417** .297** .401** .184* .320** .268** .193* .266** .010 .105
Sequential (n=153) .709** .492** .506** .252** .289** .297** .243** .127 .304** .122 -.049 MPC (n=153) .541** .461** .415** .271** .379** .312** .207* .338** .066 .052 WIAT-II Mathematics (n=153) .610** .420** .266* .265* .242* .114 .277* .144 -.038
Reading (n=153) .345** .343** .246** .199 .086 .221* .099 -.017
NEPSY Visuospatial (n=153) .308** .289** .231* .197* .156 .072 .111
Sensorimotor (n=153) .221* .151 -.065 .191* .097 .065
Attention/EF (n=153) .082 -.014 .123 .093 .011
MET Total score (n=152) .549** .735** .469** .537**
Length (n=150) .209* -.054 .219*
Number Line (n=149) .129 .151
Dot (n=149) .024
Control Partial Correlations WIAT-II
Reading VisuospatialNEPSY SensorimotorNEPSY Attention/EFNEPSY Total scoreMET LengthMET METLine METDot DistanceMET
WIAT-II Mathematics (n=146) .484** .260* .152 .077 .095 .005 .123 .134 -.080
Reading (n=146) .194* .263* .099 .062 -.012 .079 .076 -.045
NEPSY Visuospatial (n=146) .217* .171* .118 .126 .022 .050 .098
Sensorimotor (n=146) .165* .068 -.126 .115 .079 .056
Attention/EF (n=146) -.006 -.098 -.003 .097 -.022
MET Total score (n=146) .520** .704** .469** .555**
Length (n=146) .150 -.075 .216*
Number Line (n=146) .107 .145
[image:27.842.26.776.125.483.2]Note: *p<.05, **p <.001
Sequential (n=198) .845** .664** .634** .515** .448** .526** .503** .180* .525** .231** .104 MPC (n=198) .733** .684** .678** .541** .641** .597** .260** .598** .288** .084 WIAT-II Mathematics (n=198) .766** .653** .505** .609** .643** .246** .654** .304** .109
Reading (n=195) .538** .398** .542** .550** .121 .581** .224* .194*
NEPSY Visuospatial (n=198) .565** .621** .476* .217* .521** .181* .009
Sensorimotor (n=195) .530** .407** .171* .403** .14 .116
Attention/EF (n=197) .488** .129 .477** .322** .077
MET Total score (n=197) .527** .804** .535** .319**
Length (n=196) .210* -.031 -.012
Number Line (n=196) .269** .014
Dot (n=196) .063
EP Partial Correlations WIAT-II
Maths ReadingWIAT-II VisuospatialNEPSY SensorimotorNEPSY Attention/EFNEPSY Total scoreMET LengthMET METLine METDot DistanceMET WIAT-II Mathematics (n=186) .504** .260** .156* .220* .346** .067 .368** .134 .068
Reading (n=186) .141 .080 .202* .247* -.070 .297** .051 .205*
NEPSY Visuospatial (n=186) .318** .315** .099 .040 .180* -.020 -.067
Sensorimotor (n=186) .268** .108 .040 .117 -.028 .074
Attention/EF (n=186) .140 -.083 .138 .191* .032
MET Total score (n=186) .474** .695** .474** .334**
Length (n=186) .065 -.117 -.039
Number Line (n=186) .129 -.044
Control EP
Model Predictor(s) R2 ΔR2 B R2 ΔR2 B
1 K-ABC Simultaneous .315** .367** .578** .728**
K-ABC Sequential .524** .523**
2 K-ABC Simultaneous .458** .143** .279* .683** .105** .505**
K-ABC Sequential .256* .250*
WIAT RS .572** .504**
3 K-ABC Simultaneous .479** .021 .212* .700** .017* .357**
K-ABC Sequential .250* .216*
WIAT RS .526** .463**
NEPSY- Attention/executive .012 .050
NEPSY- Sensorimotor -.018 .053
NEPSY- Visuospatial .183* .139*
4 K-ABC Simultaneous .481** .001 .204* .718** .018** .297*
K-ABC Sequential .243* .190*
WIAT RS .524** .415**
NEPSY- Attention/executive .016 .036
NEPSY- Sensorimotor -.020 .038
NEPSY- Visuospatial .178* .137*
Total MET Score .292 1.589*
[image:29.595.75.561.97.442.2]subcomponent questions
Length 3 Children were shown an image of three horizontal lines of different lengths.
Children were asked: “Here are three lines. Which line is 5 cm long?”
Children were required to point to the correct line.
Number line 5 Children were shown a blank number line with the start and end number indicated and an X located on the line.
Children were asked: “Here is ‘0’ and here is ‘10’. Where do you think X is?”
Children were required to state the value of position X.
Dots 2 Children were shown a set of dots on a single page that varied in quantity.
Children were asked: “Look at these spots! How many spots are on this page? Do you think there are 20, 40, 60 or 80 spots?”
Children were required to orally provide the correct quantity.
Distance 2 Children were shown a simple line-drawn map which
included a treasure chest, other locations of interest and a 0.5cm line at the top of the page.
Children were asked: “If every metre on this map is as long as this (points to the 0.5cm bar), how many metres are there between the tree and the treasure?”
[image:30.595.65.531.97.414.2]