warwick.ac.uk/lib-publications
Original citation:
Hughes, F., Day, R., Tung, N. and Dixon, Steve. (2016) High-frequency eddy current
measurements using sensor-mounted electronics. Insight- Non-Destructive Testing &
Condition Monitoring, 58 (11). pp. 596-600.
Permanent WRAP URL:
http://wrap.warwick.ac.uk/85800
Copyright and reuse:
The Warwick Research Archive Portal (WRAP) makes this work by researchers of the
University of Warwick available open access under the following conditions. Copyright ©
and all moral rights to the version of the paper presented here belong to the individual
author(s) and/or other copyright owners. To the extent reasonable and practicable the
material made available in WRAP has been checked for eligibility before being made
available.
Copies of full items can be used for personal research or study, educational, or not-for-profit
purposes without prior permission or charge. Provided that the authors, title and full
bibliographic details are credited, a hyperlink and/or URL is given for the original metadata
page and the content is not changed in any way.
Publisher’s statement:
We facilitate Open Access by permitting the author to re-use the original work in any way
(see (3) above). This includes allowing the author to self-archive their own final version of
the manuscript, after the corrections and revisions required from the peer review process
have been incorporated (i.e. the 'published PDF'). In the online environment, this is like a
Creative Commons CC-BY-NC licence allowing others to distribute, remix, tweak, and build
upon the work, as long as this is done not for commercial gain and credit is given for the
original creation.
A note on versions:
The version presented here may differ from the published version or, version of record, if
you wish to cite this item you are advised to consult the publisher’s version. Please see the
‘permanent WRAP URL’ above for details on accessing the published version and note that
access may require a subscription.
High frequency eddy current measurements using sensor mounted electronics
Foz Hughes
1, Robert Day
1Nixon Tung
1and Steve Dixon
1,21
Department of Physics, University of Warwick, Coventry CV4 7AL, UK
2School of Engineering, University of Warwick, Coventry CV4 7AL, UK
Abstract
Eddy current techniques are used widely for the detection of surface breaking cracks in metal samples and the detection of such defects on metals with low electrical conductivity is challenging. For good sensitivity to small surface cracks, the electromagnetic skin-depth of the eddy current needs to be small, which often means operating at MHz frequencies. One of the major challenges in high frequency eddy current testing is that the capacitance of the cable between the instrument electronics and the sensor head becomes significant in the MHz range, making the system unstable and
introducing noise into the system as the cable moves and electrically interacts with objects close to it. There are significant benefits to locating the electrical circuitry directly behind the eddy current sensor coils, reducing issues with cable induced electrical noise, enabling one to detect smaller defects at earlier stages of growth. Materials such as nickel based super-alloys, titanium, austenitic steel and carbon fibre composites are often used in safety critical applications, where the ability to detect surface cracks at the earliest possible stage is vital. Examples are presented that show detection of small defects on a range of challenging materials at eddy current frequencies to over 15 MHz.
Introduction
Industry has consistently highlighted the need for improved eddy current and electromagnetic testing capabilities [1], and the ability to detect small surface breaking defects in safety critical applications such as in jet engine components is extremely important for safety but also potentially for cost savings in asset management. One can increase the sensitivity to small surface defects by reducing the depth to which eddy currents flow in the sample surface. This electromagnetic skin depth for an
electromagnetic plane wave is often defined by the equation given below
(1)
where is the electrical conductivity of the sample, is the magnetic permeability of the sample and is the frequency of the electromagnetic wave from the eddy current coil. It is worth noting that this equation is a simplification and approximation for a plane wave up to MHz frequencies [2]. The electromagnetic field from an eddy current coil is not a plane wave and there has been a large body of work that explains and describes how eddy currents are distributed from realistic shaped coils, where the geometry of a coil has a significant influence on the depth to which induced or eddy currents flow in the sample [3]. The simplified equation above though, does give us some insight for some
considerations that we need to make, and an estimate of the depth to which an eddy current would flow for a given sample and frequency.
Metal components with high electrical conductivity such as aluminium, or high magnetic permeability tend to have relatively electromagnetic small skin depths at MHz frequencies, and using equation (1) above, at 1 MHz we would obtain skindepths of 83 m and 650 m, in aluminium and a titanium alloy (Ti-6Al-4V) respectively . Approximately 63% of the total eddy current in the sample is confined to within one skindepth, and at one skindepth deep the current lags the current at the surface by 57˚. The current contained within a depth of two skindepths into the sample is approximately 86% of the total eddy current, and at two skindepths deep, the current lags the current at the surface by 115˚. These values will of course change for more realistic, non-planar electromagnetic waves from coils, but an important point to convey here is that both the amplitude and phase of the eddy current vary with depth, and the simplified diagrams of eddy currents acting at or under the surface do not fully capture the complexity of the situation. Also note that in order to obtain good sensitivity to surface
1
f
defects, one requires the skindepth to be comparable to or smaller than the target defect depth, so using the plane wave assumption, one might make a crude estimate that for good sensitivity to a defect of 200 m deep in Ti-6Al-4V, one might aim to operate at an eddy current frequency of 10 MHz or higher.
In most scientific or Non Destructive Testing (NDT) instrumentation, coaxial cables are used to connect various components together, as they have a consistent electrical impedance and built in electromagnetic screening through their design. At MHz frequencies, one cannot neglect the capacitance or inductance of these cables, which can capacitively or inductively couple to other objects that are close to them. Small changes in the combined electrical properties of a cable connected to an eddy current coil can arise from changes in the layout of the cable, even when the coupling between the coil and sample is unchanged. We have demonstrated that this can be greatly reduced by building some of the key electrical circuitry directly behind the eddy current coils in a two coil system, dramatically boosting sensor sensitivity and practicality.
Removing the need for a long cable between the eddy current coil and its current source greatly improve signal:noise for high frequency eddy current measurements. Taking care to engineer the sensor delivery will in itself provide a useable, high frequency eddy current probe prototype. Demonstrating the potential for this approach to improve measurement sensitivity and reliability will provide a platform for further research in this area, extending the work into eddy current arrays, scanning near resonance and replacing the Howland current source with alternative drive circuits, including differential coil type measurements. Removing the long cable between the electronics and the coil will give greater freedom on coil design, as coils with low inductance are very difficult to operate with good signal:noise when the electrical impedance of the relatively long cable dominates the impedance of the coil.
High frequency eddy current testing reduces the electromagnetic skin-depth and thus the depth being effectively probed by eddy currents, giving higher sensitivity to shallower surface defects. In addition to improved measurement resolution, this enables detection of defects at a much earlier stage of growth. Target defects include fatigue cracks, stress corrosion cracking or even inclusions that may effectively present themselves as surface breaking cracks. The ability to improve early stage
detection and increase sensitivity to smaller defects is a key industrial requirement that fits in with the strategic priorities of industry [1]. In industrial use, eddy current sensor stand-off is likely to vary, but if care is taken this can be controlled to a large extent, but cannot be completely avoided. Strategies exist for measuring and hence compensating for stand-off by using a measurement of coil inductance for example [4], but this paper will focus on the performance of the high frequency eddy current sensor in well controlled conditions.
Methodology
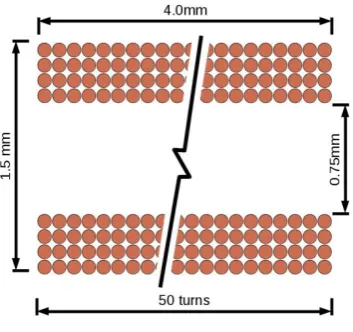
Figure 1 Schematic cross sectional diagram with dimensions of one of the solenoid type, eddy current coils used in the experiments.
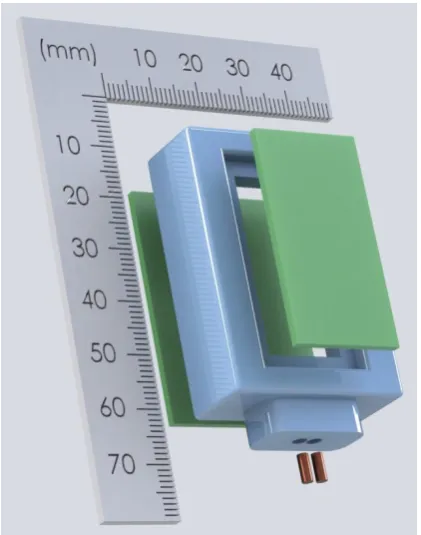
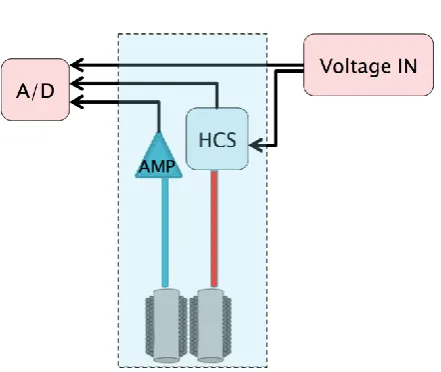
Whilst using the HCS is not the only viable way of driving the eddy current coil, one of the advantages of the HCS is that it is easy to program a constant amplitude current from a constant amplitude voltage drive; being able to maintain a constant current regardless of coil proximity to sample can help to make the analysis more straightforward in general, for this and for other eddy current methods. The electronic circuit is located directly behind the coil within the sensor housing, but is sufficiently far enough away from the sample and coils to ensure that the dominant interaction is between the coil and sample as shown in the schematic diagram and photograph of figure 2. In future research, other types of driving circuit will be used to drive the coils, but the HCS has provided us with a quick and efficient route to demonstrate the improved performance in the signal to noise ratio of eddy current scanning by eliminating long cables to the coils. A schematic diagram of the sensor arrangement and connections to an arbitrary function generator voltage and digital oscilloscope is shown in figure 3. Note that for an industrial prototype system, both the function generator and the oscilloscope could be replaced by a dedicated, smaller, lower cost and compact system.
Figure 2 Schematic diagram of sensor head components that are contained within the sensor body shown as the box with the dashed lines.
[image:5.595.193.404.370.638.2]Results
All of the following results are taken using the two solenoid eddy current coils in a transmit-receive set-up, where a constant amplitude sinusoidal current waveform is driven through the generating coil and a second coil in close proximity to the driven coil is used to detect magnetic fields arising from the driven coil and the eddy current induced in the sample under test.
Some simple experiments have been performed to demonstrate the improved signal to noise
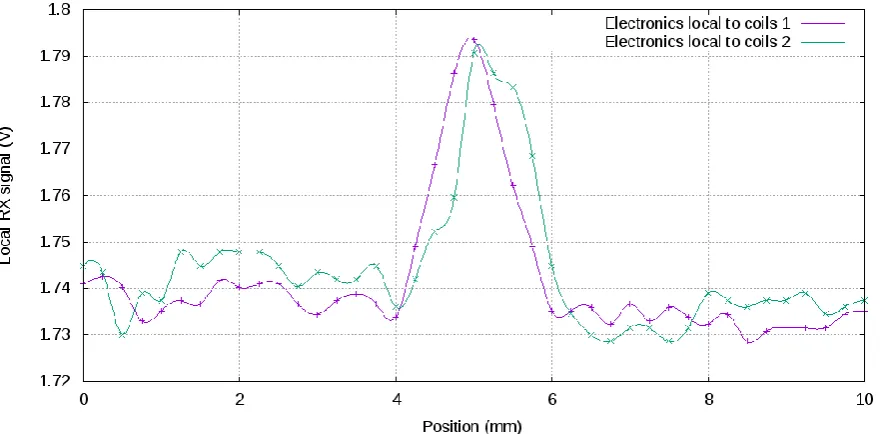
performance of this arrangement. To try to keep to keep the comparison of the advantage of locating the eddy current electronics in the probe housing, the same coils were used in the same housing. In the first case, the schematic arrangement of figure 2 was used, except that coaxial cables of length 1 m were used to connect the amplifier and the HCS to the sensor coils, with the amplifier and HCS enclosed in electrically screened housings. In the second case, the eddy current sensor was used as shown in figure 3, with the amplifier and HCS connected to the coils via short, fixed lengths (~2cm) of twisted pair wires, all contained within the same physical housing. For each of these two
arrangements, the sensor was driven at 15 MHz using a constant amplitude sinusoidal current ( 40 mA RMS) and scanned in a line across a sample of stainless steel containing a laser micro-machined slot of depth 0.1 mm, gape 0.1 mm and length 0.7 mm, as shown in the photograph of figure 4. The resulting line scans from 3 repeated manual measurements are shown in figure 5 for the electronics remote from the coils and in figure 6 for the electronics contained in the eddy current sensor.
FIGURE 4
Schematic diagram of high frequency eddy current sensor system. The components within the shaded box with the dotted outline are within the eddy current sensor housing, with the HCS connected to the coil by a short length of twisted pair wires.0.7 mm
0.1 mm
[image:7.595.172.393.94.280.2]Figure 5 Scans taken with the electronics distant from the solenoid coils.
Figure 6 Scans taken with the electronics local to the solenoid coils.
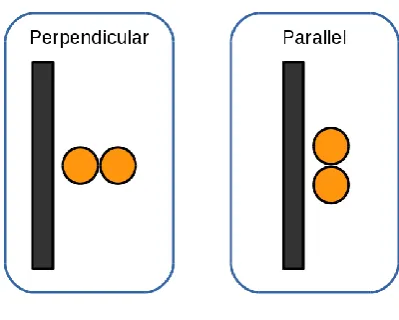
[image:8.595.76.519.363.580.2]Figure 7 Schematic diagram of two examples of eddy current coil orientation relative to the
machined slots in the 3 mm thick stainless steel sample, designated as "perpendicular" and "parallel".
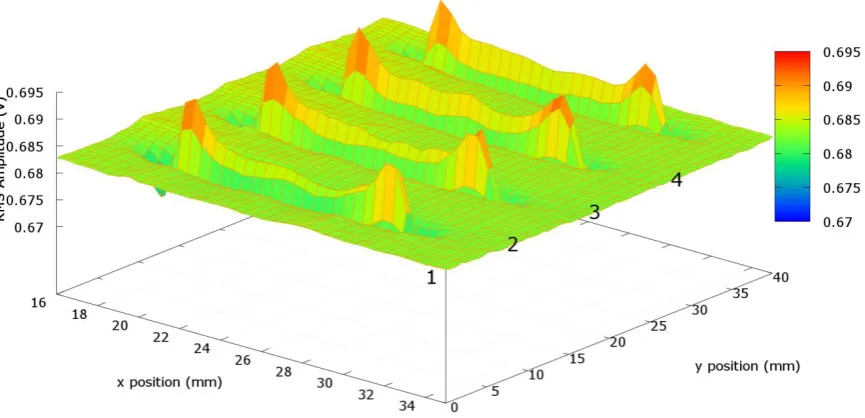
The resulting scans are shown in figure 8 and 9, where the slots are labelled 1-4, corresponding to the widest to the lowest gape. The reader should note that for clarity, the amplitude of the z-axis has been inverted on figure 8, as when either the detector or generator coils are over the slot, the signal on the detector decreases. On figure 9, where the coils are in the parallel orientation, there is again a drop in signal where only either one of the coils is over the slot, but when both coils are over the slot, the signal detected on the receive coil increases. Ignoring the smoothly changing background signal and considering only the signal amplitudes in the local region of the defect, the average signal to noise ratio obtained on each machined slot is 19.7dB in the perpendicular orientation and 25.4dB in the parallel direction.
Figure 8 - Scans of slots in metal with eddy current coils in the perpendicular orientation. Note that the z-axis is inverted to make the result clearer to see in this projection. As either the receive or transmit coil passes over the slot the signal amplitude on the receive coil decreases. The signal to noise ratio around the defect is 19.7 dB.
Figure 9 - Scans of slots in metal with eddy current coils in the parallel orientation. As either only the receive or transmit coil passes over the slot the signal amplitude on the receive coil drops. When both coils are over the slot, the signal amplitude on the receive coil increases. The signal to noise ratio around the defect is 25.4 dB.
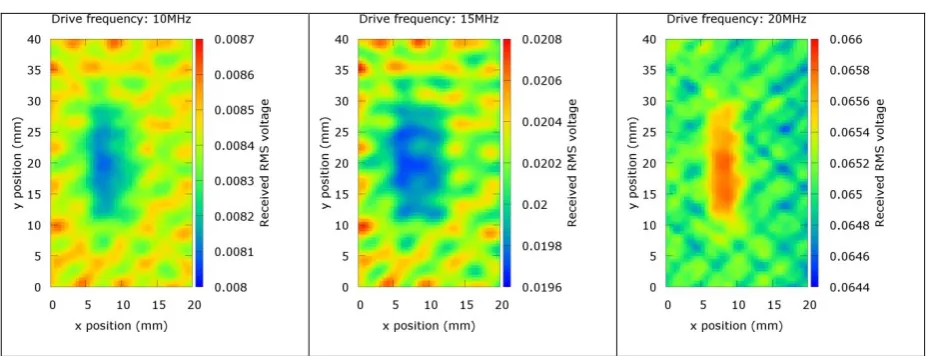
[image:10.595.85.518.411.620.2]its deepest point. The sample and machined slot are shown schematically in figure 10. Carbon fibre composite was chosen because of its low electrical conductivity, and relatively large skin depth. The particular sample tested consisted of woven carbon fibres, laid down in a hexagonal pattern. This time, the eddy current sensor was operated at 10 MHz, 15 MHz and 20 MHz in the parallel configuration, scanned using an XY table across an area of 20 mm 40 mm of the sample. The results of the eddy current C-scans are shown in figure 11.
Figure 10 – Schematic cross-section of carbon fibre composite specimen showing defect dimensions.
Figure 11 - Eddy current sensor C-scans of the carbon fibre sample at 10MHz, 15MHz and 20MHz. The calculated signal to noise ratios are 19.4dB, 20.0dB and 24.8dB respectively.
Conclusions
By integrating suitable electronics close to an eddy-current coil, it is possible to perform
[image:11.595.66.532.411.589.2]surroundings. The high frequency sensor has been used to detect small surface crack like features on a carbon fibre composite sample, where the pattern due to the fibre weave can also be seen on the scan.
Future developments will include testing different type of eddy current circuits integrated into the sensor housing, and operating the HCS design to higher frequencies to reduce the skindepth further, giving increased sensitivity to shallower defects.
Acknowledgements
This research was partly the result of funding and support from a 3 month feasibility project funded by the UK Research Centre for NDE and EPSRC (Grant EP/L022125/1), with additional support provided by the University of Warwick.
References
[1] A. K. Dunhill, P. J. Thayer and K. Newton, “The advantages and challenges of linking industrial needs with academic research,” INSIGHT, vol. 53, no. 1, pp. 12-15, January 2011.
[2] B. Bleaney and B. Bleaney, Electricity and Magnetism, Oxford: Clarendon Press, 1965.
[3] D. W. Dodd C.V., “Analytical Solutions to Eddy-Current Probe-Coil Problems,” Journal of Applied Physics, vol. 39, no. 6, pp. 2829-2838, May 1968.