A noticeable problem in agriculture in European countries is the worsening sulphur (S) deficiency caused by an extreme tightening of environmen-tal standards at the end of the last century. In Poland in 2010 as many as 94% of profiles tested were classified as low in S (< 16.5 mg SO42–/kg, Klikocka et al. 2015). This situation raises the concern that the NPK fertilizer generally applied will not be balanced, and the S deficiency may reduce utilization of the remaining components, primarily nitrogen (N).
N and S are both important constituents of pro-tein, and adequate supplies of both nutrients are important for optimum crop yield (Klikocka and Cybulska 2014, Dostálová et al. 2015). S and N nutrition interact at many levels, as the uptake and assimilation of NO3 and SO42– have much in
common, and there are many common products of N and S metabolism (Pilbeam 2015). S-deficient plants accumulate arginine and asparagine in par-ticular, but have lower levels of the S-containing amino acids cysteine and methionine (Hesse et al. 2004). Accumulation of asparagine in wheat grains under S deficiency increases the risk of formation of acrylamide when flour products are cooked (Halford et al. 2012). Some of the inter-action between N and S metabolism comes from o-acetylserine, the immediate precursor of cysteine that does not itself contain S. For assimilation of sulphate to occur, plants must contain adequate levels of this precursor, and as an amino acid its concentration is dependent on N nutrition (Hesse et al. 2004). Sulphur is an important com-ponent of protein in wheat, being a constituent of
The effect of sulphur and nitrogen fertilization on grain yield
and technological quality of spring wheat
H. Klikocka
1, M. Cybulska
1, B. Barczak
2, B. Narolski
1, B. Szostak
3, A. Kobiałka
1,
A. Nowak
1, E. Wójcik
11
Faculty of Agrobioengineering, University of Life Science in Lublin, Lublin, Poland
2Faculty of Agriculture and Biotechnology, UTP University Science and Technology
Bydgoszcz, Bydgoszcz, Poland
3
Institute of Animal Nutrition and Bromatology, Faculty of Biology and Animal
Breeding, University of Life Science in Lublin, Lublin, Poland
ABSTRACT
The aim of the study was to evaluate the effect of nitrogen (N) and sulphur (S) fertilizer on grain yield of spring wheat and its technological quality. A field experiment (2009–2011) was conducted in south-eastern Poland on Cambisols. The experiment included 2 factors: N fertilization (0, 40, 80, 120 kg/ha) and S fertilization (0, 50 kg/ha). The experiment showed that spring wheat cv. Tybalt exhibited a positive reaction of N and S fertilization on grain yield, which was the highest at the application of 80 kg N/ha (5.40 t/ha), increasing by 1.30 t/ha (13.1%) with re-spect to the control. S fertilization increased grain yield by 3.58%. S application increased significantly the content of gluten by 3.2%, cysteine by 6.0% and methionine by 16.5%. The most beneficial effect on the content of N, S, total protein, gluten, cysteine and methionine was observed for N application a rate of 80 kg/ha and for S at a rate of 50 kg/ha. Positive correlation was found between the content of S in grain and grain yield (r = 0.73). Significant cor-relations were found also between grain yield and all other quality characteristics except for N and starch content.
SH-containing amino acids that enhance the quality of protein for baking (Zhao et al. 1999). Interchain disulphide bonds formed by the S-rich subunits of the gliadins and glutenins that comprise gluten influence the elasticity of dough by stabilizing the polymer network formed by gluten molecules (Shewry et al. 2002). If the S supply is low relative to the N supply, content of S-poor proteins such as ω-gliadins increases while that of S-rich pro-teins such as γ-gliadins and low-molecular-weight subunits of glutenin decreases (Tea et al. 2007).
The aim of the study was to evaluate the effect of N and S fertilizer on grain yield of spring wheat and its chemical and technological quality.
MATERIAL AND METHODS
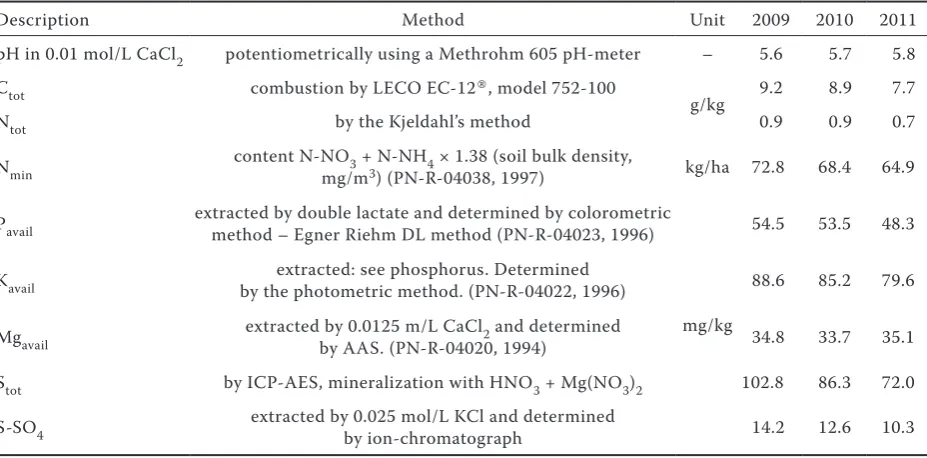
A field experiment was carried out in 2009–2011 in Malice, in south-eastern Poland (50°42'N, 23°15'E), in a randomized split-plot design (with four replica-tions) on Cambisols (WRB 2007) consisting of light silty sand (sand 68%, silt 31%, clay 1%). The soil was slightly acidic (pH = 5.6), with high available phos-phorus (P) content, medium content of potassium (K) and magnesium (Mg), and low S content (Table 1).
The precipitation and air temperature during the growing season (March–August) in 2009–2011 are presented in Table 2. On the basis of meteorologi-cal data Selyaninov’s hydrothermal coefficient was
calculated. The 2009 growing season was classified as rather dry, bordering on optimal (1.3), while the 2010 and 2011 seasons were optimal, bordering on rather wet (1.6).
The subject of the experiment was the cv. Tybalt of spring wheat (Triticum aestivum L.) fertilized with different levels of N and S, which gave 8 combinations: 0N-0S; 40N-0S; 80N-0S; 120N-0S; 0N-50S; 40N-50S; 80N-50S and 120N-50S. Schema for rates of N and S and time of application pre-sented Table 3. The area of each plot was 30 m2 (5 m × 6 m). Before sowing, P (as 17.4% granular triple superphosphate at 39.6 kg P/ha) and K (as 49.8% potassium salt at 83 kg K/ha) fertilizers were applied. N fertilizer was applied in the form of 34% ammonium nitrate (NH4NO3). S was ap-plied first before sowing (40 kg S/ha) in the form of kieserite – MgSO4 • H2O (as 15.1% Mg, 20.0% S), followed by foliar application of 10 kg S/ha in the form of magnesium sulphate heptahydrate (MgSO4 • 7 H2O) (10.2% Mg, 12.8% S or 32% SO3) (3.2% SO3 solution (in 100 L of water) per 300 L water per ha). The soil in the plots was balanced depending on pH and on Mg applied in the form of kieserite and magnesium sulphate heptahydrate using Mg lime and Ca carbonate.
[image:2.595.66.530.528.757.2]Spring wheat was sown in an amount ensuring a density of 500 plants per m2. Sowing was carried out between 28 March and 5 April, depending on the year. A mixture of the herbicides Granstar 75
Table 1. Chemical characteristics of soil (spring before sowing, layer 0–25 cm)
Description Method Unit 2009 2010 2011
pH in 0.01 mol/L CaCl2 potentiometrically using a Methrohm 605 pH-meter – 5.6 5.7 5.8 Ctot combustion by LECO EC-12®, model 752-100
g/kg 9.2 8.9 7.7
Ntot by the Kjeldahl’s method 0.9 0.9 0.7
Nmin content N-NO3 + N-NH4 × 1.38 (soil bulk density,
mg/m3) (PN-R-04038, 1997) kg/ha 72.8 68.4 64.9
Pavail extracted by double lactate and determined by colorometric method – Egner Riehm DL method (PN-R-04023, 1996)
mg/kg
54.5 53.5 48.3
Kavail by the photometric method. (PN-R-04022, 1996)extracted: see phosphorus. Determined 88.6 85.2 79.6
Mgavail extracted by 0.0125 m/L CaCl2 and determined
by AAS. (PN-R-04020, 1994) 34.8 33.7 35.1 Stot by ICP-AES, mineralization with HNO3 + Mg(NO3)2 102.8 86.3 72.0
WG (tribenuron-methyl) (20 g/ha) and Puma Super 069 EW (fenoxaprop-P-ethyl) (1 L/ha) was used at 28 BBCH stage. For fungi prevention Alert 375 SC (flusilazole + carbendazim – 1 L/ha) was applied at 30–32 BBCH stage and Tilt CB 37.5 (propiconazole + carbendazim – 1 L/ha) at 58–59 BBCH stage. The insecticide Decis 2.5 EC (deltamethrin) was ap-plied at 0.25 L/ha at 58–59 BBCH stage.
Grain yield (at 11% moisture content) was calcu-lated after the harvest (92 BBCH) from each plot. In dry matter (DM) of grain the content of total N and total S (g/kg DM) was determined with a LECO CNS-2000 analyser (Leco Corp., USA). Content of S was determined by infrared spectrometry (DIN ISO 15178, 2001) and N in a differential thermal conductivity detector (DIN ISO 13878, 1998). Content of S-containing protein amino acids (cysteine and methionine) was determined by the HPLC method in an INGOS AAA 400 amino acid analyser (LECO Corp., USA). Gluten and starch content in the grain were determined by near-infrared spectroscopy with a Perten Instruments Inframatic 9200 grain analyser (LECO Corp., USA). Total protein content in the grain was calculated as 5.7 × N content (Zhao et al. 1999).
Analysis of variance was performed by the Snedecor’s F-test. Significance of differences was calculated using the Tukey’s test (P = 0.05) fol-lowed by post-hoc analysis. The statistical software Excel 7.0 (Microsoft Office 2007 PL) and Statistica (StatSoft Polska’97) were used for the analysis.
RESULTS AND DISCUSSION
Analysis of the results showed a significant beneficial effect of N and S fertilizer on the grain yield of spring wheat and on most of the qual-ity characteristics of the grain. For grain yield and studied characteristics no interaction was found between increasing application rates of N and S. However, the addition of sulphur to each dose of nitrogen, independently increased yield and a number of other features. This type of yield-increasing factor, in this case fertilizer, signals the additive effect of S. This type of re-action is manifested in conditions in which the deficiency of the nutrient is small, which is con-sistent with the law of diminishing returns, also known as Mitscherlich’s law (Grzebisz 2009). In general the additive interaction of the nutrients is manifested when there is a constant increase in weight (or yield) as a result of application of the second factor.
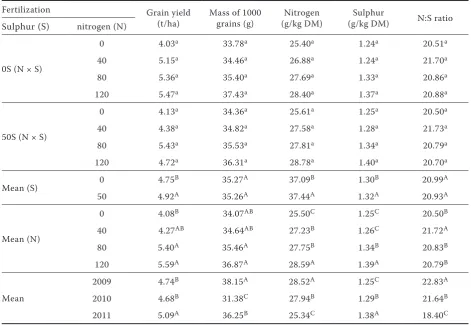
[image:3.595.65.531.126.231.2]Grain yield was the highest following the ap-plication of 80 kg N/ha (5.40 t/ha), increasing by 1.30 t/ha (13.1%) with respect to the control, as well as in the case of 120 kg N/ha, although this was not a statistically significant increase. The 1000-grain weight increased proportionally as the N application rate increased. The content of N and S in the spring wheat grain significantly increased in direct proportion to the increase in
Table 2. Sums of rainfall (mm) and mean air temperature (oC) in the years 2009–2011 and in the long-term
period 1971–2005 (Zamość Research Station, Poland)
Month (k) Sum–mean (III–VIII)
III IV V VI VII VIII k p t
2009 5.3 0.5 2.4 2.1 0.4 0.8 1.3 349.1 2652
2010 1.8 1.1 2.0 1.1 2.1 1.3 1.6 443.4 2715
2011 1.2 1.1 0.7 1.0 2.7 2.3 1.6 414.6 2581
1971–2005 5.1 1.8 1.5 1.6 1.7 1.0 1.6 367.4 2353
p – precipitation (mm); t – temperature (°C); k – Selyaninov’s hydrothermal coefficient [k = (p × 10)/∑t)
Table 3. Schema for rates of nitrogen and sulphur
Element (kg/ha)Rate
Time of application before
sowing 30–31 BBCH 55–59 BBCH
Nitrogen
0 – – –
40 40 – –
80 40 40 –
120 40 40 40
[image:3.595.64.291.630.755.2]the N application rate and was the highest fol-lowing the application of 120 kg N/ha (N – 28.59 and S – 1.39 g/kg DM). As the N application rate increased, the N:S ratio was similar in the case of the control and 80 kg N/ha and 120 kg N/ha, but at 40 kg N/ha it increased from an average of 20.71 to 21.72 (Table 4).
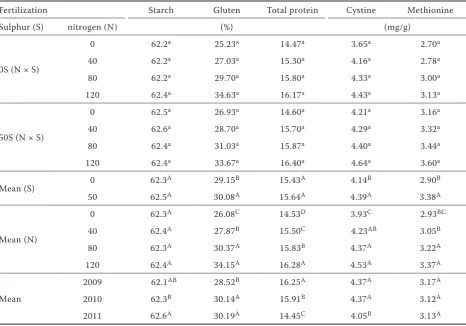
Gluten content increased in direct proportion as the N application rate increased, and was highest following the application of 120 kg N/ha (34.15%). A similar response was noted for the content of total protein, with the greatest increases observed following the application of 80 kg N/ha and 120 kg N/ha (15.83% and 16.28%). Cysteine content in the grain increased significantly following the applica-tion of N at a rate of 80 kg/ha, and cysteine content following the application at the rate of 40 kg/ha, and they continued to increase proportionally up to the highest rate of N application. N fertilization did not affect starch content in grain (Table 5).
The literature devotes much attention to the issue of N fertilization of quality wheat and its effect on grain yield and technological value (Pilbeam 2015). Much less emphasis is placed on fertilization with other mineral nutrients, including S (Zhao et al. 1999). Grain S concentrations lower than 1.2 mg/g and grain N:S ratio higher than 17:1 appear to be critical values for S deficiency with regard to yield (Randall et al. 1981).
Fertilization with S improved the grain yield-increasing effect of NPK by 3.58%. In the case of 1000-grain weight, no effect was noted (Table 4). In a study by Podleśna (2013), S fertilization of winter wheat at a rate of 60 kg S/ha led to an in-crease in grain yield of 11%, while wheat plants with limited of S-SO4 in the soil showed a reduc-tion in 1000-grain weight.
[image:4.595.62.534.113.438.2]The content of N and S in the grain following application of sulphur at a rate of 50 kg/ha in-creased by 1.3% and 1.5% in comparison with
Table 4. Yield of grain of spring wheat, thousand-grain weight and nitrogen and sulphur content
Fertilization Grain yield
(t/ha) Mass of 1000 grains (g) (g/kg DM)Nitrogen (g/kg DM)Sulphur N:S ratio Sulphur (S) nitrogen (N)
0S (N × S)
0 4.03a 33.78a 25.40a 1.24a 20.51a 40 5.15a 34.46a 26.88a 1.24a 21.70a 80 5.36a 35.40a 27.69a 1.33a 20.86a 120 5.47a 37.43a 28.40a 1.37a 20.88a
50S (N × S)
0 4.13a 34.36a 25.61a 1.25a 20.50a 40 4.38a 34.82a 27.58a 1.28a 21.73a 80 5.43a 35.53a 27.81a 1.34a 20.79a 120 4.72a 36.31a 28.78a 1.40a 20.70a
Mean (S) 0 4.75
B 35.27A 37.09B 1.30B 20.99A
50 4.92A 35.26A 37.44A 1.32A 20.93A
Mean (N)
0 4.08B 34.07AB 25.50C 1.25C 20.50B 40 4.27AB 34.64AB 27.23B 1.26C 21.72A 80 5.40A 35.46A 27.75B 1.34B 20.83B 120 5.59A 36.87A 28.59A 1.39A 20.79B
Mean
2009 4.74B 38.15A 28.52A 1.25C 22.83A 2010 4.68B 31.38C 27.94B 1.29B 21.64B 2011 5.09A 36.25B 25.34C 1.38A 18.40C
the control, respectively. S fertilization did not
[image:5.595.65.532.113.439.2]significantly affect the N:S ratios calculated for the grain, but they were decreased by the application of S (Table 4). The grain quality in the present
Table 5. The quality characteristic of grain of spring wheat
Fertilization Starch Gluten Total protein Cystine Methionine
Sulphur (S) nitrogen (N) (%) (mg/g)
0S (N × S)
0 62.2a 25.23a 14.47a 3.65a 2.70a
40 62.2a 27.03a 15.30a 4.16a 2.78a
80 62.2a 29.70a 15.80a 4.33a 3.00a
120 62.4a 34.63a 16.17a 4.43a 3.13a
50S (N × S)
0 62.5a 26.93a 14.60a 4.21a 3.16a
40 62.6a 28.70a 15.70a 4.29a 3.32a
80 62.4a 31.03a 15.87a 4.40a 3.44a
120 62.4a 33.67a 16.40a 4.64a 3.60a
Mean (S) 0 62.3
A 29.15B 15.43A 4.14B 2.90B
50 62.5A 30.08A 15.64A 4.39A 3.38A
Mean (N)
0 62.3A 26.08C 14.53D 3.93C 2.93BC
40 62.4A 27.87B 15.50C 4.23AB 3.05B
80 62.3A 30.37A 15.83B 4.37A 3.22A
120 62.4A 34.15A 16.28A 4.53A 3.37A
Mean
2009 62.1AB 28.52B 16.25A 4.37A 3.17A 2010 62.3B 30.14A 15.91B 4.37A 3.12A 2011 62.6A 30.19A 14.45C 4.05B 3.13A
Values with different letters in the column differ significantly (P < 0.05) between: a – N x S; A – 0S – 50S; A – 0N-40N-80-N-120N; A – 2009-2010-2011; DM – dry matter
Table 6.Correlation coefficients between grain yield and grain quality characteristics
Features (n = 24) No 2 3 4 5 6 7 8 9 10
Grain yield 1 0.328 0.331 0.730 –0.257 0.007 0.813 0.449 0.478 0.497 1000-grain weight 2 – 0.152 0.128 0.017 –0.035 0.096 0.039 0.100 0.068 Nitrogen 3 – – –0.085 0.727 –0.315 0.414 1.000 0.767 0.359 Sulphur 4 – – – –0.707 0.379 0.764 0.123 0.211 0.371 N:S ratio 5 – – – – –0.463 –0.205 0.763 0.401 –0.005
Starch 6 – – – – – 0.106 –0.341 –0.085 0.402
Gluten 7 – – – – – – 0.414 0.589 0.428
Total protein 8 – – – – – – – 0.766 0.358
Cysteine 9 – – – – – – – – 0.609
Methionine 10 – – – – – – – – –
[image:5.595.66.532.550.741.2]study was improved by the application of S in the fertilizer. Only starch and total protein content were not dependent on S application, although there was a positive response. Following applica-tion of S after NPK fertilizer the content of gluten increased significantly by 3.2%, cysteine by 6.0% and methionine by as much as 16.5% (Table 5). In a study by Podleśna et al. (2003), S fertilization of winter wheat at a rate of 60 kg S/ha led to an increase in the content of protein (by 1%) and of gluten in the grain (by 2%). However, Randall et al. (1981) reported that an increase in applied S may increase, decrease or have no effect on pro-tein content, depending on the grain S status and the N supply.
Analysis of the effect of S with increasing ap-plication rates of N revealed that despite the lack of statistically confirmed interactions, the most favourable values for the qualitative grain charac-teristics studied were found in the case of the com-bination of N applied at 80 and 120 kg N/ha with S applied at 50 kg S/ha. It should also be noted that these increases following N application at 120 kg N/ha with respect to lower application rates were less favourable than in the case of 80 kg N/ha with respect to 40 kg N/ha. This phenomenon can be explained by the law of diminishing returns (Mitscherlich’s law) (Grzebisz 2009).
The grain yield and grain quality characteristics were modified by the weather. In the case of grain yield and content of S, gluten, starch and methionine, the weather conditions in 2011 (rather wet) were the most favourable. In 2009 (rather dry) the meteoro-logical conditions during the growing period of the spring wheat had a significant beneficial effect on 1000-grain weight, accumulation of N, total protein and cysteine. The relationships described were con-firmed in a study by Woźniak and Staniszewski (2007), which showed that lower values for the hydrother-mal index (lower precipitation sum and higher air temperature sum) were conducive to higher content of protein and gluten in the wheat grain.
Significant positive correlations were found between the grain yield of spring wheat and all other quality characteristics of the grain, with the exception of starch content. The highest correlation coefficient was obtained between grain yield and content of gluten, S, total protein, cysteine and methionine. More significant positive correlations were found between the quality characteristics of the grain (Table 6).
According to Inal et al. (2003), positive correla-tions between the S application rate and its content in the plant indicate only slight redistribution of this nutrient from the soil to the plant, as sulphates in the soil may be unavailable. In the present study a correlation was found between the content of S in the spring wheat grain and grain yield. From this it can be concluded that the S was not subject to the dilution effect and its content was at the optimal level up to the end of the vegetation of the plants.
Because Polish and European agriculture is transitioning to an integrated production system, if it is taken into account that mineral fertiliza-tion should be applied below the uptake level, the treatment of 80 kg N/ha with 50 kg S/ha should be recommended in practice. The proposed N application rate and the high degree of N avail-ability in mineral form in the soil analysed (aver-age 68.7 kg/ha), as well as the anticipated supply from the atmosphere, will meet the demand of spring wheat for nitrogen.
REFERENCES
Dostálová Y., Hřivna L., Kotková B., Burešová I., Janečková M., Šottníková V. (2015): Effect of nitrogen and sulphur fertilization on the quality of barley protein. Plant, Soil and Environment, 61: 399–404.
Grzebisz W. (2009): Fertilization of Crops. Part II. Fertilisers and Fertilization Systems. The Basics of Fertilizing. Poznań, Polish Publisher Agricultural and Forestry, 376. (In Polish)
Halford N.G., Curtis T.Y., Muttucumaru N., Postles J., Elmore J.S., Mottram D.S. (2012): The acrylamide problem: A plant and agronomic science issue. Journal of Experimental Botany, 63: 2841–2851.
Hesse H., Nikiforova V., Gakiére B., Hoefgen R. (2004): Molecular analysis and control of cysteine biosynthesis: Integration of nitrogen and sulphur metabolism. Journal of Experimental Botany, 55: 1283–1292.
Inal A., Günes A., Alphaslan M., Adak M.S., Taban S., Eraslan F. (2003): Diagnosis of sulfur deficiency and effects of sulfur on yield and yield components of wheat grown in central Anatolia, Turkey. Journal of Plant Nutrition, 26: 1483–1498.
Klikocka H., Cybulska M. (2014): Sulphur and Nitrogen Fertiliza-tion of Spring Wheat. Mineral FertilizaFertiliza-tion of Spring Wheat. Sarrbrucken, LAP Lambert Academic Publishing, 122. Klikocka H., Wyłupek T., Narolski B. (2015): Sulphur content
Pilbeam D.J. (2015): Nitrogen. In: Barker A.V., Pilbeam D.J. (eds.): Handbook of Plant Nutrition. 2nd Ed. Boca Raton, London, New York, CRC Press Taylor and Francis Group, 17–63.
Podleśna A. (2013): Study on the Role of Sulphur in Shaping the Economy and Size and Quality of the Yield of Selected Crops. IUNG Puławy, Monografie i Rozprawy Naukowe, 37. (In Polish) Randall P.J., Spencer K., Freney J.R. (1981): Sulfur and nitrogen
fertilizer effects on wheat. I. Concentrations of sulfur and nitrogen and the nitrogen to sulfur ratio in the grain, in rela-tion to the yield response. Australian Journal of Agriculture Research, 32: 203–212.
Shewry P.R., Halford N.G., Belton P.S., Tatham A.S. (2002): The structure and properties of gluten: An elastic protein from wheat grain. Philosophical Transactions of the Royal Society B: Biological Sciences, 357: 133–142.
Corresponding author:
Prof. dr. hab. Hanna Klikocka, University of Life Sciences, Faculty of Agrobioengineering, Akademicka 13, 20 950 Lublin, Poland; e-mail: [email protected]
Tea I., Genter T., Naulet N., Lummerzheim M., Kleiber D. (2007): Interaction between nitrogen and sulfur by foliar application and its effects on flour bread-making quality. Journal of the Science of Food and Agriculture, 87: 2853–2859.
Woźniak A., Staniszewski M. (2007): The influence of weather conditions on the quality of the technology of spring wheat (cultivar Opatka) and winter wheat (cultivar Korweta). Acta Agrophysica, 9: 525–540. (In Polish)
Zhao F.-J., Salmon S.E., Withers P.J.A., Evans E.J., Monaghan J.M., Shewry P.R., McGrath S.P. (1999): Responses of breadmaking quality to sulphur in three wheat varieties. Journal of the Sci-ence of Food and Agriculture, 79: 1865–1874.