IMPACT OF MAIZE FARM-GATE PRICE ON FOOD SECURITY IN LUDEWA DISTRICT OF
NJOMBE REGION, TANZANIA: ESTIMATION OF THE LOGIT MODEL
Agricultural and Resource Economist, Economics and Commerce
College of Education
ARTICLE INFO ABSTRACT
Tanzania is one of the countries where the problem of food insecurity has been prominent to poor rural households. Due to this, Tanzania supports the second target of Sustainable Development Goals of eradicating hunger. Mostly, Tanzania target on maize fo
maize has been equated to food shortage.
has been put in analysing the relationship between expected farm security. Thus
and rural household food security in Ludewa district of Njombe region Among others, the main
farm household food security.
maize production. Thus, the study recommends measures that will increase motivating more production w
Copyright © 2018, Mirau Mbise. This is an open access distribution, and reproduction in any medium, provided
INTRODUCTION
The concepts and definitions of food security and insecurity have been discussed for a long period of time. Since its inception, it is defined in different ways by international organizations and researchers and there close to 200 definitions (Blessing et al., 2013). Blessing et al. (2013) revealed that the most acceptable definition is the one forwarded by World Food Summit in 1996 which establish that Food security exists when all people at all times, have physical and economic access to sufficient, safe and nutritious food to meet their dietary needs and food preferences for an active and healthy life’ security is a grown concern worldwide (Abafita and Kim, 2012). About 842 million people (i.e., equivalent to one in eight people) in the world were estimated to be suffering from chronic hunger in 2011–2013 of which, 827 million resided in developing regions (United Nations, 2014). This is in line with Aidoo et al. (2013) who states that the majority of the world’s poorest countries are in Africa and most of these face persistent poverty and food insecurity. For Sub
Africa, while the overall significant progress is registered towards the second Sustainable Development Goal, it remains
ISSN: 0975-833X
Article History:
Received 24th March, 2018 Received in revised form 09th April, 2018 Accepted 26th May, 2018 Published online 28th June, 2018
Citation: Mirau Mbise, 2018. “Impact of maize farm model”, International Journal of Current Research, 10
Key words:
Njombe, Maize, Production, Transaction Costs, Agriculture,
Marketing, Logit Model.
*Corresponding author
RESEARCH ARTICLE
GATE PRICE ON FOOD SECURITY IN LUDEWA DISTRICT OF
NJOMBE REGION, TANZANIA: ESTIMATION OF THE LOGIT MODEL
*
Dr. Mirau Mbise
Agricultural and Resource Economist, Economics and Commerce Department, Mkwawa University
College of Education – P.O. Box 2513, Iringa, Tanzania
ABSTRACT
Tanzania is one of the countries where the problem of food insecurity has been prominent to poor rural households. Due to this, Tanzania supports the second target of Sustainable Development Goals of eradicating hunger. Mostly, Tanzania target on maize for food security; traditionally, shortage of maize has been equated to food shortage. Although many studies have been carried out
has been put in analysing the relationship between expected
farm-security. Thus, this study intends to estimate the relationship between expected maize farm and rural household food security in Ludewa district of Njombe region
Among others, the main results indicated that farm-gate price has the
farm household food security. This leads to conclusion that farm-gate price is important for increased maize production. Thus, the study recommends measures that will increase
motivating more production while ensuring the only surplus is sold.
access article distributed under the Creative Commons Attribution License, the original work is properly cited.
The concepts and definitions of food security and insecurity have been discussed for a long period of time. Since its inception, it is defined in different ways by international organizations and researchers and there close to 200 definitions (2013) revealed that the most acceptable definition is the one forwarded by World Food Food security exists when all people at all times, have physical and economic access to and nutritious food to meet their dietary needs and food preferences for an active and healthy life’. Food security is a grown concern worldwide (Abafita and Kim, 2012). About 842 million people (i.e., equivalent to one in stimated to be suffering from 2013 of which, 827 million resided in developing regions (United Nations, 2014). This is in line with (2013) who states that the majority of the world’s ost of these face persistent poverty and food insecurity. For Sub-Saharan Africa, while the overall significant progress is registered towards the second Sustainable Development Goal, it remains
the region with the highest occurrence of undernourishment (IFAD et al., 2013). In particular, Tanzania is one of the poorest countries in the world which food production has remained low, failing to meet household and national requirements (Runyoro, 2006 cited in Kiratu
Food Insecurity in Tanzania
challenges in ensuring food security
insecurity in Tanzania is both transitory and chronic in nature (URT, 2006). In Tanzania, food insecurity
prevalent among poor rural households (Amani, 2004). Food insecurity also manifest in the nutrition status of children. By year, 2010, 22% of children in Tanzania were underweight at the age of 5. Also, generally, 30% of Tanzanians were li below the poverty line (Nazir et al
A national assessment of food insecurity in Tanzania conducted by Oxfam in January 2010 identified four key vulnerable groups:
Poor households in urban and rural areas that are reliant upon the market for most of their food requirements;
International Journal of Current Research
Vol. 10, Issue, 06, pp.70229-70235, June, 2018
Impact of maize farm-gate price on food security in Ludewa district of Njombe region, Tanzania: Estimation of the logit 10, (06), 70229-70235.
GATE PRICE ON FOOD SECURITY IN LUDEWA DISTRICT OF
NJOMBE REGION, TANZANIA: ESTIMATION OF THE LOGIT MODEL
, Mkwawa University
Tanzania is one of the countries where the problem of food insecurity has been prominent to poor rural households. Due to this, Tanzania supports the second target of Sustainable Development Goals r food security; traditionally, shortage of many studies have been carried out, less weight -gate price and farm household food , this study intends to estimate the relationship between expected maize farm-gate price and rural household food security in Ludewa district of Njombe region-Tanzania using logit model. gate price has the negative significant effect on gate price is important for increased maize production. Thus, the study recommends measures that will increase producer price for
hile ensuring the only surplus is sold.
License, which permits unrestricted use,
the region with the highest occurrence of undernourishment ., 2013). In particular, Tanzania is one of the poorest countries in the world which food production has remained low, failing to meet household and national
cited in Kiratu et al., 2011).
Food Insecurity in Tanzania: Tanzania faces profound challenges in ensuring food security (Bese et al., 2009). Food insecurity in Tanzania is both transitory and chronic in nature (URT, 2006). In Tanzania, food insecurity has been more of prevalent among poor rural households (Amani, 2004). Food insecurity also manifest in the nutrition status of children. By year, 2010, 22% of children in Tanzania were underweight at the age of 5. Also, generally, 30% of Tanzanians were living
et al., 2010).
A national assessment of food insecurity in Tanzania conducted by Oxfam in January 2010 identified four key
households in urban and rural areas that are reliant upon the market for most of their food requirements;
INTERNATIONAL JOURNAL OF CURRENT RESEARCH
Marginal producers who are not capable of producing enough food to meet their daily needs;
Farmers whose crop production has been affected by specific diseases (such as cassava mosaic and banana wilt); and
Pastoralists subject to repeated drought and diminishing herd size.
The most rapid increase in chronic hunger in Tanzania occurred between 2003 and 2005 and 2007. According to FAO’s “provisional estimates, 75 million more people were added to the total number of undernourished in 2007 compared to 2003–05” (Ghanem, 2008). One of the strategies to reduce food insecurity is to involve rural households to produce more food and cash crops so that they could feed their families and at the same time earn cash for non-food needs. Therefore, progress in reducing food insecurity and malnutrition in Tanzania depends greatly on the performance of the agricultural sector (Amani, 2004). As informed by Nazir et al., 2010), the government needs to have sound policies for all people to have physical and economic access to sufficient food to meet their dietary needs for a productive and healthy life.
Importance of Maize to Food Security in Tanzania: Maize is an important food crop not only because it is consumed worldwide, but also it has nutritive value. Currently, maize is the first popular food in Tanzania in terms of caloric intake (Nazir et al., 2010). Maize provides more carbohydrates than wheat and sorghum; and, it is a good source of phosphorus and it also contains small amounts of calcium, iron, thiamine, niacin, and fat (Mboya et al., 2011). Furthermore, maize has high yield per unit compared to other crops and this justifies its importance in the supplyof food and promoting food security in the country (FAO, 2008). In several developing countries including Sub-Saharan countries, maize supply is linked to food security: Also, Njukia (2006) reports that where there is NO Maize there is NO Food.
For the Tanzania case, the availability of maize has been equated to national food security, and lack of food has been equated to low supply of maize (Mwakalinga and Massawe, 2007). Usually, maize serves as a staple food preferred by Tanzanians and throughout the East African Countries. Due to its importance, maize has been traditionally linked to politics and subjected to trade restrictions and protectionism (USAID, 2010). In Tanzania, maize influences food security via two different channels: one is through consumption because it is an important component of the nation’s caloric intake. The other is, through production because it is an income-generating activity. In 2001, maize produced in Tanzania accounted for about 33% of the recommended daily caloric intake. In 2010, maize produced accounted for 43% of the recommended daily caloric intake (Table 1).In 2017, United States Department of Agriculture revealed that maize provides 60% of dietary calories and more than 35% of utilizable protein to the Tanzanian population. Maize makes up a considerably larger proportion of food consumed in Tanzania than it does in Kenya and Uganda (although in 2001 Kenya surpassed Tanzania).
Justification, Gap, and Objective of the Study: Although revitalisation of agricultural sector is a precondition for achieving high and sustainable economic growth, poverty reduction, and food security, strategies undertaken to revamp the sector’s performance, e.g., the Kilimo Kwanza Policy (meaning Agriculture First Policy), give little or no
recognition to transaction costs in crop marketing occasioned by structural factors that impede development and transformation of agriculture in Tanzania. As a result, as noted by Agricultural Council of Tanzania (ACT) (2010), the potential of food production particularly the production of rice and maize has not yet been exploited fully. Adverse effects of inflated transaction costs on crop production and socio-economic well being of agricultural crop producers and other households and firms in Tanzania need not be overemphasized. In the literature, it is acknowledged that the inflated transactions costs affect not only consumer price but also producer price. Southern Agricultural Growth Corridor of Tanzania (SAGCOT) (2010), for example, reveals that, if the marketing system is not efficient farmers becomes price takers and retailers and subsequent consumers pay high prices due to the high transactions costs. This large price band affects household decisions, such as production diversification resulting in inefficient outcomes, particularly low food production and hence food insecurity.
Typically, therefore, the burden of transactions costs is imposed on crop producers by crop buyers in a form of low farm-gate prices which in turn affect agricultural production and hence undermine economic growth and poverty eradication strategies. Unfortunately, improving competitiveness in food marketing by addressing transaction costs in crop marketing system in Tanzania has not been a major research and policy issue. Instead, making farming commercially viable has taken a back seat. Despite the wide documentation of adverse effects of transaction costs in the study area and Tanzania in general, what is not known is to what extent they affect crop production and hence rural household food security. These existing gaps from the reviewed literature become the motivation for this study. Therefore, the study intends to quantify the influence of farm-gate prices on rural household food security.
MATERIALS AND METHODS
This section describes the approaches employed in addressing the study’s objective. Mainly, the section describes an overview of the study area; sampling technique, sample size and data collection; and analytical techniques.
Despite agriculture being the leading sub-sector in the economy of the council, its performance has been declining due to several factors such as frequent use of inferior agriculture tools such as hand hoes, inadequate knowledge of new agricultural products, pest problems, and sometimes, low purchasing power of the people which tends to discourage the use of modern agricultural inputs or implements. In addition, marketing arrangements for most crops are inadequate coupled with the poor transport system and lack of credit facilities for peasant farmers. Food crops mainly produced in the council are maize, beans, and Irish potatoes while coffee, tea, and pyrethrum are produced as cash crops. Also, people in Njombe district council use food crops as cash crops in order to enhance their incomes and ensure food availability throughout the year (URT, 2016).
Sampling Technique, Sample Size, and Data Collection
The data for this study were obtained from a sample survey of farming households conducted in Ludewa district of Njombe region, Tanzania. The area of study was decided purposively based on its potentiality in maize production. The pilot survey done recognized that the proportion of the farmers’ households is approximately 0.85 (farmers’ households divide by total households). Following the information obtained from the pilot survey, about 20% of the farming households were selected using simple random sampling technique (i.e., 427 households). Enumerators were trained for data collection exercise and semi and structured questionnaires were designed such that both qualitative and quantitative information was collected. Main information collected was about household’s characteristics, maize produced, maize bought, maize sold, family/household information (age, gender, and education level), maize farm-gate price, transaction costs information etc.
Model specification: The model specification follows the analytical technique employed by Babatunde et al. (2007) with modification done to suit the current study. Babatunde et al. (2007) first constructed food security index to determine food security status of each household based on the food security line using the recommended daily calories required approach. Then, they estimated a logit model to estimate the effect of various factors on food security status. So, the current study involved the process of calculating the number of grams of maize available for each household for consumption per year (G): G = Grams produced + grams bought + grams received as a gift – grams sold – grams given out as gift - grams used for local brews. The grams available for household consumption were converted to kcal using the FAO (1997) recommended conversions (Appendix 1, i.e., 100g of white maize = 357kcal). Thus, total kcal available for household consumption per year was determined using the following equation:
= 100 ∗ 357 ... (1)
where:
Ci = total kcal available for household consumption per year,
and;
G = amount of grams available for each household consumption per year. Next step involved calculating the annual kcal requirement per individual in the household based on the FAO (1997) (Appendix 2) recommendation and
summing them up to obtain the total kcal required per household (Zi) per year. Using the results above the food
security index was calculated as;
= ... (2)
where:
yi = food security status of ith households (1= food secure
household, 0 = food insecure household);
Ci = total kcal available for household consumption per year;
Zi = required annual kcal intake per ith households per year;
yi = 1 for Ci greater or equal to Zi; and
yi = 0 for Ci less than Zi.
Model estimation
Based on the household food index yi, the logit model was
estimated in SPSS to identify the determinants of food security status among farm households including the output market transaction cost aspects (proxied by expected price). The logit model assumes that there is an underlying response variable yi
defined by regression relationship
= + ………... (3)
where:
yi = food security status of ith household;
Xi = vector of explanatory variables;
β = vector of the parameter estimates; and u = the error term.
RESULTS AND DISCUSSION
Descriptive statistics: On the basis of the recommended daily calories intake (see Appendix 1), as converted to annual requirements, it was found out that slightly above half (54% of the households were food secure. The mean kcalorie intake available for each household per year was 5.5955E6 kcal (Table 3). This is higher than the recommended mean of 4.1229E6 kcal. The overall mean household size was 5.1. Average household size for food secure household was 4.9 and for food insecure household was 5.3. Correlation analysis indicates that the explanatory variables used in the logit model do not correlate justifying the absence of multicollinearity problem.
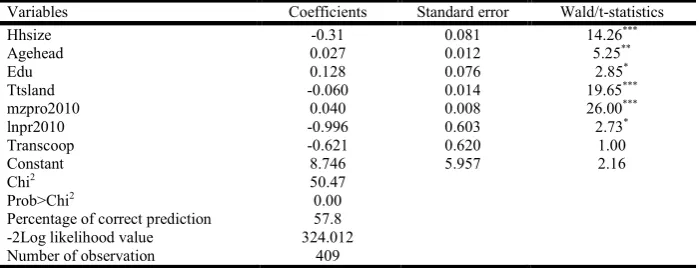
Determinants of household food security: The study used a logit model (equation 3) to identify determinants of farm household food security. Expected maize farm-gate price was included as one of the explanatory variables as it is influenced by transaction costs. The dependent variable was household food security status (1 = food secure, 0 = food insecure). The results show that the model predicted 63.6% variability in food security (Table 4). The chi-squared test result also shows that the model was adequate in explaining the determinants of the food security status of farm households.
The result looks strange but the possibility is that once the price of output is high, the farmer tends to sell all produce and vice versa. So, while high price motivating more production, there should be measures/policies to ensure that households are selling the only surplus.
Household size: The results show that household size had a negative coefficient which was significant at 1% level. This result suggests that the probability of a household being food secure decreases by 0.31 if household size increases by one person. In other words, the larger the household size, the more likely household would be food insecure. This result was expected because among other things, the requirement of calories at household level increases with its size. So, if production of food (maize in this case) does not increase in
accordance with the size of household, the household becomes food insecure. The finding is consistent with that of Amani (2004) who found out that the large households in Tanzania are likely to be food insecure and Aidoo et al. (2013) who revealed that the household size had a negative influence on household food security in Ghana. This implies that fertility control policies can have a significant impact on food security at household level.
[image:4.595.61.543.84.161.2]Age of household head: The result shows that age of the household head had a positive coefficient that was significant at 5% level. This suggests that an increase in household’s head age by one year above mean age increases the likelihood of household being food secure. This finding supports previous research into this brain area (e.g. Aidoo et al. 2013) which
Table 1. Importance of staple foods in diet (averages of 2005 – 2007)
Commodity Quantity consumeda (kg/person/year) Daily caloric intake (kcal/person/day) Share of caloric intake (%)
Maize 73 655 33
Cassava 157 298 15
Rice 16 154 8
Wheat 10 79 4
Sorghum 9 79 4
Other 730 37
Total 1,995 100
[image:4.595.80.522.206.287.2]a.Apparent consumption is production plus imports minus exports and non-food uses. Source: Rashid and Minot (2010)
Table 2. Expected signs of the explanatory variables for logit model
Variable Description Expected sign
Hsize Household size (persons) Negative
Agehead Age of household head (years) Negative/positive
Edu Education level of household head (number of years spent in school) Positive
Ttsland Total land owned by head of household (acres) Positive
mzpro2010 Quantity of maize produced in 2010 (100kg bags) Positive Infgp Natural log of farm-gate price (TZS/100 kg bag) Positive/negative
Transcoop Cooperative in maize transportation(dummy) Positive
Table 3.Summary of descriptive statistics related to household food security
Variable N Minimum Maximum Mean Standard deviation
Calorie available per household (kcal/annum) 409 142800 40983600 5.5955E6 5.2E6 Calorie recommended per household (kcal/annum) 409 668865 11195996 4.1229E6 1.7E6
Age of head of household (years) 409 19 85 43.89 13.3
Household size (persons) 409 1 13 5.10 2.0
Land for maize production (acres) 409 0 50 1.3094 2.9
Amount of maize produced in 2010 (100kg bags) 409 0 500 29.888 34.9
Number of years head of household spent in school 409 0 14 6.88 2.2 Maize farm-gate price (TZS/100kg bag) 409 10000 35000 1854.09 5058
Farmer Cooperative in maize transportation 286 0.2
Source: Field survey data and own computations
Table 4. Logit model estimates of determinants of household food security status
Variables Coefficients Standard error Wald/t-statistics
Hhsize -0.31 0.081 14.26***
Agehead 0.027 0.012 5.25**
Edu 0.128 0.076 2.85*
Ttsland -0.060 0.014 19.65***
mzpro2010 0.040 0.008 26.00***
lnpr2010 -0.996 0.603 2.73*
Transcoop -0.621 0.620 1.00
Constant 8.746 5.957 2.16
Chi2 50.47
Prob>Chi2 0.00
Percentage of correct prediction 57.8 -2Log likelihood value 324.012
Number of observation 409
Dependent variable: Food security status
[image:4.595.76.532.318.417.2] [image:4.595.128.478.460.594.2]shows that the age of the farmer had a positive and significant influence on food security in Ghana.
Education level of the household head: For the case of the level of education, the findings suggest that the number of years the household head spent in school exerted a positive and statistically significant effect on food security (i.e., at 10%). These results have the implication that households with educated heads are more likely to be food secure than the one with uneducated heads. The positive correlation could imply that educated household heads are likely to be able to cope with new technologies and training from agricultural extension officers and hence, increase production. Blessing and Theresa (2013) came up with the same findings when they revealed that education level is among of the major causal factors that impacted food security positively and significantly in Nigeria.
Total land size owned by household head:The size of land owned by the household head was negative and statistically significant at 1% probability level. The negative coefficient is contrary to the expectations. The study by Babatunde et al. (2007) came up with the same unexpected negative sign and insignificant findings for the land size in Nigeria. The unexpected sign could be due to the fact that farmers expand the size of their land when the output price is high and therefore, there is a possibility of being motivated by the price and selling all produce and remain food insecure. The findings, however, is consistent with that of Haile et al. (2005) which revealed that land size was significantly influenced the probability of a household being food secure in Ethiopia.
Maize production in current season: The coefficient of the quantity of maize produced by household is positive and statistically significant at 1% test level. This suggests that the higher the amount of maize obtained from own production, the higher the likelihood of the household being food secure. The result suggests that an increase of maize production by one 100kg bag will increase the probability of a household being food secured by 0.06. This result was expected since rural households largely depend on their own produce for food. The findings are consistent with that of Haile et al. (2005) who found out that per capita aggregate crop production had a positive and significant influence on food security in Ethiopia.
Conclusion and policy Recommendation
Based on the findings and discussion of the study, it can be concluded that household size, total land size owned by household head, maize production in the current season, and expected maize farm-gate price are significant factors for farm household security. The study recommends the policies that will lead to increased farm-gate price but monitoring behaviour of farmers so that they do not sell above surplus. The study also recommends fertility control policies to maintain manageable household size.
Acknowledgement
I wish to thank and express my profound gratitude, indebtedness, and appreciation to Regional Universities Forum for Capacity Building in Agriculture (RUFORUM) for financial support. I am also indebted to my staff colleagues for their comments which shaped my paper.
REFERENCES
Abafita, J. and Kim, K. 2012. Determinants of Household Food Security in Rural Ethiopia: An Empirical Analysis. Journal of Rural Development 37(2): 129 – 157.
Aidoo, R., Mensah, J.O. and Tuffour, T. 2013. Determinants of Household Food Security in the Sekyere-Afram Plains Districts of Ghana. European Scientific Journal, 9(1), 514-521.
Amani, H.K.R. 2004. Agricultural Development and Food Security in Sub-Saharan AFRICA Tanzania Country Report. Dares Salaam, Tanzania: Economic and Social Research Foundation (ESRF) Press. http://www.fao.org/tc/ tca/work05/ Tanzania.
Babatunde, R.O., Omotesho, O.A. and Sholotan, O.S. 2007. Factors Influencing Food Security Status of Rural Farming Households in North Central Nigeria. Agricultural Journal, 2(3), 351-357.
Bese, D., Düchting, A., Gebauer, H., Gerken, A., Maeda, C., Manyong, V.M., Rupschus, C. and Starosta, S. 2009. Promoting Regional Trade to Enhance Food Security A Case Study on the Border Region of Tanzania and Zambia. SLE Publication Series S239. Berlin and International Institute of Tropical Agriculture (IITA), Dares Salaam, Tanzania: Centre for Advanced Training in Rural Development (SLE) Press.
Blessing, A.O. and Theresa, B.O. 2013. Food Insecurity and its Determinants in Rural Households in Ughelli North Local Government Area of Delta State, Nigeria. International Journal of Innovative Agriculture and Biology Research, 1(2), 20-30.
Food and Agriculture Organisation 1997. Agriculture Food and Nutrition for Africa – A Resource book for Teachers of Agriculture. Rome, Italy. Food and Agriculture Organisation of the United Nations Press. http://www.fao. org/docrep/w0078e/w0078e00.htm. (Accessed on: 27 March, 2012).
Food and Agriculture Organisation 2008. Report on Use of the Household Food Insecurity Access Scale and Household Dietary Diversity Score in two Survey Rounds in Manica and Sofala Provinces, Mozambique, 2006-2007. Rome, Italy: Food and Agriculture Organisation of the United Nations Press.
Food and Agriculture Organisation, 2013. The State of Food Insecurity in the World 2013. The Multiple Dimensions of Food Security. Rome, Italy: Food and Agriculture Organisation of the United Nations.
Ghanem, H. 2008. The State of Food Security in the World 2008: High Food Prices and Food Security – Threats and Opportunities. Rome, Italy: Food and Agriculture Organisation of the United Nations Press. ftp://ftp.fao.org/docrep/fao/011/i0291e/i029e00.pdf.(Acces sed on: 17 March, 2012).
Haile, M.G., Kalkuhl, M. and Von Braun, J. 2013. Short-term Global Crop Acreage Response to International Food Prices and Implications of Volatility. ZEF – Discussion Papers on Development Policy No. 175. Bonn, Germany: Center for Development Research Press.
Kiratu, S., Märker, L. and Mwakolobo, A. 2011. Food Security: The Tanzanian Case: Series on Trade and Food Security. Manitoba, Canada: International Institute for Development.
Contribution to Household Food Security. African Journal of Agricultural Research, 6(11), 2617-2626.
Mwakalinga, H.A and Massawe, W. 2007. Output Market Support. Dar es Salaam, Tanzania: Agricultural Council of Tanzania.
http://www.tap.or.tz/documents/200704_OUTPUT_MARK ETING_SUPPORT.pdf. (Accessed on: 16 February, 2012). Nazir, Z., Bastian, G., Wang, X., Armenta, G., Thompson, C., Stone, C. 2010. Food Security in Tanzania: Enabling Environment. Columbia, USA: School of International and Public Affairs Columbia University Press.
Njukia, S. 2006. Using Markets to Increase Food Security. Washington, D.C., USA: United States for International Aids Press. pdf. (Accessed on: 16 February, 2014). United Nations 2014. The Millennium Development Goals
Report. New York, USA: United Nations 2014http://www. un.org /2014http://www.un.org/millenniumgoals/2014% 20 MDG%20report/ MDG%202014 %20 English %20 web. pdf. (Accessed on: 01 October, 2015).
United Republic of Tanzania (2006). National Sample Census of Agriculture. Volume Vk: Regional Report: Iringa Region.Dar es Salaam, Tanzania: Dar es Salaam Press. United Republic of Tanzania (2016). Njombe District Council
Socio-Economic Profile 2016. http://www.njombedc. go.tz/storage/app/media/uploadedfiles/Njombe%20DC%20 S.E.%20Profile.pdf. (Accessed on: 22 December, 2017). United States Agency for International Development 2010.
MicroCLIR/CIBER Assessment: The Legal, Policy, Regulatory, and Institutional Constraints to the Growth of Maize and Rice in Tanzania. Washington, D.C., USA: United States Agency for International Development Press.
http://bizclir.com/galleries/country-assessments/Tanzania_MicroCLIR.pdf. (Accessed on: 10 May, 2012).
United States Department of Agriculture 2017.Assessments of Commodity and Trade Issues. https://gain.fas.usda.gov. (Accessed on: 22 March, 2018).
APPENDICES
Appendix 1: Comparative energy and protein content of some cereals, tubers, legumes and oilseeds (per 100 g)
Food Energy (kcal) Protein (g)
Maize, white 357 9.4
Rice, brown hulled 357 8.1
Fonio meal 343 10.5
Millets 345 10.4
Sorghum 345 10.7
Cowpeas 342 23.1
Beans (Phaseolus spp.) 336 23.0
Groundnuts 549 23.2
Sesame 558 17.9
Soybeans 405 33.7
Cassava flour 340 1.5
Cassava, fresh 153 0.7
Yam flour 317 3.5
Yam, fresh 104 2.0
Sweet potato 114 1.5
Taro 113 2.0
Plantain 128 1.0
Source: FAO/United States Department of Health. Education and Welfare, 1968.
Appendix 2. Daily requirements for energy and protein
Group/age (years) Energy (kcal) Protein (g)
Diet Aa Diet Bb
Children (both sexes)
0-6 months 585 10 -c
6-12months 960 14 -
1-3 years 1250 14 23
3-5 1510 18 26
5-7 1710 20 30
7-10 1880 26 38
Boys
10-12 2170 34 50
12-14 2360 43 64
14-16 2620 52 75
16-18 2820 57 84
Girls
10-12 1925 35 52
12-14 2040 42 62
1416 2135 46 69
16-18 2150 45 66
If pregnant +200 +6 +7
Men, active
1 8-60 2 944 49 57
>60 2 060 49 57
Women, active
Child-bearing age 2140 41 48
Pregnant 2 240 47 55
Lactating 2 640 59 68
>60 1830 41 48
Source: WHO. 1985.
Appendix 2: Outputs for logit model