Research on SAP Business One Implementation Risk
Factors with Interpretive Structural Model
*
Jiangping Wan1,2, Jiajun Hou1
1School of Business Administration, South China University of Technology, Guangzhou, China; 2Institute of Emerging
Industrializa-tion Development, South China University of Technology, Guangzhou, China. Email: [email protected], [email protected]
Received January 4th, 2012; revised February 7th, 2012; accepted February 29th, 2012
ABSTRACT
The possible risk factors during SAP Business One implementation were studied with depth interview. The results are then adjusted by experts. 20 categories of risk factors that are totally 49 factors were found. Based on the risk factors during the SAP Business One implementation, questionnaire was used to study the key risk factors of SAP Business One implementation. Results illustrate ten key risk factors, these are risk of senior managers leadership, risk of project management, risk of process improvement, risk of implementation team organization, risk of process analysis, risk of based data, risk of personnel coordination, risk of change management, risk of secondary development, and risk of data import. Focus on the key risks of SAP Business One implementation, the interpretative structural modeling approach is used to study the relationship between these factors and establish a seven-level hierarchical structure. The study illus-trates that the structure is olive-like, in which the risk of data import is on the top, and the risk of senior managers is on the bottom. They are the most important risk factors.
Keywords: Enterprise Resource Planning; SAP Business One; Risk; Interpretive Structural Model; Project
Management
1. Introduction
Enterprise Resource Planning (ERP) software is one of the fastest growing segments of business computing to- day. A large body of literature on information technology (IT) implementations has been developed during the past several decades. However, our understanding of the fac- tors and processes that lead to ERP implementation suc- cesses or failures is still limited because ERP implemen- tation is relatively new and is different from traditional information systems development projects [1].
A search of abstracts of scholarly articles using the key- words of project management and ERP on the following databases, namely: ABI/INFORM, ACM Digital Library, IEEE Explore, Science Direct, and Emerald Fulltext yie- lded only 22 articles. Out of these 22 articles, 14 articles are more closely related to the implementation of ERP systems, while the rest mention ERP but are concerned with other software or business-process-related topics. Out of the 14 extracted articles, 9 deals with success fac- tors, models, or best practices contributing to positive outcomes of ERP implementations with project man- agement as one of the factors. There are two conceptual
articles that offer a normative project management metho- dology and a project model in ERP implementations. The remaining three articles all mention project management as important in ERP implementations but are mainly con- cerned with a variety of issues in ERP, including an agent- based approach to ERP deployments, technological dis- course in organizations while undertaking an ERP project, and ERP system value as a function of a firm’s strategies and integration mechanisms [2].
Headquartered in Walldorf, Germany, SAP is the mar- ket leader in enterprise application software. Founded in 1972, SAP (which stands for “Systems, Applications, and Products in Data Processing”) has a rich history of inno- vation and growth as a true industry leader. SAP has more than 54,000 employees and sales and development loca- tions in more than 50 countries worldwide. The SAP Busi- ness One application integrates all core business functions across your entire company—including financials, sales, customer relationship management, inventory, and opera- tions. Unlike many other small business solutions on the market today, SAP Business One is a single application, eliminating the need for separate installations and complex integration of multiple modules (http://www.sap.com/). Based on the work of the SAP implementation process, and combined with practical experience, SAP Business
*This research was supported by Key Project of Guangdong Province
One implementation can be divided into five stages: pre- paration stage, solution stage, implementation stage, final preparation stage and online and support stage.
The paper is organized as follow: the Section 1 is intro- duction, the Section 2 is literature review, the Section 3 is research design, the Section 4 is to identify key risk fac-tors, the Section 5 is to identify root risk facfac-tors, the Sec-tion 6 is case study, and the SecSec-tion 7 is conclusions.
2. Literature Review
Christina Soh, Sia Siew Kien and Joanne Tay-Yap find- ings suggest the “misfit” issue may be worse in Asia be- cause the business models underlying most ERP packages reflect European or U.S. industry practices. Procedures in Asian organizations are likely to be different, having evo- lved in a different cultural, economic, and regulatory context [3]. Herb Krasner have found that for your project to succeed, you must prevent problems in the following high-priority areas: 1) e-business strategy, 2) Project ma- nagement approaches, 3) Complex technology and sys-tems, and 4) End-user resistance [4]. Companies pre-dominantly look at the functionality and quality of the products and services for evaluating ERP suppliers, which has been found across all lines of business and all coun- tries [5]. Inevitably, customization and implementation of ERP systems became an industry on its own. Several modeling approaches are possible: 1) Reduce the effort necessary for creating the target concept by leveraging “best practice case” knowledge available in reference models. 2) Create a requirements definition by leveraging modeling techniques to detail the description. 3) Docu-ment the system requireDocu-ments definition by means of conceptual modeling methods, making the business logic more understandable. 4) Leverage conceptual models as a starting point for maximum automation of system and configuration customizing [6]. The meanings of “enter-prise” and “site” vary depending on unique organizational circumstances. The complexities of what are often called “multi-site” ERP implementations are discussed here. Like all computer-based information systems, multi-site ERP implementations can be analyzed in terms of levels or layers (logical versus physical, hardware versus soft- ware). At each level there are different choices to make and different criteria for evaluating the alternatives. How- ever, the layers are interdependent: Choices at one level may limit the available choices or affect the performance of the system at another level. Therefore, organizations are generally advised to start planning multi-site ERP im- plementations at the strategic level before proceeding to the technical (software and hardware) levels. In practice, however, the sheer size and scale of such implementations may encourage organizations to tackle the layers inde- pendently, contributing to many failures and partial suc- cesses of these complex business and technical projects
[7].
3. Research Design
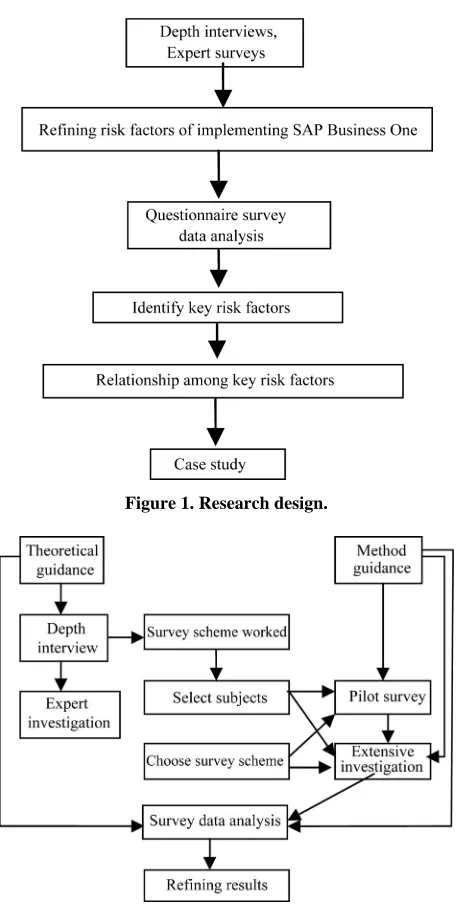
First, SAP Business One implementation risk factors were found out with depth interviews and expert surveys, key risk factors were identified and root risks were deter-mined. Finally, the research results and their applica- bility were analyzed with case studies (Figure 1).
4. Identify Key Risk Factors
4.1. Questionnaire Approach
The investigating scheme was protocoled after an in-depth interview and preliminary established SAP Business One implementation risk factors. Expert investigation was used to revise and complement the result of depth in-terview and establish formal survey scheme to make the result more reasonable. Questionnaire would be sent to consulting company and supervisor to a pilot investigation in the first, and then for SAP Business One suppliers, services, implementation enterprises and the information direction scholar with a purpose. Before sending out the questionnaires, we would talk to them and make them know the whole process and explain the unclear. Only the respondents had the knowledge that the questionnaire re-quired and were interested in the questionnaire (Figure 2).
4.2. Questionnaire Design and Collection
We divided the five phases into 21 level 2 risk factors and with 73 level 3 risk factors to reflect based on the in- terview results. After experts’ investigation, and 20 level 2 risk factors, 49 level 3 risk factors were determined fi- nally with five-point Likert scale.
The 49 level 3 risk factors were as follows according five stages SAP Business One (SBO).
4.2.1. Preparation Stage
P1) Risks of organization of implementation team are as follows: P11) Organization don’t appoint dedicative per- sonnel in charge of the project the follow up. P12) Or- ganization don’t established project implementation team.
P2) Risks of requirement development are as follows:
P21) Requirement analysis isn’t comprehensive. P22) An- alytical tools isn’t reasonable.
P3) Risks of project scope are as follows: P31) Orga-
ni-zation don’t understand functions of SBO. P32) Imple-
mentation project team members don’t understand orga- nizational implementation of SBO relevant circumstances.
P4) Risks of objectives establishment are as follows: P41) Organizational intent isn’t clear. P42) There are gaps be- tween objects and real world.
Figure 1. Research design.
Figure 2. Questionnaire survey methodology.
system platform don’t satisfy SBO requirement. P52)
Or-ganizational staffs don’t cooperate.
4.2.2. Solution Stage
S1) Risks of process analysis are as follows: S11) Process diagnosis isn’t accurate. S12) It isn’t enough to understand the realities of organizations.
S2) Risks of process improvement are follows: S21)
Organizational culture lags behind. S22) Organizational
business process is too complex. S23) It isn’t enough that implementing personnel communicate with organization of the high-level. S24) New business process is not rea- sonable.
S3) Risk of change management are follows: S31) Ma- nagement mode change feasibility is poor. S32) Organiza-
tional personnel resist.
S4) Risks of second development risk are as follows: S41)
Second development work is high complexity. S42)
Un-derstanding on requirement by second development per-sonnel is deviated customer expectations.
4.2.3. Implementation Stage
I1) Risks of basic data are as follows: I11) Organization based data is not standard. I12) Organization data collec- tion is difficult. I13) Data arrangement work starts too late. I2) Risks of plan management are as follows: I21) Fea- sibility plan is poor. I22) Plan is discontinuous. I23) Plan can not adapt to the change of actual condition.
I3) Risks of project management are as follows: I31) It is lack of effective control of the project schedule changes. I32) It is lack of effective implementation of quality con- trol. I33) Scope of implementation isn’t clear, infinite expansion.
I4) Risk of senior management leadership are as fol-
lows: I41) Senior business leaders support isn’t enough. I42) Senior business leaders don’t understand the implemen- tation of SBO. I43) Empowerment isn’t enough.
(I5) Risks of human resources are as follows: I51) Per- sonnel is poor stability. I52) Personnel quality is low. I53) Researchers working attitude is not positive.
I6) Risks of system testing are as follows: I61) Software itself is complex. I62) Workload of the secondary deve- lopment is large. I63) Test activities of the organization management are confusion.
I7) Risk of cost control is as follows: I71) Implementa- tion costs increase unplanned.
4.2.4. Final Preparation Stage
F1) Risks of implementation training are as follows: F11) Implement party personnel training plan isn’t reasonable. F12) Quality of staff organization is poor. F13) Organization staffs don’t participate in the whole training process.
F2) Risks of import data are as follows: F21) Method of data import result is bad. F22) Data format is not uniform. F23) Accuracy of the basic data is low, and its rationality is poor.
4.2.5. Online and Support Stage
O1) Risks of systems transformation are as follows: O11)
Project high is complexity. O12) Organizational staffs
conflict the new system.
O2) Risks of system operation assessment are follows: O21) Evaluation personnel participation isn’t positive. O22) Evaluation system isn’t reasonable.
4.3. Analysis Questionnaire Reliability
All the data’s Cronbach’s alpha value from questionnaire 49 level 3 risk factors is 0.896, and then aggregate level 3 risk factors to corresponding level 2 risk factors, and calculating mean, then reliability analysis the 20 level 2 risk factors data once again, their Cronbach’s alpha value is 0.885 and reliability are very good.
4.4. Analysis Questionnaire Validity
Validity includes three types: There are surface validity, content validity and construct validity.
Surface validity. Before sending out the questionnaire formally, this paper made a pilot study on the question- naire draft in a small scope, according to the feedback of the investigation results, we amended the questionnaire and guaranteed good validity of the questionnaire.
Content validity. Every risk factor was discussed and amended by the expert group and got recognized com- monly, we ensured each items had significant difference to guarantee the effectiveness of the content through the depth interview.
Construct validity. The construction of the 49 level 3 risk factors of five stages were measured with KMO sam- ple and Bartlett sphere to test the significant level simul- taneously in order to check whether it is suitable for factor analysis. The measurement results of each secondary
indexed was illustrated in Table 1 with principal com-
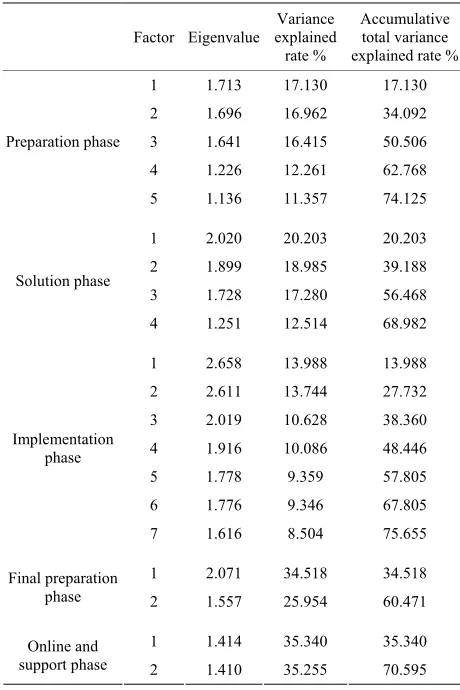
ponent analysis and varimax to orthogonal rotating factor. Kaiser argued that KMO less than 0.5 was not suitable for factor analysis, while KMO more than 0.9 was very suitable for factor analysis. The exploratory factor analysis and varimax orthogonal rotating was used to test whether the 49 level 3 indexes could belong to the 20 level 2 indexes (Table 2).
The accumulative variance interpretation of each stage is greater than 40% in Table 2, which satisfies the stan-
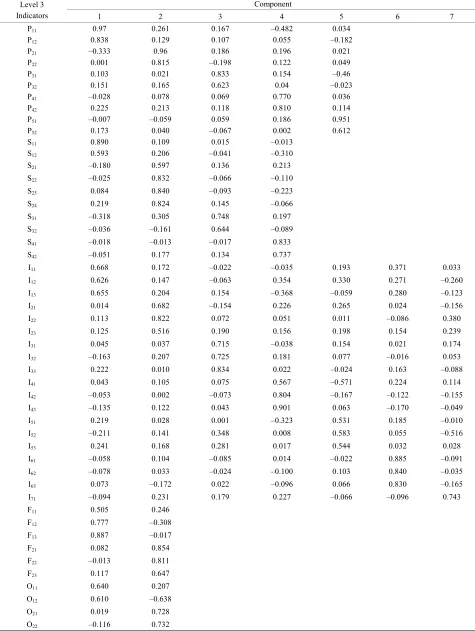
dard of judgment. The factors which characteristic value is greater than 1 were selected with orthogonal rotation to get factor load matrix according to Kaiser rule in Table 3.
Each factor loading corresponding to each index is above 0.5, therefore, it has good construct validity.
4.5. Questionnaire Results
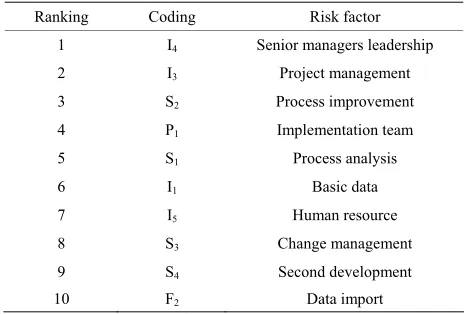
Top ten risks in descending were illustrated in Table 4.
The results were in the following: Senior management leadership (I4), Project management (I3), Process impro- vement (S2), Implementation team (P1), Process analysis (S1), Risk-based data (I1), Human resources (I5), Change management (S3), second development (S4), and Data im- port (F2).
[image:4.595.308.538.100.190.2]Interpretive Structural Modeling (ISM) process, which enables groups to work together to construct those non- linear patterns that no one or no group working without
Table 1. Results of KMO and Bartlet’s test.
Variable (stage) KMO Sig. Project preparation 0.579 0.000
Solution 0.545 0.000 Implementation 0.711 0.000 Final preparation 0.575 0.000
Online and support 0.599 0.000
Table 2. Level 2 indexes accumulative variance interpre- tation.
Factor Eigenvalue Variance explained rate %
Accumulative total variance explained rate % 1 1.713 17.130 17.130 2 1.696 16.962 34.092 3 1.641 16.415 50.506 4 1.226 12.261 62.768 Preparation phase
5 1.136 11.357 74.125 1 2.020 20.203 20.203 2 1.899 18.985 39.188 3 1.728 17.280 56.468 Solution phase
4 1.251 12.514 68.982 1 2.658 13.988 13.988 2 2.611 13.744 27.732 3 2.019 10.628 38.360 4 1.916 10.086 48.446 5 1.778 9.359 57.805 6 1.776 9.346 67.805 Implementation
phase
7 1.616 8.504 75.655 1 2.071 34.518 34.518 Final preparation
phase 2 1.557 25.954 60.471 1 1.414 35.340 35.340 Online and
support phase 2 1.410 35.255 70.595
[image:4.595.307.537.227.572.2]Table 3. The index factors loading in each phase.
Component Level 3
Indicators 1 2 3 4 5 6 7
P11 0.97 0.261 0.167 –0.482 0.034
P12 0.838 0.129 0.107 0.055 –0.182
P21 –0.333 0.96 0.186 0.196 0.021
P22 0.001 0.815 –0.198 0.122 0.049
P31 0.103 0.021 0.833 0.154 –0.46
P32 0.151 0.165 0.623 0.04 –0.023
P41 –0.028 0.078 0.069 0.770 0.036
P42 0.225 0.213 0.118 0.810 0.114
P51 –0.007 –0.059 0.059 0.186 0.951
P52 0.173 0.040 –0.067 0.002 0.612
S11 0.890 0.109 0.015 –0.013
S12 0.593 0.206 –0.041 –0.310
S21 –0.180 0.597 0.136 0.213
S22 –0.025 0.832 –0.066 –0.110
S23 0.084 0.840 –0.093 –0.223
S24 0.219 0.824 0.145 –0.066
S31 –0.318 0.305 0.748 0.197
S32 –0.036 –0.161 0.644 –0.089
S41 –0.018 –0.013 –0.017 0.833
S42 –0.051 0.177 0.134 0.737
I11 0.668 0.172 –0.022 –0.035 0.193 0.371 0.033
I12 0.626 0.147 –0.063 0.354 0.330 0.271 –0.260
I13 0.655 0.204 0.154 –0.368 –0.059 0.280 –0.123
I21 0.014 0.682 –0.154 0.226 0.265 0.024 –0.156
I22 0.113 0.822 0.072 0.051 0.011 –0.086 0.380
I23 0.125 0.516 0.190 0.156 0.198 0.154 0.239
I31 0.045 0.037 0.715 –0.038 0.154 0.021 0.174
I32 –0.163 0.207 0.725 0.181 0.077 –0.016 0.053
I33 0.222 0.010 0.834 0.022 –0.024 0.163 –0.088
I41 0.043 0.105 0.075 0.567 –0.571 0.224 0.114
I42 –0.053 0.002 –0.073 0.804 –0.167 –0.122 –0.155
I43 –0.135 0.122 0.043 0.901 0.063 –0.170 –0.049
I51 0.219 0.028 0.001 –0.323 0.531 0.185 –0.010
I52 –0.211 0.141 0.348 0.008 0.583 0.055 –0.516
I53 0.241 0.168 0.281 0.017 0.544 0.032 0.028
I61 –0.058 0.104 –0.085 0.014 –0.022 0.885 –0.091
I62 –0.078 0.033 –0.024 –0.100 0.103 0.840 –0.035
I63 0.073 –0.172 0.022 –0.096 0.066 0.830 –0.165
I71 –0.094 0.231 0.179 0.227 –0.066 –0.096 0.743
F11 0.505 0.246
F12 0.777 –0.308
F13 0.887 –0.017
F21 0.082 0.854
F22 –0.013 0.811
F23 0.117 0.647
O11 0.640 0.207
O12 0.610 –0.638
O21 0.019 0.728
Table 4. Top ten risk factors of SAP Business One imple-mentation.
Ranking Coding Risk factor
1 I4 Senior managers leadership
2 I3 Project management
3 S2 Process improvement
4 P1 Implementation team
5 S1 Process analysis
6 I1 Basic data
7 I5 Human resource
8 S3 Change management
9 S4 Second development
10 F2 Data import
5. Identify Root Risk Factors with
Interpretive Structural Model
5.1. The Establishment of the Interpretive Structural Model Team
We use the ISM to find the root risk factors [8]. The major sequence of events of an ISM is the following: (1) the theme is selected, (2) the developer is identified, (3) the elements and contextual relations are identified, (4) the project leader is identified, (5) the ISM program is entered into the computer, (6) adequate computer time is allocated, (7) the facilities are made ready, (8) the session plan is completed, (9) the computer contains the elements and the
contextual relations, (10) the session begins, (11) the
element set is edited, (12) the reachability matrix is com-pleted, (13) the total structure is now available, (14) the amendments are completed, and (15) the final structure is approved.
5.2. Discussion on the Relationship of SAP Business One Implementation Risk Factors
The discussion were done in GB company’s colleagues and its clients without leadership, there are nine experts put forward their valuable opinion, among which there are seven provide the data of adjacency matrix. The results were further discussed among the experts of Guangzhou JZ consulting company to establish the adjacency matrix.
5.3. Analysis of the Relationship of SAP Business One implementation
“X” indicates the row and column factors have mutual influence, “R” indicates the row factors affect the column factors, “C” indicates the column factors affect the row factors, the blank indicates the row and column factors have no mutual relationship (Table 5). We can construct
reachability matrix R, for each Ki element with Table 5, we get the following set:
P(Ki) = { Kj mij = 1 }; Q(Ri) = { Kj mji = 1 }; P(Ki) ∩ Q(Ki) = T(Ki)
Among them, P(Ki) is called, reachability set, that is, starting from Ki element to all the elements set that is able to reach; Q(Ki) is called first set, that is, all the ele-ments set that can achieve the Ki elements; T(Ri) is called common set, that is, the elements set which not only be-long to reaching set, but also to first set (Table 6).
5.4. Recognition of the Root Risk Factors of SAP Business One Implementation
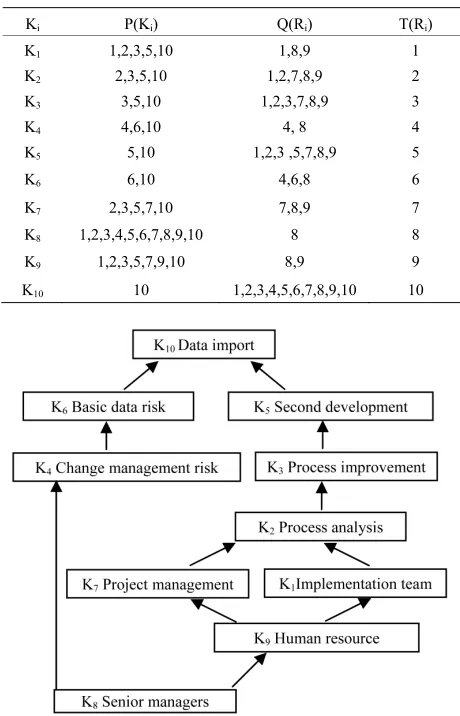
According to the hierarchy division of SAP Business One implementation risk factors, we build the following ISM model of SAP Business One implementation risk factors (Figure 3).The data import risk is illustrated the direct
reason to determine whether SAP Business One imple-mentation is successful in Figure 3. Senior managers lead
risk, which is the root risk factor, influence the success or failure of SAP Business One implementation from the start and through multiple stages. Each level risk factors is distributed to the different stage of SAP Business One implementation, the relationship among these risk factors is cross-phase stagger.
6. Case Study
DH company was founded in 2009, which integrate re-search and development, independent innovation, pro-duction and marketing as a whole, with gas stoves series products for the leading modern life electric appliance enterprise.
Today, the problems of DH company are various de-partment sharing data and information low, and material code and name is not unified to result the dynamic data not unified and inaccurate. Warehouse department can’t grasp the warehouse inventory and provide the information for the production planning department timely and accurately, the inventory of portion parts is too large to be effective controlled. The production planning department can’t control the accurate material inventory information and generate a total reports of production schedule, the BOM provided by the research and development department is imperfect, which influence the accuracy of program sche- duling. The purchasing plan management of purchasing department is confusion and can’t implement centralized and unified purchasing plan effectively. The sales depart- ment doesn’t have normative documents and detailed marketing plans, the customer information without special management. The company doesn’t have information ma- nagement department and software and hardware main- tenance work are outsourced.
Table 5. The relationship among risk factors of SAP Business One project implementation.
K1 K2 K3 K4 K5 K6 K7 K8 K9 K10
Implement-ation team
Process analysis
Process improvement
Change management
Second development
Basic data
Project management
Senior managers
Human resource
Data import Implementation
team K1 R C
Process
Analysis K2 R C
Process
Improvement K3 R
Change
management K4 R C
Second
development K5 R
Basic
data K6 R
Project
management K7 C
Senior
managers K8 R
Human resource K9
[image:7.595.56.286.359.717.2]Data import K10
Table 6. The antecedent set, reachability set, intersection set of SAP Business One implementation.
Ki P(Ki) Q(Ri) T(Ri)
K1 1,2,3,5,10 1,8,9 1
K2 2,3,5,10 1,2,7,8,9 2
K3 3,5,10 1,2,3,7,8,9 3
K4 4,6,10 4, 8 4
K5 5,10 1,2,3 ,5,7,8,9 5
K6 6,10 4,6,8 6
K7 2,3,5,7,10 7,8,9 7
K8 1,2,3,4,5,6,7,8,9,10 8 8
K9 1,2,3,5,7,9,10 8,9 9
K10 10 1,2,3,4,5,6,7,8,9,10 10
Figure 3. Interpretive structural model.
today. The UF financial software was mainly in the ware- house. SAP Business One was implemented in March 2011.
6.1. DH Company SAP Business One Implementation Risk Factors
The findings were in the following with analysis and re- search:
1) DH company didn’t organize their own implemen-tation team, over-reliance on consultants implemenimplemen-tation team. When the problems appeared during practice, they couldn’t solve them effectively, which affected the pro-gress of SAP Business One implementation obviously.
2) DH company’s senior leadership didn’t take to SAP Business One implementation seriously to be resistance from lower staffs, new process could’t be implemented and SAP Business One project was suspended several times.
3) GB company had less developers, which were more fluidity, they had poor communication with the persons concerned in DH company and made mistakes in under- standing the customer needs to result frequent revision in the secondary development and the progress was slow, and affect the whole progress of the project.
4) The basic data management of DH company was confusion, such as the production BOM table is given by the research and development department, but the infor-mation of the BOM table was sketchy and the production department should base the past experience to produce and result in that the production BOM was different from R&D BOM, and R&D BOM couldn’t be applied into production effectively in the SAP Business One system.
cost, and there was no comprehensive plan on time and didn’t make adequate preparations for the implementation, all the matters and time were arranged by the implemen- tation consultant entirely, the project once was out of control and couldn’t to be continued several times.
6) The senior managers considered that SAP Business One should solve all the problems that the enterprise had, but didn’t pay attention to the whole project implementa-tion and just wait for the results and SAP Business One’s on-line, ignoring SAP Business One’s instrumental.
7) DH company executives were not really involved in the project implementation and staff involved in the pro- ject didn’t go through rigorous training, and the whole process was like a mess and the team cohesion was quite low.
8) Only the data is successfully imported, can the whole SAP Business One system operate normally. But DH company’s data had not been provided, therefore the pro-ject implementation couldn’t be continued.
6.2. Questionnaire Results
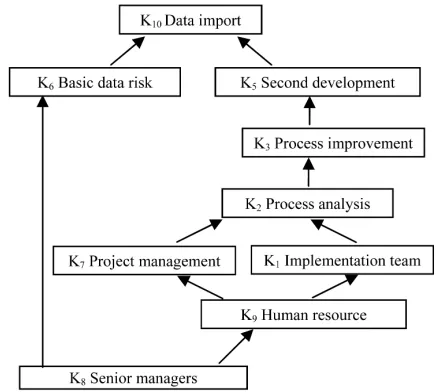
This paper constructs the hierarchy figure of SAP Busi- ness One implementation risk factors of DH company were illustrated in Figure 4.
1) Senior managers didn’t pay attention, therefor the coordination of human resource improper and process improvement blocked. They didn’t participate
in the discussion of the meeting, which resulted the atti-tude of key personnel of various departments were not positive. Or they only sent the personnel with weak ability to involve in the project implementation and the process improvement was resisted by the lower staff.
2)Lacking of human resource and the project im-plementation team couldn’t be organized and the project management was confusion. The staff of the DH
company not only implemented the SAP Business One project, but also engaged in their previous work, thus their time and energy couldn’t meet the need of the whole implementation of SAP Business One project. Besides, it was difficult to coordinate their various jobs and made the project management mess.
3)The project management was out of control, the process improvement and the secondary development changes was frequent. The senior managers of DH
company assigned an administrative director to be re-sponsible for the whole project, but didn’t empower the project leader without supporting of an efficient imple-mentation team, and the whole project management went over the right scope of the project leader, but the process modification should be the approval by the senior man-agers.
[image:8.595.313.531.85.281.2]4)The senior managers didn’t pay attention to the basic data maintenance and the data couldn’t be im- ported. What’s more, they didn’t pay much attention to
Figure 4. The hierarchy relationship among the risk factors of SAP Business One project implementation.
the process of SAP Business One implementation and their work attitude of the subordinates was unenergetic, the process of basic data settling was very slow and/or the data format was not reasonable, therefore data imported often was delay and slow.
5)The workload of the twice development was large and the data import frequently went wrong. Because
the workload of twice development of DH company had a lot work to do, and the data was frequent imported, and the function of the twice development may not be very perfect, and there may be some bugs in the interface design of each function, which lead to data sharing problems.
In one word, the risk factors of DH company mainly included the following: senior leader, project management, process improvement, implementation team, basic data, human resource, twice development, data import. Re-search results illustrated that the SAP Business One im-plementation risks and the relationship among them ex-isted indeed, and the specific enterprises may only have part of the risks.
7. Conclusion
In one word, the risks factors of SAP Business One im-plementation were identified, then the relationship be-tween various risk factors were studied, and the root fac-tors were also figured out. The case study gave some evidences for our findings. The main purpose was to fig-ure the existence of various types of risk factors in SAP Business One implementation out in order to effective control them in the future. Of course, there was a long way to go.
8. Acknowledgements
Mr. Jiangzhang Li, Mr. Juelin Huang, Mr. Xiangao Huang, Mrs Wei Qiao, Mr. Bing Wang, Mr. Jinghui Mai, Deyi Cui, Mrs Fang Fu, and Jie Cai help for matlab.
REFERENCES
[1] W. H. Luo and D. M. Strong, “A Framework for Evalu- ating ERP Implementation Choices,” IEEE Transaction on Engineering Management, Vol. 51, No. 3, 2004, pp. 322- 333.
[2] C. C. Chen, C. C. H. Law and S. C. Yang, “Managing ERP Implementation Failure: A Project Management Perspec- tive,” IEEE Transaction On Engineering Man- agement, Vol. 56, No. 1, 2009, pp. 157-170.
[3] C. Soh, S. S. Kien and J. Tay-Yap, “Cultural Fits and Mis- fits: Is ERP a Universal Solution?” Communications of the Association for Computing Machinery, Vol. 43, No. 4, 2000, pp. 47-51. doi:10.1145/332051.332070
[4] H. Krasner, “Ensuring E-Business Success by Learning from ERP Failures,” IT Professional, Vol. 2, No. 1, 2000, pp. 22-27. doi:10.1109/6294.819935
[5] Y. van Everdingen, J. van Hillegersberg and E. Waarts, “ERP Adoption by European Midsize Companies,” Com- munications of theAssociation for Computing Machinery, Vol. 43, No. 4, 2000, pp. 27-31.
doi:10.1145/332051.332064
[6] A.-W. Scheer and F. Habermann, “Making ERP a Suc-cess,” Communications of theAssociation for Computing Machinery, Vol. 43, No. 4, 2000, pp. 57-61.
doi:10.1145/332051.332073
[7] M. L. Markus, C. Tanis and P. C. van Fenema, “Multisite ERP Implementations,” Communications of the Associa- tion for Computing Machinery, Vol. 43, No. 4, 2000, pp. 42-46.