University of Warwick institutional repository: http://go.warwick.ac.uk/wrap
This paper is made available online in accordance with
publisher policies. Please scroll down to view the document
itself. Please refer to the repository record for this item and our
policy information available from the repository home page for
further information.
To see the final version of this paper please visit the publisher’s website.
Access to the published version may require a subscription.
Author(s): Aileen O'brien, Sarah White, Rana Fahmy, Swaran P.
Singh
Article Title: The development and validation of the SOLES, a new
scale measuring engagement with mental health services in people
with psychosis
Year of publication: 2009
Link to published article:
http://dx.doi.org/10.3109/09638230902968225
Publisher statement: ‘This is an electronic version of an article
published in O’Brien et al. (2009). The development and
validation of the SOLES, a new scale measuring engagement
with mental health services in people with psychosis. Journal
of Mental Health, Vol. 18 (6), pp. 510-522. The Journal of
Mental Health is available online at:
The development and validation of the SOLES, a new scale measuring
engagement with mental health services in people with psychosis
“The SOLES”
1. Aileen O‟Brien 2. Sarah White 3. Rana Fahmy 4. Swaran P.Singh
Word count 4,390
Affiliations
1,2,3 Division of Mental Health, St. George‟s, University of London 4 Health Sciences Research Institute, University of Warwick
Correspondence- Aileen O‟Brien, Division of Mental Health, St George‟s, University of London, Cranmer Terrace, London SW17 ORE.
Email: [email protected].
Abstract
Background:
No reliable and well-validated patient-rated scale exists for measuring engagement with mental health services. Alliance scales are often used as a proxy measure and most are clinician-rated.
Aim:
This study aimed to develop and validate the SOLES (Singh O‟Brien Level of Engagement Scale), designed to measure engagement in people with psychosis.
Method:
The SOLES was developed in focus groups and validated in patients with psychosis. Reliability was tested using Cronbach‟s alpha and split-half reliability. Factor analysis was conducted. Concurrent validity (correlating SOLES scores with measures of alliance, insight and satisfaction), discriminant validity and predictive validity (whether SOLES predicts drop-out) were tested.
Results:
As some subjects had no keyworker two scales were developed, for with and without a keyworker; the SOLES16 and SOLES13. Both have good internal consistency, correlate with relevant scales and scores predict engagement
Conclusions:
The SOLES is reliable, valid and is a potentially valuable research and clinical tool.
Declaration of interest:
Keywords
1) Engagement 2) Disengagement
Introduction
Disengagement from psychiatric services presents a serious challenge; patients with psychosis who drop out of care have more social needs, are more unwell and more likely to be legally detained than those still in contact with services (Bindman et al,. 2000, Bowden et al., 1980; Hellerstein et al 2001). There is increasing awareness of the problem (Sainsbury‟s Centre for Mental Health, 1998) and engagement is a focus of newer models of working such as assertive community treatment (ACT) (Burns, 2002).
However engagement is not a simple construct and is rarely explicitly defined. It has various components, some of which have been explored in qualitative research (Kirsh & Tate, O'Brien). The term is often conflated with that of alliance. A positive relationship does seem to influence outcomes; a meta-analysis described the alliance-outcome relationship as “moderate” (Martin, Garske, & Davis, 2000). Many alliance scales exist, but patients may form a relationship not with one professional but with services as a whole. Compliance and attendance measures are also often used to measure engagement; although they are related constructs patients may be complying despite poor relationships (Priebe, Watts, Chase, & Matanov, 2005) or attending reluctantly. Indeed Bale found in ACT patients the number of appointments kept was inversely related to keyworker-rated alliance (Bale, Catty, Watt, Greenwood, & Burns, 2006).
indices were. The Service Attitudes Questionnaire (SAQ) (Goodwin et al., 2003) was developed in focus groups and is patient-rated. There was patient participation in its development but the scale has not been robustly validated. The Homelessness Engagement and Acceptance Scale (HEAS) is clinician rated (Park et al., 2002) and found to be a predictor of accommodation status and adequacy of support network. The authors suggest that the scale can be used as a general engagement scale if the first question regarding homelessness is omitted. The Service
Engagement Scale (SES) (Tait, Birchwoo, & Trower, 2002) is a clinician rated scale with good test-retest reliability, further validated in a study finding that low engagement as measured by the SES was related to “sealing over” recovery style (Tait, Birchwood, & Trower, 2003).
Most of the engagement scales measure engagement from the clinician‟s perspective. This has practical benefits but in terms of validity there is a case for obtaining the perspective of the patient, indeed research has shown poor concordance between patients‟ and professionals‟ ratings (Rothman, Hedrick, Bulcroft, Hickam, & Rubenstein, 1991). Service providers and patients may describe engagement in different ways. What is described as engagement by clinicians may be perceived as coercive by patients, who may disengage for valid reasons. Bale found a lack of correlation between patients‟ and keyworkers‟ views when measuring alliance (Bale, Catty, Watt, Greenwood, & Burns, 2006) and Simmonds states that alliance measures are better predictors of outcome when patient rather than therapist versions are explored (Simmonds, Coid, Joseph, Marriott, & Tyrer, 2001). Therefore it can be concluded that there is, as Tait suggested in 2002, a need for an engagement scale measured from the patients‟ perspective (Tait, Birchwood & Trower, 2002) which has had patients involved in it‟s development.
.
The aim of the study was to develop and validate a patient-rated scale measuring engagement in psychosis. The objective was to develop a scale measuring engagement that has concurrent and predictive validity and to establish whether such a scale displays robust psychometric properties.
Methodology
The electronic databases Medline, EMBASE and PsychInfo were searched using the search terms “engagement”, “disengagement”, “drop-out”, “psychosis”, “alliance”, “compliance” and “adherence”. The literature review highlighted the complexity of the term engagement which has been assessed using a number of proxy measures such as attendance, satisfaction, therapeutic alliance, insight, and adherence. Individual statement items were devised for each of these variables in a draft scale. Advice at this stage was sought from a team of mental health researchers and the scale was discussed in a series of three meetings. The group included a research methods adviser and clinicians with experience of treating difficult to engage patients.
The draft scale was then refined in a series of focus groups with patients and former patients. Four focus groups were organised, each with between six and eight participants; two held at day centres, one at a day hospital, and one at a service-users group. Participants were asked for their views on the draft scale and to generate any further items. Comprehension and acceptability of the items were assessed. None of the initial 10 items were discarded although wording was modified. Six new items were added to the scale.
Subjects
Jarman Index of 23.1 and that 27% of the population have ancestral origin outside the UK; 5.4% Black Caribbean, 4.3% Black African, and 3.1% Indian (HMSO, 2001).
Inclusion criteria for entry into the study were
i) Inpatient on an acute general psychiatric ward for a minimum duration of 5 days. ii) A primary clinician-made diagnosis of psychosis
Patients unable to speak English were excluded.
Sampling
Each ward was visited twice a week when a researcher contacted the staff, establishing the diagnosis of all in-patients. Those with a diagnosis of psychosis were identified and the staff asked at each visit about their clinical condition. Once near discharge they were approached for informed consent. Ethical approval for the study was obtained from the Local Research Ethics Committee.
Interview
A semi-structured interview was carried out. Sociodemographic and clinical details were established and the subjects were asked to complete the SOLES, the Insight and Treatment Attitudes Questionnaire (ITAQ) (McEvoy et al., 1989), and the Helping Alliance Questionnaire (HAQ) (Priebe and Gruyters, 1993). Satisfaction with mental health services was rated by asking patients to rate their satisfaction on a 10-point scale; this has been demonstrated to have a good correlation with more structured assessments of satisfaction (Greenwood et al., 1999).
Predictive validity was tested by relating SOLES scores to drop-out and appointment attendance. At one year after discharge, between May 2003 and March 2004, notes of all patients were reviewed and the information gathered:
i) Whether the subjects had dropped out; defined as missing three consecutive appointments. ii) If subjects had dropped out, whether they then returned to contact with services or not (within the year) and if so whether this was voluntarily or by formal detention
iii) Proportion of appointments attended over one year: All appointments (outpatient
appointments, home visits and community visits) offered and kept were recorded to produce a ratio.
Reliability was established using split-half measure and Cronbach‟s alpha. Item-total correlations have been reported to establish that the items are sufficiently related to each other but do not exhibit signs of item redundancy (fall between 0.2 and 0.8). Validity was assessed by determining construct, concurrent, discriminant and predictive validity. Factor analysis was used to test for the presence of an underlying factor structure as engagement was felt to be potentially a multi-dimensional construct. The Velicer‟s minimum average partial (MAP) test and the parallel analysis test were used to guide the number of factors to be extracted (O'Connor, 2000). In the Velicer‟s MAP the average of the squared partial correlation is calculated after each of the components has been partialed out. When the minimum average squared partial correlation is reached, no further components are extracted. In the parallel analysis test the number of factors that account for more variance than the number of factors derived from random data is
calculated. These two methods are recommended to be used in conjunction (Zwick, 1986). Orthogonal rotation using the varimax procedure was used on extracted factors. The extracted and rotated factors were examined by identifying items with a rotated factor loading of 0.4 or greater. To establish concurrent validity Pearson correlation coefficients were tested between the mean overall SOLES, and those of the other scales. Predictive validity was determined by
disengagement, 1) disengaged over year, 2) attended less than 90% of appointments, and 3) engaged at one year, disengaged over one year, disengaged and sectioned back by one year. Univariate analysis was carried out first to explore which clinical and socio-demographic variables were related to the three outcomes. Those significant at the 10% level were entered into a logistic regression for outcomes 1 and 2, multinomial logistic regression for outcome 3, using a forward selection method. A further analysis explores how the mean levels of SOLES differ between the groups using two-sample t-tests for outcomes 1 and 2, and one way analysis of variance for outcome 3. ROC analysis was performed to suggest the optimal cut-off for the SOLES score. Discriminant validity established the relationship between sociodemographic factors and SOLES score, again using logistic regression after univariate analysis. Data analysis was done using SPSS16 for Windows.
Results
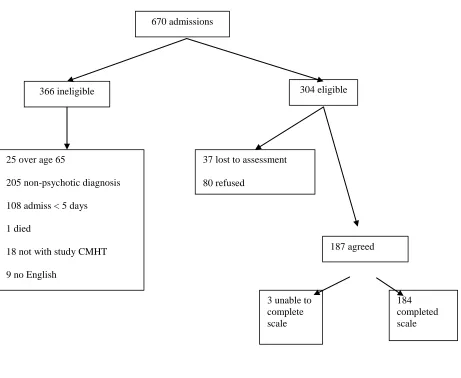
During the study period 670 patients had at least one admission. 304 subjects were eligible for inclusion in the study (see figure 1).
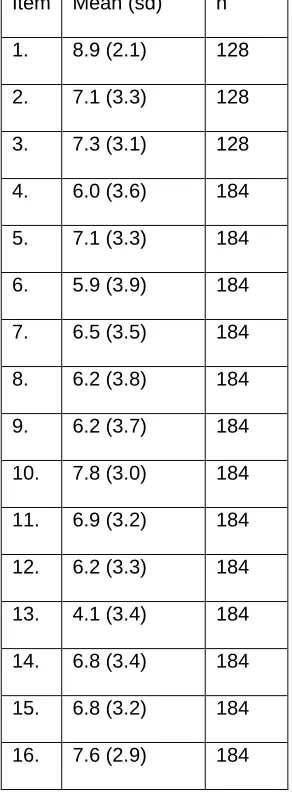
Fifty-six patients (36%) did not have a keyworker at the time of interview and couldn‟t answer the first three items; 128 subjects completed all of them. Mean and standard deviation of scores are reported in Table 2. The whole range of scores, 0 – 10, was used. Mean SOLES scores were obtained for all 184 subjects by calculating the mean of all non-missing items. Two versions of the SOLES are therefore proposed; SOLES16 and SOLES13 (the 13 item version for those who do not have a keyworker).
The SOLES13 and SOLES16 scales have 13 and 16 items respectively, each item scoring between 0 and 10 (see appendix 1). For one question, question 13, the score is reverse scored. Both SOLES13 and SOLES16 are calculated as the mean of all non-missing items and therefore have a range of 0-10, a higher score indicating better engagement. The mean SOLES16 score for the 128 subjects was 6.8 (SD 2.2), median score was 7.0. Both scales were normally distributed.
Reliability and validity
For the SOLES13 Guttman split-half was 0.80 and the Cronbach‟s alpha was 0.90. For the SOLES16 the Guttman split-half was 0.89 and the Cronbach‟s alpha was 0.91. Therefore both versions demonstrate high internal consistency. The item-total correlations ranged from 0.44 to 0.76 for SOLES13 and 0.23 to 0.76 for SOLES16.
Factor structure
The Velicer‟s MAP and the parallel analysis test identified that for both the SOLES13 and
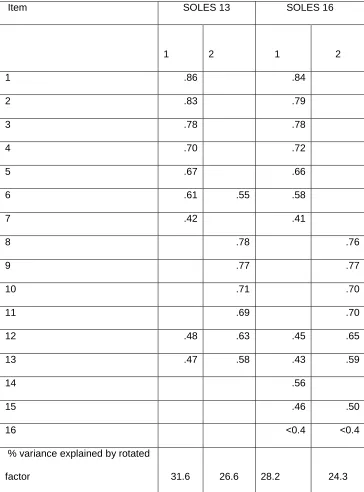
load significantly (>0.4) onto either factor. While there is some consistency in the factor structures the factors are not explicitly interpretable and subscales are not explored further.
Concurrent validity
Correlations were tested between scores on both versions of the SOLES and those on ITAQ, HAQ and satisfaction. All three measures were significantly correlated with the SOLES13 and SOLES16 scores, p<0.001. For the SOLES16 the Pearson correlations were 0.70 (95% CI 0.62- 0.77) for the HAQ, 0.73 (95% CI 0.66- 0.79) for the ITAQ and 0.68 (95% CI 0.57- 0.73) for the satisfaction scale. For SOLES13 the Pearson correlations were 0.69 (95% CI 0.61- 0.76) for the HAQ, 0.74 (95% CI 0.67-0.80) for the ITAQ and 0.67 (95% CI 0.58-0.74) for the satisfaction scale.
Predictive validity
A detailed description of clinical and sociodemographic factors predicting drop out will be reported elsewhere. Only two factors, after logistic regression, predicted drop out. These were substance use (OR 3.1, CI 1.4-7.0, p=0.005) and SOLES score (OR 1.4, CI 1.16-1.56, p=0.00). Poor appointment attendance was predicted by alcohol misuse (OR 2.92, CI 1.2-7.1, p=0.017) and SOLES score (OR 1.24, CI 1.1-1.4, p=0.004). Young age predicted being returned to contact by section (OR 1.11 CI 1.10-1.25, p=0.05). Thirty-eight of the 184 subjects dropped out over the year (20.6%). A t-test demonstrated that those who dropped out had a significantly lower SOLES13 and SOLES16 scores (SOLES13 mean for subjects dropping out: 4.9, SD. 1.9, n=38; those not dropping out: 6.9 SD. 2.2 n=146; t=4.9 df=182, p<0.001, SOLES16 mean for subjects dropping out: 5.5, SD. 1.8 n=24; those not dropping out: 7.1, SD. 2.1 n=106; t=3.3 df=128 p=0.001).
The proportion of appointments attended produced a bimodal distribution with a peak at 90% attendance and another at 10%. This outcome was therefore dichotomised. One hundred and twenty-two subjects (66%) attended more than 90% of appointments and 62 subjects (34%) attended less than 90% of appointments. A low SOLES13 and SOLES16 score was associated with poor attendance (mean SOLES13 score for over 90% attendance: 6.9, SD. 2.3, n=122; mean SOLES13 score for less than 90% attendance: 5.7, SD. 2.2 n=62; t=3.5 df=182, p=0.001; mean SOLES16 score for over 90% attendance: 7.1, SD. 2.2 n=89; mean SOLES16 score for less than 90% attendance: 6.2, SD. 2.2, n=41; t=2.3, df=128 p=0.025).
Subjects returned to contact by formal detention
The difference in mean SOLES13 and SOLES16 scores between subjects who (i) dropped out and were returned to contact by detention, (ii) those who dropped out and either were not seen within the follow-up period or returned to contact without formal detention, and (iii) those who did not drop out, can be seen in figure 2. Although there is some overlap of scores the trend seen is that of a relationship between SOLES score and engagement outcome. One-way analysis of variance showed that the mean scores differed significantly for both SOLES13 and SOLES16 (F=12.9, df=2, n=181, p<0.001 and F=6.3, df=2, n=127 p=0.003 respectively).
ROC analysis
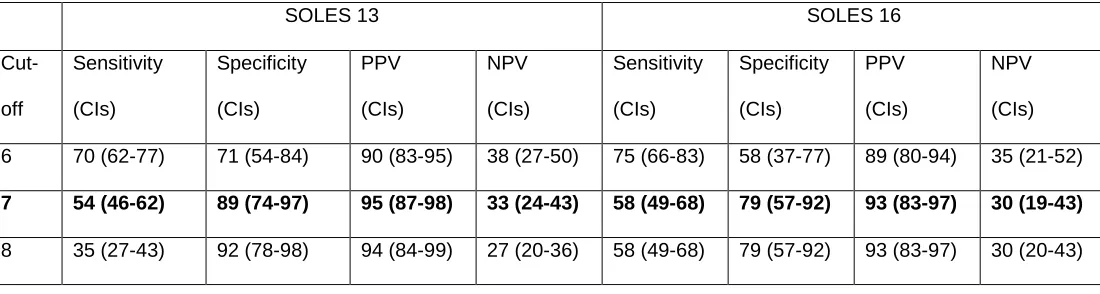
A ROC analysis was performed to establish the most appropriate cut-off point at which the SOLES predicts staying in contact. Staying in contact rather than dropping out as an outcome was chosen because the SOLES is designed as an engagement scale; higher scores
Discriminant Validity
When the relationship between the SOLES16 score (SOLES13 not reported here) and clinical
and sociodemographic factors was analysed at a cut-off of p=0.1 many variables were significant
but after multiple regression at a p-value of 0.05 the significant factors were diagnosis
(schizophrenia mean score 5.4, (CI 4.7-6.0), affective disorder 6.4 (CI 5.7-7.0), other psychotic
diagnosis 6.4 (CI 5.7-7.5)); substance use (substance use mean score 5.6 CI 4.9-6.4, no use
mean score 6.6, CI 6.0-7.1) and detention (detained mean score 5.6, CI 5.0-6.2, voluntary mean
score 6.6 CI 6.0-7.3).
Discussion
The SOLES is a new reliable and valid patient-rated scale predicting engagement.
The lack of a clearly accepted definition makes the validation of any engagement scale a
challenge; there is no accepted “gold standard” against which to measure the SOLES results.
There are conceptual difficulties in determining predictive validity since the status of engagement
may alter over time. The SOLES scores at the end of an admission did, however, relate to
whether subjects dropped out over the year and whether they attended appointments.
It may be viewed as a limitation that no diagnostic screening interview was used; a clinician made
diagnosis was felt to be appropriate. The study took place in one hospital in London so may not
be generalisable to other settings, for example rural rather than inner-city communities; the
SOLES needs to be validated in such settings.
The study had the strength of a large sample size and a diverse study population. Other strengths
include a relatively low refusal and high follow-up rate and, unlike in many studies, drop-out was a
The SOLES appears to be both valid and reliable. Factor analysis produced two constructs,
“acceptance of need for treatment” and “perceived benefit of treatment”, suggesting two main
components. Some of the items did not load on to either factor and consideration was given as to
whether they should be removed from the scale; however this would have impacted on the
scale’s predictive validity. As the factor solution is not readily interpretable it was felt that there
was insufficient evidence to promote subscales of the SOLES; further research is required to
explore the underlying factor structure in different populations.
The SOLES has internal consistency and concurrent validity when scores were compared to
related scales and was related to the outcomes; whether subjects dropped out over the
year, poor appointment attendance and if they dropped out needing to be returned to contact via
section. At a cut-off of seven the SOLES16 had a sensitivity of 54% (CI 46-62) and a specificity
of 89% (CI 74-97) to predict remaining in contact. The PPV and NPV results suggest that the
SOLES is better at predicting engagement that disengagement. The PPV of any scale depends
on the base rate of the outcome in the population. It should be clear that the SOLES is not just
about predicting dropout; the scores should be considered as a continuous variable and used as
a measure of engagement.
To some extent converting engagement into a numerical score simplifies a complex
phenomenon. Nevertheless scales are necessary in psychiatric research and clinical practice,
and the SOLES seems to capture the important elements encompassing engagement.
Useful scales exist but most are rated by professionals and the need for a validated patient-rated
scale has been highlighted (Tait, Birchwood & Trower, 2002). It is hoped that the SOLES will be
valuable both in clinical settings and as a tool to facilitate research in this important area.
Bale, R., Catty, J., Watt, H., & Burns T. (2006) Measure of the therapeutic relationship in severe psychotic illness: a comparison of two scales. International Journal of Social Psychiatry, 52 (3), 256-266.
Bindman, J., Johnson, S., Szmukler, G., Wright, S., Kuipers, E., Thornicroft, G., Bebbington, P. & Leese, M. (2000) Continuity of care and clinical outcome: a prospective cohort study. Soc
Psychiatry Psychiatric Epidemiology 35, 242-7.
Bowden, C. L., Schoenfeld, L. S. & Adams, R. L. (1980) A correlation between dropout status and improvement in a psychiatric clinic. Hospital and Community Psychiatry 31, 192-5.
Burns T, F. M. (2002) Ingredients and standards (model fidelity). In Assertive outreach in mental health: a manual for practitioners Oxford university Press, Oxford.
Gillespie, M., Smith J., Meaden A & Jones C (2004) Clients' engagement with assertive outreach services. Journal of Mental Health, 13, 439-452
Goodwin, I., Holmes, G., Cochrane, R. & Mason, O. (2003) The ability of adult mental health services to meet clients' attachment needs: the development and implementation of the Service Attachment Questionnaire. Psychological Psychotherapy 76, 145-61.
Greenwood, N., Key, A., Burns, T., Bristow, M. & Sedgwick, P. (1999) Satisfaction with in-patient psychiatric services. Relationship to patient and treatment factors. British Journal of Psychiatry 174, 159-63.
Hall, M., Meaden, A., Smith, J. & Jones, C. (2001) Brief report: the development and
psychometric properties of an observer-rated measurement of engagement with mental health services. Journal of Mental Health 10, 457-465.
Hellerstein, D. J., Rosenthal, R. N. & Miner, C. R. (2001) Integrating services for schizophrenia and substance abuse. Psychiatric Quarterly 72, 291-306.
HMSO (2001) 2001 Census. Ethnic group and country of birth. London.
Kirsh, B.,& Tate, E.(2006) Developing a comprehensive understanding of the workig alliance in the community. Qualitative Health Research, 16 (8), 1054-1074
Martin, D. J., Garske, J. P. & Davis, M. K. (2000) Relation of the therapeutic alliance with outcome and other variables: a meta-analytic review. Journal of Consulting Clinical Psychology 68, 438-50.
McEvoy, J. P., Freter, S., Everett, G., Geller, J. L., Appelbaum, P., Apperson, L. J. & Roth, L. (1989) Insight and the clinical outcome of schizophrenic patients. Journal of Nervous and Mental Disease 177, 48-51.
Meaden, A., Nithsdale, V., Rose, C., Smith, J., & Jones, C. (2004) Is engagement associated with outcome in assertive outreach? Journal of Mental Health 13, 415-424.
O'Brien, L. (2000) Nurse-clent relationships: The experience of community psychiatric nurses Journal of the Australian and New Zealand College os Mental Health Nurses, 9, 194.
O'Connor, B. P. (2000) SPSS and SAS programs for determining the number of components using parallel analysis and Velicer's map test. Behavior Research Methods, Instruments and Computers 32, 396-402.
Park, M. J., Tyrer, P., Elsworth, E., Fox, J., Ukoumunne, O. C. & MacDonald, A. (2002) The measurement of engagement in the homeless mentally ill: the Homeless Engagement and Acceptance Scale--HEAS. Psychological Medicine 32, 855-61.
Priebe, S. & Gruyters, T. (1993) The role of the helping alliance in psychiatric community care. A prospective study. Journal of Nervous & Mental Disease 181, 552-7.
Priebe, S., Watts, J., Chase, M & Matanov, A. (2005) Processes of disengagement and
engagement in assertive outreach patients: qualitative study. British Journal of Psychiatry, 187, 438-443
Sainsbury's Centre for Mental Health (1998). Keys to engagement: review of people with severe mental illness who are hard to engage with services.
Simmonds, S., Coid J., Joesph, P., Marriott, S., &Tyrer, P. (2001). Community mental health team management in severe mental illness: a systematic review. British Journal of Psychiatry, 178, 497-502.
Tait, L., Birchwood, M. and Trower, P. (2003) Predicting engagement with services for psychosis: insight, symptoms and recovery style. British Journal of Psychiatry 182, 123-8
Tait, L., Birchwood, M., & Trower P. (2002). A new scale (SES) to measure engagement with community mental health services. Journal of Mental Health, 2, 191-198.
Table 1 Characteristics of participants and non-participants
Participants (184) Number (%) Non-participants(120) Number (%) χ2/t Sig (p)
Gender Male 108 (58.7) 65 (50.4) 2.117 0.900
Age (yrs) mean (s.d)
38.2 (12) 38.4 (12) 0.270 0.789
Ethnicity White 52(28.3) 49 (38.0)
4.34 0.114
Asian 107 (58.2) 60 (46.5)
African/Caribb 25 (13.6) 20 915.5)
Marital status Single 128 (69.6) 84 (65.1)
.699 0.705 Married/cohab 28 (15.2) 22 (17.1)
Div/sep/widowed 28 (15.2) 23 (17.8) Employment Work 40 (21.7) 11 (8.8)
16.6 0.000 Training/education 12 (6.5) 1 (0.8)
Unemployed 132 (71.7) 113 (90.4)
Diagnosis Schizophrenia 96 (52.2) 82 (63.6) 4.107 0.134
Affective disorder 66 (35.9) 35 (27.1)
Other 22 (12.0) 12 (9.3)
MHA Section 106 (57.6) 95 (73.6) 8.485 0.004
All p-values relate to χ2
Figure 1 Subjects taking part in the study
670 admissions
366 ineligible 304 eligible
25 over age 65
205 non-psychotic diagnosis
108 admiss < 5 days
1 died
18 not with study CMHT
9 no English
37 lost to assessment
80 refused
187 agreed
184 completed scale 3 unable to
Table 2 Mean and standard deviation scores for each SOLES item.
Table 3 Factor analysis. Factor loading for each construct
1= Acceptance of need for treatment 2= Perceived benefit of treatment
Item SOLES 13 SOLES 16
1 2 1 2
1 .86 .84
2 .83 .79
3 .78 .78
4 .70 .72
5 .67 .66
6 .61 .55 .58
7 .42 .41
8 .78 .76
9 .77 .77
10 .71 .70
11 .69 .70
12 .48 .63 .45 .65
13 .47 .58 .43 .59
14 .56
15 .46 .50
16 <0.4 <0.4
% variance explained by rotated
Table 4 – Sensitivity, specificity, PPV’s and NPV’s of possible cut-offs for predicting
staying in contact
SOLES 13 SOLES 16
Cut-off
Sensitivity (CIs)
Specificity (CIs)
PPV (CIs)
NPV (CIs)
Sensitivity (CIs)
Specificity (CIs)
PPV (CIs)
NPV (CIs) 6 70 (62-77) 71 (54-84) 90 (83-95) 38 (27-50) 75 (66-83) 58 (37-77) 89 (80-94) 35 (21-52)
7 54 (46-62) 89 (74-97) 95 (87-98) 33 (24-43) 58 (49-68) 79 (57-92) 93 (83-97) 30 (19-43)
Appendix 1 The SOLES- The Singh O’Brien Level of Engagement Scale
Please rate from 0 to 10 your agreement with the following statements ---
0 1 2 3 4 5 6 7 8 9 10
not at all entirely
1. I attend appointments with my keyworker
2. I need to see my keyworker regularly
3. I find seeing my keyworker helpful
4. I need to be involved with mental health services
5. I have benefited from mental health services
6. I have a mental health problem
7. I find my psychiatrist helpful
8. I need to take psychiatric medication
9. I find psychiatric medication helpful
11. I feel I get enough practical support from mental health services
12. I feel I get enough emotional support from mental health services
13. I can cope by myself without contact from mental health services
14. Admissions to hospital have been helpful
15. I feel listened to by health professionals
16. I can get help from mental health services when I need it