Discovering behavioral
profiles for website visitors
of higher educations
Alireza Sadeghi Thesis Assignment
M.Sc. Business Administration - Strategic Marketing and Business
Information
April 3rd 2018
Supervisors: Dr. S.A De Vries
Dr. R.P.A. Loohuis
Faculty of Behavioural, Management, and Social Science
University of Twente
P.O. Box 217 7500 AE Enschede
2
Abstract
Several studies made attempts at using behavioural data to support business activities.
Some studies attempted to creating user profiles to identify potential customers to increase
customer spending and others have attempted to find the best performing algorithm to increase
the accuracy of preceding studies. The goal of this paper is to develop a framework for customer
profiling and customer attribute prediction within the marketing context using Machine
Learning and Customer attributes as well as developing a multi-step user profiling process
model for user profiling. The goal in this paper is to discover behavioural profiles of website
visitors for higher educations. Previous studies used Machine Learning and customer attributes
to identify the most profitable profiles of existing customers for the purpose of increasing
spending amount but this paper focuses on identifying behavioural profiles to increase customer
base and increase conversion rate. Thus, this study focusses on finding behavioural profiles
within website visitors for higher education by utilizing behavioural data and applying proposed
model and framework in this paper. The outcome provides insight for University of Twente
marketing department as to what behaviours lead to higher conversion. The paper proposes a
framework and a model, where the framework provides a guideline for different research goals
based on customer attributes & Machine Learning algorithms and the model provides a
guideline on the way customer data should be processed to gain a profound insight from data.
The analysis reveals three behavioural profiles for the website visitors of the University of
Twente by utilizing the framework and the model proposed in this paper. The outcome provides
evidence that the outcome is more profound when the proposed framework in combination with
proposed model is used compared to the previously one-step user profiling used in the literature.
Keywords: behavioural targeting; machine learning; behavioural profiling
3
Table of Contents
Abstract ... 2
Definition of terms ... 5
1. Introduction ... 7
2. Theoretical framework ... 11
2.1. Definition of Behaviour ... 11
2.2. Knowledge Discovery ... 13
2.3. Knowledge Discovery techniques ... 13
2.3.1. Unsupervised Machine Learning techniques... 14
2.3.2. Supervised Machine Learning techniques ... 15
2.4. Segmentation approaches ... 16
2.5. User profiling types ... 18
2.6. User profiling methods ... 19
2.7. Customer attributes ... 20
2.8. Data sources ... 23
2.9. Behavioural Features ... 25
2.10. Framework for user profiling and customer attribute prediction ... 26
2.11. Related research on user profiling ... 27
3. Methodology ... 32
3.1. Data & Data collection ... 32
3.2. Analysis Strategy ... 34
3.3. Cluster validity ... 37
3.3.1. Silhouette test (Homogeneity test) ... 37
3.3.2. Kruskal-Wallis test ... 38
3.3.3. Cross-validation ... 39
3.4. Behavioural Features ... 39
3.4.1. Explanatory variable ... 39
3.4.2. Behavioural and Behavioural Source Features ... 40
4. Results ... 43
4.1. Data Description ... 43
4.2. Calculating Wcss ... 45
4.3. Cluster analysis ... 46
4.3.1. Behaviour profiling of all visitors ... 46
4.3.2. Behaviour profiling of Indian visitors ... 51
4.3.3. Behaviour profiling on study levels ... 53
4.3.4. Interpretation of analyses ... 59
4.4. Clustering Validation ... 65
4.4.1. Kruskal-Wallis test ... 65
4
4.4.3. Cross-Validation... 67
5. Discussion ... 68
6. Conclusion ... 70
6.1. Theoretical Implication ... 71
6.2. Practical Implication ... 72
6.3. Future research and Research Limitation ... 73
7. Reference ... 76
8. Appendixes ... 84
Appendix 1………84
Appendix 2………84
Appendix3………85
5
Definition of terms
Behavioural targeting: Behavioural targeting or BT is a technique used by marketers, which
belongs to the branch of targeted advertisement. In BT, marketers make use of users data such
as visited websites, the amount of time spent on each website or otherwise known as browsing
behaviour to target the most appropriate visitors/customers (Chen & Stallaert, 2014).
Behavioural targeting is also known as Online behavioural advertising (OBA).
Cookie: is a small file that is downloaded into computers when users access certain websites.
These files enable websites to identify user’s computers. Cookies carry a modest amount of
data, which can be accessed either by web server or the client computer (FESBAL, 2013). They
have a number of applications, which one of them is in Behavioural targeting. By using the
user-specific information, content and advertisement are tailored to interests of individuals
visitor(Bureau, 2014).
Conversion rate: Conversion rate is the process of turning a website visitor into a paying
customer. The usage of this term is contingent on the nature of websites where some consider
it to be a result other than sales(“Conversion Rate,” 2017).An example of desired actions
includes but is not limited to memberships, registration, newsletter subscriptions. A way of
increasing the interest level of a visitor is to match with the right visitor or another way around,
adjust the website content to the visitor (“Conversion Rate,” 2017).
Click-through rate (CTR): is the rate where the paid-per-click advertisement is clicked. Often
it is a measurement way of advertisement success. Normally, a high CTR indicates that the
advertisement is been relevant to the chosen audience(“Click-through rate (CTR): Definition,”
2017). A result, it is often used in measuring the success of BT advertisement. It is computed
from the number of times that an advertisement has been clicked divided by the number of
6
CLUTO: is a software package that enables clustering of low and high dimensional data set
and the characteristic of various clusters(“CLUTO - Software for Clustering High-Dimensional
7
1. Introduction
Nowadays, organizations have access to vast amount of data about their customers and
utilizing such data in a meaningful way, could excel marketing processes (Terradata, 2015).
However, the majority of marketers consider online data as one of the most underutilized
sources of information in organizations (Terradata, 2015). In addition, the number of people
who use the Internet in the world has grown by almost 69% from 2010 to 2016 (Internet Users,
2017). If this growth is by any means an indication of the user-generated data velocity, then the
importance of utilizing such data must be emphasized and explored.
Moreover, organizations are overwhelmed by the volume and velocity of generated
customer data or in general Big Data. They are often unable to gain any meaningful insight
from Big Data. For this reason, it is important to outline an overview of approaches to
knowledge discovery from Big Data. Such overview assists organizations to gain valuable
insight from various Big Data sources so that it could be used to support decision making in
various business areas, especially in the marketing field. It is well known that much of the
marketing effort and budget is wasted on the wrong audiences. Therefore, by applying
appropriate approaches to customer data, marketing departments can readjust their effort to be
more efficient and effective. Furthermore, many SME’s are faced with financial or resource
limitations ( such as time or personnel limitation) for marketing and advertising (Blackboard,
2014). Consequently, organizations often use BT tools in a very generic way or as an alternative
to offline marketing.
The premise of BT is to distinguish the individualistic differences (whether behaviour or
interest) between two seemingly identical customers. Such differences can only be identified
when customers are analyzed in a more complex manner that yields profound yet
understandable insight. Traditional segmentation methods are too crude and ignore such
8
means of target audience persona creation based on marketing tools like surveys. Such
approaches to user profiling do not acknowledge the difference in seemingly identical
customers, which is often the result of focusing and relying on explicit customer information.
However, Behavioral targeting incorporates implicit customer data, which allows marketers to
realize subtle individualist differences and leverage them to deliver more relevant
advertisements to relevant potential customers. Often individualistic differences are discovered
as a result of analysing implicit user data such as user browsing history and search behaviour
(Chen & Stallaert, 2014).
Therefore, defining a framework of BT can empower SMEs and as a result, it could
potentially lower their entry barrier due to resource limitations. Moreover, a good understanding
of various approaches on how to leverage customer data can assist all businesses in decision
makings. In addition, insight generated by analysing Big Data using proposed models in this
paper could lead to the discovery of underserved customer segment(s), where an appropriate
analysis such as sequence analysis can lead to the development of a plan that attends the needs
of underserved customers.
A great deal of existing research is about the effectiveness, efficiency, accuracy of
different behavioural techniques and its value in terms of improving online advertising. For
instance, Goldfarb & Tucker (2011) observed that users are less likely to buy products, after
viewing an advertisement that is not interest-based targeted. Furthermore, (Yan et al.,
2009)state BT increases the effectiveness of advertisement with the measure of CTR, by 670%.
Other researchers of BT addressed different segmentation attributes, techniques, methods and
the ways algorithms improve efficiency and accuracy of segmentation. However, none have
outlined an overview of various approaches to user profiling (also known as segmentation) and
9
failed to acknowledge the different types of customer data and the processing sequence of such
data for user profiling.
The goal of this paper is to develop a framework for customer profiling and customer
attribute prediction, within the marketing context using Machine Learning and customer
attributes, as well as developing a multi-step User profiling process model for user profiling. In
addition, the aim is to discover behavioural profiles of website visitors for higher educations
based on data-driven characteristics. The outcome would ideally reveal the behavioural profiles
of website visitors for the University of Twente. Such profiles provide insight about (offline
and online) behavioural patterns of potential visitors. In turn, future research could use such
insight to identify the granular patterns and behavioural sequences of desired groups, to create
customised marketing campaigns.
Research Question: What are the behavioural profiles of website visitors in higher education?
In order to answer the main research question, the following questions need to be addressed:
I. What customer attributes can be used for profiling?
II. How can behavioural profiles be identified?
III. Are discovered behavioural user profile consistent when controlling for different
factors?
In order to realise this paper’s objective, the relevant literature regarding segmentation such
as user profiling and, Machine Learning algorithms are reviewed. However, the core literature
for this study is user segmentation, user profiling and finding appropriate attributes and methods
for behavioural user profiling to enhance online targeting strategies.
The data used in this paper are from the University of Twente, therefore making this paper
a case study. Therefore, this paper provides insight into how visitors’ data of the University of
Twente can be leveraged to create behavioural profiles. This paper is an explorative case study,
10
paper is secondary data of the University of Twente’ website and its business data (CRM
database).
This paper attempts to close the gap in the literature by developing a framework on various
approaches on how customer attributes can be leveraged to gain insight for supporting business
activities, specifically for user profiling and prediction for use in online targeting approach. The
application for such analysis in marketing field is to gain profound and meaningful insight on
visitors’ groups with similar characteristic and use such insight to create accurate and efficient
BT campaigns. Furthermore, this study lay the foundation for future research, whereby analysis
on a desirable profile could provide a detailed understanding of visitors in terms of the sequence
and temporal behaviour manifested.
The paper is organised into 5 chapters and it is structured as follows. The next chapter covers
the theoretical framework, which is the literature review of prior research on topics such as
Behavioural targeting, Machine learning algorithm, knowledge discovery in Big Data and user
segmentation. Next chapter outlines the methodology of this paper. It expands on the nature of
data and its collection method, analysis strategy and (behavioural) attributes used to conduct
the analysis. The following chapter describes the result of all analyses, where the outcome of
each analysis is presented. Within the same chapter, the results are visualized in a side by side
manner to assist interpretation. In the last chapter, conclusions and discussions are presented as
11
2. Theoretical framework
In order to achieve the goals of this paper, various aspects need to be outlined such as the
definition of behaviour, various Machine Learning algorithm, customer attributes. This chapter
presents various core literature used in this paper. Each section represents a relevant aspect of
core literature that allows the researcher to propose the framework and model presented at the
end of the chapter and to conduct its analysis and to propose. As result, the relevant literature
regarding each aspect is summarized and discussed briefly in each section.
2.1. Definition of Behaviour
Before being able to discover the Behavioural user profiles, one needs to understand and
define behaviour in the first place. Therefore, here in this section, the definition of behaviour
for this paper is elaborated. In the traditional sense, a behaviour is the manner whereby a system
or a being interact or react to another one. It is known by the actions and manner that such
beings interact with their environment (Cao, 2014). Behaviours in the non-digital world have
been vastly studied from different aspect due to their explicitness (Cao, 2014). However, with
advancement in technology, behaviour takes very complex forms as it includes the digital
implicit form such as the way individuals seek out information or react to the digital or physical
environment. Behaviours which are recorded in digital form are often referred to as “Soft
behaviour” (Cao, 2014). Cao (2014) refers to such behaviours in the digital era as “Behaviour
Computing” or “Behaviour Information”. He states that such behaviours consist of
“Methodologies, techniques and practical tools for representing, modelling, analysing, learning,
discovering, and utilizing human, or animal, organization, social, artificial , and virtual
behaviours, behavioural interaction and relationships, behavioural networks , behavioural
patterns and behavioural impacts” (Cao & Yu, 2012).
In the field of behaviour informatics, Cao (2010) defines behaviour as “activities that
12
and environment in either virtual or physical organization”. Understudying behaviour
computing provide opportunity improvement and discovery of certain behaviours/behavioural
pattern that could be used for different application for management and business intelligence
(Cao, 2014). Cao & Yu (2012) propose a different way of looking at the behaviours of
individuals. Many researchers used to look and study behaviours in a qualitative manner,
however, Cao & Yu (2012) propose a quantitative way of studying behaviour in order to
discover knowledge.
Fayyad, Piatetsky-Shapiro, & Smyth (1996) describe the pattern as “an expression in
some language describing a subset of the data or a model applicable to the subset”. They
underline that the unravelled patterns must be valid to some degree on new data, be novel and
understandable that could provide useful information that benefits users and/or tasks. Therefore,
they conclude that for any pattern to be considered as knowledge, it needs to pass a certain
threshold to provide useful information (Fayyad et al., 1996).
In conclusion, this paper uses the definition of behaviour proposed by Cao (2010) as
“activities that present as actions, operations, events or sequences conducted by humans in a
specific context and the environment in either virtual or physical organization”. In digital form,
an example of behaviour includes actions and operations that visitors manifest while browsing
the website of higher education in order to gather information. A bundle of behaviours (either
in the digital or physical environment) represent a behavioural pattern of website visitors, which
is how behavioural user profiles are depicted in this paper. To discover behavioural profiles
(which is based on behavioural patterns) of website visitors for higher educations, a certain
technique needs to be applied to behavioural data in order to extract meaningful insight. The
next section summarizes the fundamentals of such techniques (generally is known as
Knowledge Discovery processes) that allows information to be extracted from raw databases,
13
2.2. Knowledge Discovery
As mentioned in the previous section, certain techniques need to be applied to data (which
in this study is visitor’s behavioural data) to extract meaningful yet profound informative
insight. Fayyad et al. (1996) coined the term Knowledge Discovery that compromises the
collection of aforementioned techniques and segregated it into two main categories. This
section elaborates on fundamental categories of Knowledge Discovery, which assists in
identifying appropriate techniques for the research goal, namely segmentation and prediction
of customer attributes.
Fayyad et al. (1996) define two main broad categories of knowledge discovery namely,
Verification and Discovery. The first category, namely Verification, is used to prove or disprove
a hypothesis. The second category, namely Discovery is used to discover pattern within data.
Moreover, Fayyad et al. (1996) segregate the Discovery category into two sub-categories of
Prediction and Descriptive. In the Prediction sub-category, patterns and variables (such as
behaviour or spending amount) are used to predict a future event whereas the Descriptive
sub-category unravel the naturally occurring patterns in a way that is untestable for an analyst with
use of various methods and techniques (Fayyad et al., 1996).
In conclusion, two sub-categories relevant for this study are Predictive & Descriptive. The
techniques in Descriptive sub-category can be used for segmentation, where techniques in the
Predictive sub-category can be used for customer attribute prediction. The main techniques for
the Predictive and Descriptive sub-categories are outlined in the following section.
2.3. Knowledge Discovery techniques
This section describes the main (Machine Learning algorithm) techniques used for the two
subcategories of Discovery, namely Descriptive and Predictive. Outlining (Machine Learning)
techniques of each aforementioned category expands on the previous section by describing the
14
completely dependent on the goal of each individual research. However, in order to provide an
overview of different approaches later in this chapter, techniques from both categories are
elaborated here.
Generally, Machine Learning techniques are divided into two main categories of
Unsupervised and Supervised (Doig, 2015). The Unsupervised Machine Learning corresponds
to the Descriptive sub-category described by Fayyad et al.( 1996). In this category of Machine
learning the algorithm finds natural occurring patterns among data. The second category,
namely Unsupervised, corresponds to Predictive subcategory described by Fayyad et al. (1996).
This category of Machine Learning algorithm classifies or identifies certain events or groups
of people within the database based on certain features. This type of Machine Learning uses the
occurrence of certain (desirable) events , based past historical data, to predict a future event.
Here below, first the Unsupervised Machine Learning techniques are stated followed by
Supervised Machine Learning techniques.
2.3.1. Unsupervised Machine Learning techniques
Clustering techniques and its variation are Unsupervised Machine Learning techniques,
which are often used to find the natural or arbitrary structural pattern in data is determined using
distances between data entries. The Non-probability variation of this technique allows cases to
belong to only one group at a time and it is often referred as Hard clustering. Depending on the
objective and the goal of an analysis, this could be considered as a limitation of
Non-probabilistic variation of this technique. For instance, people have multiple dynamic interests
where it changes over a period. However, Hard Clustering technique group visitors based on
user behaviour at a certain collection time. This generates a rather a static image of visitor’s
behaviour that might be irrelevant after a while if the website content changes dramatically.
Nevertheless, knowledge discovered as a result of processing data with Hard clustering
15
The two sub-types of Non-probabilistic variation of clustering technique are
Hierarchical and Non-hierarchical (Hui, 2017). In the Hierarchical technique, prior knowledge
about the number of groups is not required, as the algorithm can calculate the ideal number of
clusters. However, this technique is not suitable for analysing large databases, as it requires
high computational power. For analysing high-dimensional large datasets, Non-hierarchical
such as K-means or K-modes is commonly used. However, such technique requires prior
knowledge regarding the appropriate number of groups. Nonetheless, sometimes such
knowledge on the number of groups is not known and therefore an additional test is required to
determine the number of groups. An example of such test to determine the appropriate number
of groups is ‘within-cluster sum of squares’ also known as Wcss (Dao, Duong, & Vrain, 2015).
This score measures the within-cluster distance of observations from their centroid. The aim of
this test is to reduce the distance between observation in each cluster to a reasonable degree.
The exact point number of groups is determined by visualization of the Wcss score on a Scree
plot by employing the Elbow method. In this method, the appropriate number of groups is the
point in the graph, where the Wcss score does not change dramatically (Asanka, 2017).
2.3.2. Supervised Machine Learning techniques
Classification is a (Supervised) Machine Learning algorithm that partition data set based
on certain user pre-defined labels (Hand, 1981). Classification is a form of predictive technique
that partition data into categorical variables. In order to predict a numerical, real-value variable
a Regression technique (Multiple regression or Linear regression) is used to estimate the
outcome based on new data. One of the popular Classification technique is called Decision tree.
This technique makes use of recursive partitioning to divide the observations by data-driven
threshold for each variable in multiple levels (Chorianopoulos, 2016). This technique could be
16
This section outlines various Knowledge Discovery techniques described by Fayyad et al.
(1996), which are known as Machine Learning techniques in the IT field. The two main types
of Machine learning algorithms are Unsupervised and Supervised. Describing allows for better
understanding of each technique, which also lays the foundation for identifying the appropriate
technique to achieve the goal of this paper. However, further information is required for a good
understanding of how segmentation and user profiling ought to be done. Therefore, the next
section outlines the common approaches to segmentation based on the literature.
2.4. Segmentation approaches
In order to create user profiles, different approaches of segmentation must be realized. This
is important as the outcome of user profiling should be simple and profound, yet not generic.
Therefore, understanding various segmentation approaches allows for a realization of an
approach that strikes the right balance, where outcomes are simple to understand and yet
profound. In general, segmentation takes two main forms and they are as follow (Boratto, Carta,
Fenu, & Saia, 2016; Dolnicar, 2008):
• Apriori (Common-sense)
• Posteriori (Post-hoc, Data-driven)
In the Posteriori approach, users are grouped based on data-driven similarities. So as, users
are segmented into groups based on the between user's similarities. This approach generates a
user profile outcome, that is not easily interpretable. However, it has the ability to reveal hidden
relations among users that are overlooked by the typical (Common-sense) segmentation
approach. A common technique for the Posteriori approach is Cluster analysis. In contrast, the
Apriori approach does not take advantage of data-driven segmentation, thus runs the risk of
superficial or generic clusters.
In an effort to address the shortcomings of the Apriori and Posteriori approaches, Dolnicar
17
two-step approach by using the combination of two aforementioned approaches. Thus, his
four-approach concept is as following:
• Apriori-Posteriori
• Apriori - Apriori
• Posteriori- Apriori
• Posteriori- Posteriori
These approaches are written in the sequence that they are ought to be applied and used.
Meaning that in the first approach, the segmentation process beings with common-sense
(Apriori) segmentation and then each segment is divided into more refined sub-segment by
using Posteriori (Dolničar, 2004). Using the proposed approaches generates the benefit of
potentially revealing hidden segments and provide easy interpretation to those segments.
In conclusion, there are three approaches to segmentation, namely Apriori, Posteriori and
Hybrid. The first approach, Apriori, allows for a segmentation that is simplistic but logical and
is often based on certain prior knowledge. The second approach, Posteriori, allows for a
segmentation that can be sometimes counter-intuitive and profound, but difficult to understand.
The third approach proposed by Dolnicar (2008), Hybrid, allows for a segmentation that utilizes
the prior two approach to achieve a segmentation , which is simple to understand yet generates
profound insight. The last approach is an interesting approach to segmentation. However, this
approach fails to acknowledge how different user data can be used to generate a more realistic
and accurate segmentation result. Therefore, the following section outlines various user
18
2.5. User profiling types
The previous section outlined and discussed various approaches to segmentation. However,
as stated before, such approaches failed to account for the user data types in segmentation. This
section expands on this by outlining user profiling types (also known as user segmentation
types) based on different type of user data. Kanoje, Girase, & Mukhopadhyay (2014) describe
two types of user profiling. One is based on the Explicit (traditional) user profiling, where
websites ask users about their interest and preference to create or find their user profile. This is
done to provide relevant content and setting to users. However, Explicit user profiling is often
inaccurate since many users are unwilling to give out (personal) information due to privacy
concerns.
The second type of user profiling, overcomes this issue by using Implicit data of users
(Kanoje et al., 2014). This type relies on the interaction of users with the website or otherwise
known in this paper as user behaviour. This type of data is richer source of user data, as it
provides more detail about users. However, such user profiling using Implicit data might not
always be easily interpretable, thus Hybrid user profiling is proposed to overcome
interpretability issue of two aforementioned user profiling types.
Khosrow-pour (2009) proposes the third type, so-called Hybrid profiling, which is the
combination of the previous two types. He states that the efficiency and accuracy of the user
profiles are dependent on the quality and the amount of available data (Khosrow-Pour, 2009).
By combining the two aforementioned types, user profiles would reflect more accurate and
realistic preference of users. A summary of user profiling types can be found in appendix 1
(Khosrow-Pour, 2009).
In conclusion, the three user profiling types indicate that data types are important in creating
meaningful and accurate user profiles. The Hybrid profiling addresses the shortcoming of user
19
accurate, simple and yet profound user profile. Nonetheless, realizing the user profiling
approaches and its types is not sufficient to create accurate user profiles. To do so, user profiling
methods should be realized and understood, which provides context to user profiles and assists
in their interpretation. Thus, the next section outlines and describes various user profiling
methods.
2.6. User profiling methods
Cufoglu (2014) proposes three user profiling methods. The first type is called
Content-based, which assumes that a person behaves the same, under the same circumstance. Therefore,
a user’s behaviour is predicted from its past behaviour (Araniti, De Meo, Iera, & Ursino, 2003;
GODOY & AMANDI, 2005; Kuflik & Shoval, 2000). The second type is called Collaborative
(also known as collaborative filtering), which is based on assumption that users who exhibit
similar behaviours belong to same groups (e.g. sex, age social class), or in other words belong
to the same profiles (Araniti et al., 2003; GODOY & AMANDI, 2005; Kuflik & Shoval, 2000).
This type basically states, that people with similar characteristics tend to be similar.
Furthermore, Cufoglu (2014) proposes the third method, namely the Hybrid method, which
takes advantage of combining the previous typed. This type generates accurate user profiles by
revealing the true interests and preferences of users. Poo, Chng, & Goh (2003) segregated this
type further into two main categories They distinguish two main categories for the Hybrid
method, namely Static-profiling and Dynamic profiling. Poo, Chng, & Goh (2003) propose 4
sub-types for Hybrid method based on Content-based and Collaborative. They call recognize
them as following: Static content profiling, Dynamic content profiling, Static collaborative
profiling and Dynamic collaborative profiling. The four subtypes of the Hybrid method
proposed by Poo et al. (2003) can be found in Appendix 2 and the summary of user profiling
20
In conclusion, the Hybrid method is a comprehensive method that combines collaborative
and content-based methods to utilize the strength of each user profiling method to overcome
the shortcomings of each individual method. In addition, it accounts for the time perspective,
by dividing Hybrid method into two sub-types of Static and Dynamic. Each sub-type allows for
a more precise and accurate user profiling, that enables development of a user profiling strategy.
Nonetheless, in order to create user profiles, various customer attributes need to be realized and
outlined. Such attributes are outlined in the following section.
2.7. Customer attributes
In this section, various customer attributes used for user profiling in the literature are
mentioned and defined briefly. It is important to know and recognize different customer
attributes, as utilizing each or multiple of them yield a different image of users and as
subsequent user profiles. Below, customer attributes used in the literature for user profiling can
be found.
Demographic
This attribute enables advertisers to segment audience into meaningful target groups based
on their demographic. Example of Demographic information are audiences’ age, gender and
income (Chen & Stallaert, 2014).
Geographic
Geographic or Geo-Targeting refers to a location attribute, which advertisement is based on
the location of publisher’s page or visitor in order to deliver the relevant advertisement. This is
usually done based on the country of the visitor, city, postcode, IP address and other criteria
21
Psychographic
Psychographic attribute segregates potential users by their lifestyle, attitude, style and
psychological traits. In turn, firms use such information to offer products tailored to the psyche
of each user. Typical psychographic segmentation attributes are Interest, Opinion, Activities
(IOA), activities and values. This approach is slightly different than that of Behavioural
targeting attributes and it might be easily mistaken with BT. Psychographic approach divides
users based on attributes such as personality traits, lifestyles, the degree of loyalty whereas BT
attribute segregates customers based on information such as buying occasion, benefit sought
(Directive Group, 2017).
Behavioural
Behavioural attributes allow for pattern recognition based on observed unconscious
user-specific behaviour in a browsing session by analysing variables such as visit frequency, usage
rate, benefit sought, occasion, user status, brand loyalty (Baranowska, 2014; Local Drirective,
2017). In turn, such attributes used to reveal patterns to group users with similar pattern
together, otherwise stated, to identify narrower subgroups by combining other segmentation
types (Local Drirective, 2017).
Daypart
This attribute, which was initially used in broadcasting, empowers marketers to break the
day into several parts. Examples of Daypart segments are such as Morning drive, Daytime,
Afternoon (Morning & Morning, 2017). By utilizing Daypart attributes, businesses are able to
fine-tune their service to the desired audience. Each category of Daypart has an audience with
specific characteristics, which is appropriate for certain products using different mediums (for
Instance TV, Radio, Mobile). Therefore , businesses could refine their targeting by
22
In addition, advertising agencies are able to set a price for time slots and prioritize relevant
content. As a result, knowledge could be discovered by analysing characteristics and the need
of each Daypart segment (Leon, 2016). For instance, it is a known fact that the white-collar
audience uses the internet a lot, it starts with a higher audience than television in the morning
then soars up during mid-day and declines afterwards. Such information is very insightful in
refining and targeting the desired audience (Plummer et al., 2007).
Affinity
Customers are known to have a preference and disposition towards certain brands, websites
and services. In Affinity-targeting, the knowledge of customer’s affinity is used to build indexes
and profiles. In turn, such indexes and profiles are used for instance to find other users with
similar affinity (Plummer et al., 2007). Furthermore, the knowledge of users’ affinity can
potentially unravel other characteristics that are associated with each brand or website. In the
same manner, that viewers of certain news channels have common political views, it can be
said that the political views or other desired views of individual users can be identified solely
based on the type and frequency of visited websites.
Purchase-based
This attribute is used with the assumption that customers with similar purchasing
characteristics tend to exhibit similar purchases (Dibb & Simkin, 1996). An example of
Purchase-based attributes are items purchased and the monetary transaction associated with the
history of customers. Furthermore, by utilizing such attributes businesses are able to create user
profiles and use them to offer products or services that closely resemble users’ characteristics
(Tsai & Chiu, 2004). The utilization of Purchased-based attributes requires a business to
understand its customer well, for building accurate Purchased-based profiles (Plummer et al.,
23
All in all, there are 7 attributes mentioned in the literature, where each indicates a different
aspect of customers. Realizing various customer attributes is necessary for developing an
approach overview, which is given later in this chapter. In addition, it is interesting to realize
various data sources that customer attributes could be retrieved from. The following section
outlines various data sources.
2.8. Data sources
Understanding various customer attributes provides a solid foundation to draw a
comprehensive overview of various approaches, for achieving the goals of this paper.
Nevertheless, it is just as important to outline data sources of customer attributes. This
knowledge assists researchers by providing a guideline on various data sources. In the literature
3 sources of data is mentioned, namely Web data, Business data and Meta data. Each data
source is mentioned and briefly described below.
Web data
Web data typically comes in three forms. They are Log files, Cookies and Query data
(Araya, Silva, & Weber, 2004). Cookies have many types and sub-types of its own and one of
them is “First-party” Cookies. First-party Cookies are created by the same domain that a user
visit. In this sub-type of Cookies, data is gathered by a single publisher (a single website) using
different technologies such as Cookies, tracking pixels and an agent. Due to obvious reasons,
the scope of information available from this sub-type of Cookies is limited. Data gathered by
First-party Cookies often does not reflect the true and comprehensive interest or opinion of
users. However, users’ behaviour on a single website, provide its owner with knowledge and
capability to improve for instance user experience (Plummer et al., 2007).
Query data is generated when visitors use the search function of websites. Each search term
is gathered and stored in a file. Such data could be an indication of users’ interest (Araya et al.,
24
data of users in detail (Araya et al., 2004). Although, this sub-type of Web data gathers detailed
data on users, it is full of unnecessary data and contains quite a lot of noise. Therefore, usually,
Cookies are a much easier and comprehensible source of data for an analysis.
Business Data
Back-end customer data can be used in combination with other sources of data to extract
knowledge and understand behaviours associated with website navigation. Moreover,
Businesses can identify and assign associate CRM profiles to profiles generated by Web data
(Fennemore, 2011). According to a survey, about 55% of higher educations are not using CRM
data for marketing and enrolment purposes (Blackboard, 2014). Business data include a range
of information such as customer demographics and product information (Araya et al., 2004).
Meta Data
This type of data is generally used to describe data that embodies the structure and the
content of websites (Araya et al., 2004). There are many Meta data features that can potentially
provide knowledge by using it in combination with other data sources. Examples of
sub-categories of Meta data include Structure data, Content data, Website network data and in
general any data regarding the overview of the website and its pages (Araya et al., 2004).
Furthermore, Content data mentioned earlier includes data such as images, brochures and free
text within websites and their web pages (Araya et al., 2004).
In conclusion, each of the three aforementioned data sources provides different level of
detail of user data. Understanding, various data sources and their scope provides knowledge
that allows researchers to choose one or combination of data sources to achieve their research
goal. However, in order to achieve the aim of this paper, the behavioural features used in the
literature must be reviewed. Such knowledge provides insight as to what behavioural features
25
appropriate for attaining the aim of this paper. The following section briefly discusses the
behavioural features used by previous researchers.
2.9. Behavioural Features
As mentioned in the preceding section, knowing various behavioural features utilized by
previous research, provide insight into the appropriate behavioural features for realizing the aim
of this paper. Various research is dedicated to the study of the users’ behavioural features for
the purpose of user profiling (Boratto et al., 2016). Previous researchers made use of many
features for the purpose of User profiling, by implementing various methods and techniques,
which are described later. A number of users’ behavioural features are mentioned below. As
expressed before, the basic assumptions in using below-mentioned variables, are that users,
who have similar features tend to manifest similar behaviours and vice versa (Dibb & Simkin,
1996; Tsai & Chiu, 2004).
Below, various behavioural features used in Behavioural targeting studies are mentioned
(Baranowska, 2014; Castelluccia, 2012; Chopra, 2012; Deane, Meuer, & Teets, 2011; Dibb &
Simkin, 1996; Jaworska & Sydow, 2008; Pandey et al., 2011; Plummer et al., 2007; Tsai &
Chiu, 2004):
Website topic keyword
Types of visited website
Visited content
Frequency of visit
Time spent on each page
Time spent in each
session
Searched keywords
Usage rate
Historical user activity
Purchasing activity Navigational behaviour Benefit sought Brand loyalty User status Occasion
Time of logins
Date Ads clicked Clickstream Device Campaigns Referring URL Location
Sequence of page visited
Frequent mode of ad
placement
26
2.10. Framework for user profiling and customer attribute prediction
In this section, two models are developed to visualize strategies to user profiling based and
customer attributes prediction, using two main categories of Machine Learning and customer
attributes. The customer attributes are arranged from Explicit to Implicit order. The cells below
each customer attribute (such as Demographics, Geographic) in figure 1, represent a strategy to
either user profiling or customer attribute prediction. Each strategy is developed with a specific
Machine Learning technique for the purpose of Knowledge Discovery from data. The first row
represents Unsupervised Machine Learning algorithm such as clustering algorithm that allows
User profiling. Clustering algorithms are generally divided into two main types, namely
Hierarchical and Non-hierarchical. The basis for choosing such types depends on the volume
and complexity of data, as shown in the model below. It is worth to point out that
Non-hierarchical type has two sub-categories of Non-probability such as K-means and K-modes and
Probability such as Gaussian mixture model and Naïve Bayes. However, the researcher of this
paper chooses to focus on the Non-probability sub-category of Non-hierarchical.
Furthermore, solely relying on customer attributes and techniques shown in the figure
above, does not yield a profound outcome, but rather often yield simplistic results. For instance,
strategies shown in figure 1 for user profiling does not account the nature of user data (Implicit
vs Explicit) or segmentation approach (Posteriori vs Apriori). As a result, a model based on the
proposed Hybrid user profiling type of Khosrow-Pour (2009) and proposed two-step
segmentation approach of Dolnicar (2008) is proposed to address this gap. This model, as
Machine learning
algorithm (ML) Data type condition ML Technique
Low volume & low dimensional (<1000 entries)
Hierarchical Clustering +
Non-hierarchical Clustering
High volume & high dimensional (+1000 entries)
Wcss + Non-hierarchical Clustering
Categorical dependent feature Classification
Continuous dependent feature Regression
<--->
Segment users based on their psyche attributes Supervised Predicting demographic of users Predicting location of users Predicting user's time of consumption/Usag
e of a product or service
Predict user's interest in a brand
Predicting user's probability of purchasing a product/service Predicting user behaviour profile/a desired behaviour Predicting users' psyche Unsupervised Segment users based on Demographics Segment users based on their geographical
location
Segmenting users based on time consumption/
Usage
Segmenting users based on similarity in brand affinity
Segmenting users based on their
purchasing behaviour
Segmenting users based on user
behaviour
27
shown in figure 2, outlines various user profiling processes. It illustrates various possibilities
of user profiling processes that are complementary to the framework depicted in the figure 1.
In the model shown in figure 2, user data is categorized into two types of Explicit and
Implicit as described by Kanoje et al. (2014). To recap, the Explicit data is provided voluntarily
by users from website forms or questionnaires and Implicit data are the so-called behavioural
data, that is generated when users interact with the website. Moreover, Apriori is also known
as the common-sense segmentation, whereas Posteriori is also known as the data-driven
segmentation. For instance, in the cell Ei1, users are processed first by common-sense groups
based on their Explicit data and afterwards, they are segmented on data-driven attributes based
on their Implicit data.
2.11. Related research on user profiling
This section of the paper briefly reviews various prior research on user profiling and
mentions the techniques and customer attributes used in each of them. Understanding previous
work in this area provides an indication as to what has been tried and their results. In general,
there are two branches of research of user profiling, one branch is about evaluating and using
different techniques and customer attributes and the other branch is about evaluating the
performance of various Machine Learning techniques, methods and algorithms. This section,
first introduces and critically reviews various researches done regarding the first branch of
research, followed by critical review of researchers on performance evaluation of various
techniques and their strengths and weaknesses. The end of this section is concluded by a
synopsis of previous research on user segmentation. Figure 2 Multi-step user profiling process model
Posteriori Apriori Posteriori Apriori Apriori E1 E2 Ei1 Ei2
Posteriori E3 E4 Ei3 Ei4
Apriori iE1 iE2 i1 i2
Posteriori iE3 iE4 i3 i4
Implicit
Implicit Explicit
[image:27.595.76.425.137.231.2]28
Many studies evaluated various approaches to behavioural profiling, where some
experimented by using one or a mixture of techniques and features. Ahmed, Low, Aly,
Josifovski, & Smola (2011) used historical user activity to segment users. They categorised
websites into pre-defined categories that lead to the development of dynamic segmentation
using the so-called Topic models technique that divides webpages into (pre-defined) categories
such as Dating, Baseball (Ahmed et al., 2011). In that study, the researchers made use of
Implicit user data and grouped users by applying a probabilistic variation of a clustering
technique. In another study, Yao, Eklund, & Back (2010) created customer segments using a
two-step technique , namely SOM-Ward clustering technique, based on Demographic customer
attributes such as age and shopping behavioural characteristics such as Loyalty points and the
spending amount. The aim of their research was to identify high-spending customers and create
a prediction model, that can identify such customers, which was successfully done.
Furthermore, Zhou & Mobasher (2006) conducted a user profiling research, using a mixture of
factor analysers (MFA) technique by employing user’s navigational behaviour in browsing
sessions. This study aimed to evaluate the performance of using MFA technique based on the
shared interest of users and their behavioural observation. The study concluded visitor
preference as a latent variable and was able to discover “Heterogenous user segments” from it
(Zhou & Mobasher, 2006).
Furthermore, Tsai & Chiu (2004) performed user segmentation based on purchasing
behavioural pattern of customers. In this paper, they assumed that customers with similar
characteristics ( in their case , items purchased) often tend to exhibit similar purchasing
behaviour (Tsai & Chiu, 2004). Their approach is quite similar to user segmentation based on
Purchased-based customer attributes mentioned earlier in this chapter, thus providing evidence
on the success of using such attributes for user profiling. Furthermore, Tsai & Chiu (2004) were
29
The aim of this research was to offer customers products or advertisements that are closely
associated with their user profile and as subsequent their characteristics.
Another branch of user profiling studies in the scientific literature focuses on methods,
which take semantics of various features of behavioural features into consideration (Boratto et
al., 2016). Gong, Guo, Zhang, He, & Zhou (2013) and Tu & Lu (2010) have incorporated
semantic of user queries in their research, where users are grouped based on the similarity of
their semantic queries and click behaviours. These researchers made use of a Probabilistic
variation of clustering technique and used two forms of data, namely Implicit such as click
behaviour and Explicit such as search queries. By doing so, they demonstrated the possibility
of combining two forms of data to form user profiles. Moreover, Wu et al. (2009) also used the
semantic technique to segment user behaviour based on search queries. In their researcher, they
concluded that using Probabilistic Latent Semantic (PLSUS) for user segmentation can increase
the CTR by up to 100% compared to the classical clustering algorithm such as CLUTO and
K-means. However, the interpretability of such technique is difficult since users can belong to
more than one cluster. As a result, there are more segments compared to the classical clustering
techniques. This means that users are exposed to materials which are closely matched to their
interest. Subsequently, users probably will end up with a Filter bubble as Pariser (2011)
phrased it in his book. In addition, the overlapping membership inflates the number of cluster
members superfluously, which distorts the user profiling outcome where in reality a user might
have either lost interest in a particular interest or have been wrongly led down to a certain path.
In a related study, researchers have found that targeting users with behavioural traits that
closely resemble the ads, did not necessarily yield a higher CTR. Rather they observed that
higher CTR can be achieved when user’s behavioural traits are loosely matched with ads (Lu,
Zhao, & Xue, 2016). In other words, the high number of clusters does not necessarily translate
30
between-member homogeneity should be maintained in order to provide diversity in between
member. Therefore, it could be hypothesized that creating user profiles that loosely resembles
the interest of its members yield a better outcome. In addition, creating user profiles that are
loosely coupled to the interest of users could also prevent “Filter bubble”. This issue was
previously mentioned, where cluster members are only exposed to particular materials, products
or services that match to their interest, belief and perspective. Therefore, it could provide an
exploring opportunity for profile members to discover new material, without having to feel that
they are being closely monitored. As a result, users potentially would feel less self-conscious
about their activity and resume their normal behaviour during a website visit.
This chapter provided background for the goal of paper. The definition of behaviour in this
paper is as Cao (2010) states “activities that present as actions, operations , events or sequences
conducted by humans in a specific context and environment in either virtual or physical
organization”. This is important to define, as the goal in the paper is to develop behavioural
profiles of website visitors for higher education. Furthermore, certain processes are required to
be applied to the raw data for extracting meaningful insight. Fayyad et al. (1996) called the
collection of such processes, Knowledge Discovery. They divided Knowledge Discovery into
two main categories of Verification and Discovery, where the Discovery category correspond
to the two Machine Learning algorithms namely Unsupervised (such as Clustering) and
Supervised (such as Classification). Each of the Machine Learning categories has a variety of
techniques but this paper focuses on two specific sub-type of each Machine Learning categories,
namely Hierarchical and Non-hierarchical for Unsupervised, and Classification and
Regression for Supervised. Furthermore, Dolnicar (2008) describes three approaches to
segmentation, namely Apriori , Posteriori and Hybrid. The first two approach are one-step
approach two segmentation, whereas Hybrid is the combination of the two approaches to
31
are mentioned in the literature (Kanoje et al., 2014; Khosrow-Pour, 2009). The first one is based
on explicit user data such as website forms and the other one is based on implicit user data such
as the ways users behave and view websites. Khosrow-pour (2009) proposes the third type,
which is based on a combination of the two aforementioned types, and he argues that the
accuracy of user profiles is dependent on data quality. Therefore, he states that by combining
the two aforementioned types, Hybrid type portrays a more true and realistic image of users in
each profile. Moreover, Cufoglu (2014) proposes two methods to user profilin where one,
namely content-based, focuses on behaviours of a person in the same circumstance and the
other one, namely Collaborative, focuses on grouping individuals with similar behaviours.
Moreover, in order to realize the goal in the paper, the various source of data needs to be
realized. A literature review, based on prior research suggests three appropriate sources of data,
namely Web data, Business data and Meta data. Using a combination of these sources for
creating behavioural profiles could lead to more accurate and richer insights. Lastly, prior
research had shown various ways to profiling based on a various combination of methods,
approaches, types and customer attributes mentioned in this chapter. However, none provided
a framework that describes various ways to user profiling and customer attribute prediction
using Machine Learning. Such framework and a complementary model that demonstrates
various ways to processes data for user profiling are provided in this chapter. The following
32
3. Methodology
This chapter outlines the steps for conducting analysis in order to realize the goal in the
paper. It elaborates on methods used, expands on the nature and source of the data, and depicts
analysis strategy by means of illustration of necessary steps for the analysis. Following the
literature, the main assumption in this paper is that people who manifest similar behavioural
pattern, tend to share similar goal or interest. This paper uses static collaborative user profiling
method as modifying behavioural profiles are not possible at this stage of research. The goal in
the paper is realized by analysing visitors’ Behavioural data of the University of Twente to
discover behavioural profiles of website visitors and elaborate on their behavioural
characteristics as static profiles.
In this research, multiple data sources are used, namely Web data and Business data (CRM
data). It is an exploratory research that studies the application Machine Learning in behavioural
profiling of visitors of a University’s website. The goal in the paper is achieved by using the
framework and model proposed for User profiling in the previous chapter. The behavioural
profiles will be based on data collected from visitors of University of Twente’s website. It is a
quantitative and yet, exploratory research based on (previously collected thus) existing data to
understand typical behaviours UT website visitors and to illustrate the outcome in a simple way
sheds a light on behaviours manifested by visitors. The outcome would ideally lead to
knowledge discovery of potential prospects and their manifested behavioural patterns.
3.1. Data & Data collection
The data used for this paper is secondary data, meaning data is not collected first hand but
rather used an existing database of the University of Twente is used. The data used for this
study is the combination of Explicit and Implicit user data. For instance, Web data is an Implicit
form of user data (such as behaviour on the website) and interest in a study is an example of
33
avoid breaching the privacy of visitors. All data is anonymised and the research is conducted
by a sole researcher. In addition, the database (alongside the pre-processed) is processed in an
anonymous and careful manner.
Due to fact that data is of secondary nature, the reliability and quality of collected data are
unclear although often the collected data via CRM systems and website Cookies are quite
reliable. Nonetheless, actions are taken in order to improve the reliability and quality of the
database. One way to do so is by cross-checking and validating the data during the
pre-processing procedure. Two sources of data are used, namely Web data (Behavioural data) and
Business data (CRM database) of the University of Twente. The web data is retrieved from
34
3.2. Analysis Strategy
This section of the paper outlines how the analysis is conducted in this paper. It provides a
clear understanding of how and what steps are necessary for replication with a new dataset. In
order to achieve the goal of this paper, analyses are conducted using programs such as R, Python
and Microsoft Excel for visualization of outcomes. Using such programs provide freedom for
analysis as oppose to SPSS. Additionally, it provides a learning opportunity and possibility to
gain experience in R and Python programming languages to the researcher. The chosen
technique for conducting analyses of this paper is Unsupervised Machine Learning algorithm
called Clustering. This Machine Learning algorithm is used in this paper to unravel the naturally
occurring patterns and groups within databased using behavioural features outlined in the
following section.
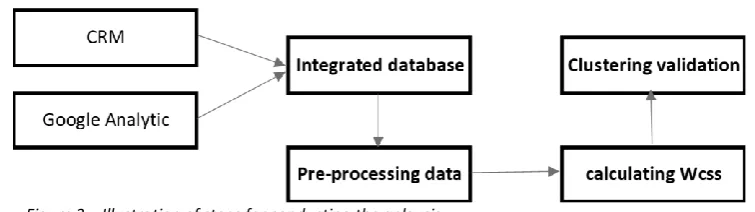
The figure 3 depicts the overall required steps for conducting each analysis. It starts with
retrieving CRM data in form of multiple (excel) documents from Marketing department of the
University of Twente and retrieving Web data from Google analytic of the University of
Twente. The collected data is for the period between January 1st, 2016 until December 31st,
2017. Once all data is received, they are integrated and transformed into a single cohesive
document that has an appropriate format for Machine Learning. The following step is the
pre-processing of the integrated file. This step includes processes such as removing invalid data
entries, transforming data into a Machine Learning appropriate format and transforming
[image:34.595.104.482.376.482.2]categorical variables into dummy variables.
35
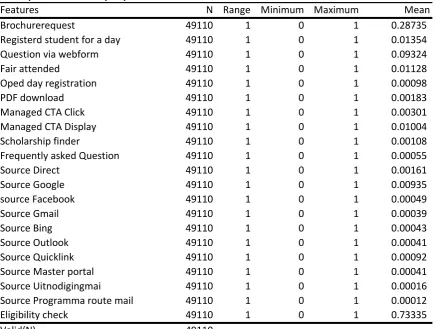
The pre-processed data of this paper has high volume (about 50,000 data entries), therefore
as indicated by the proposed framework in figure 1, a Hierarchical clustering technique is not
possible. The reason for it is that such technique requires enormous computational power for
high volume data. Therefore, a Non-hierarchical clustering algorithm as suggested by the
framework in figure 1, namely K-means is used. The reason why this particular technique
(non-probability variation of clustering technique) is chosen, is to avoid superfluously inflate the
number of profiles. Furthermore, this technique allows for loose coupling of behaviours and
interests with each profile member thus avoiding the Filter bubble as well. However, the
non-hierarchical (the Non-probabilistic variation of) clustering technique requires Apriori
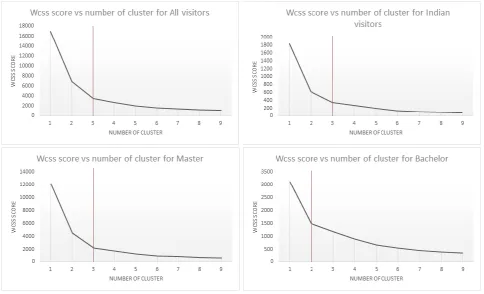
knowledge of the appropriate number of clusters. Since this is not known, the ‘within-cluster
sum of squares’ score (Wcss) is used to determine the appropriate number of profiles.
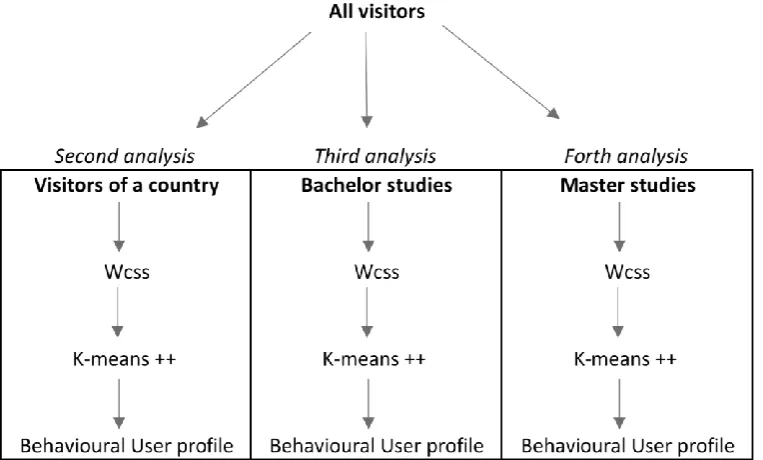
There are in total four analyses conducted in this paper. Here below, the steps for each
analysis is described and the chosen strategies, of the proposed framework and model in this
paper, are described. The analysis is done once on all visitors in order to create holistic
behavioural profiles of visitors. The aim is to demonstrate the behavioural profiles of all visitors
and the typical behavioural pattern of each profile. The steps for conducting this analysis is
depicted in figure 4. The first analysis is conducted using only the Implicit data of visitors to
create Posteriori behavioural profiles. The approach in the 1st analysis represents one of the
[image:35.595.225.350.546.691.2]36
how behavioural profiles are different when the proposed framework and model introduced in
chapter two are used. In addition, it is interesting to see if the discovered behavioural profiles
are consistent across various factors such as Study level and Country. Therefore, three more
analyses are done using the framework and model proposed in this paper.
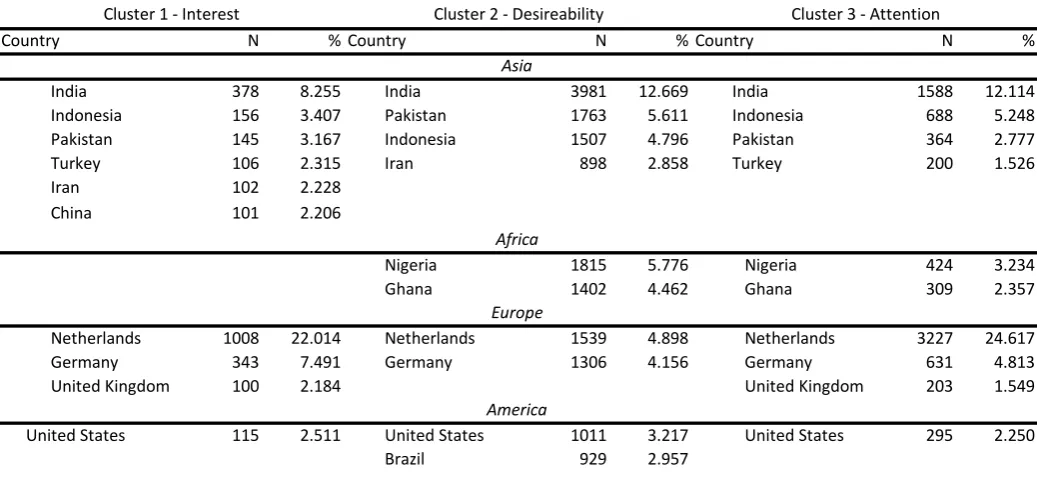
The first analysis using the framework and model of in this paper is to control for the country
factor. One country is chosen to evaluate the consistency of discovered behavioural profiles
compared to behavioural profiles of all visitors. Therefore, the second analysis (analysis
controlling for country factor) applies the “Ei1” strategy of the multi-step processing model
shown in figure 2. Moreover, in this analysis visitors are first grouped by common-sense
(Apriori) of Explicit data (country) and then grouped in a Posteriori manner based on their
Implicit data, as shown in figure 5. The choice of the country for the second analysis is based
on the number of visitors per country, which would preferably be a country with the highest
number of visitors since the clustering technique requires large enough sample so that its
outcome could be representative of the country.
Furthermore, two more analyses are conducted on the two study levels, namely Bachelor
[image:36.595.97.479.523.753.2]and Master. These two analyses control for study level factors. For conducting analyses on the