Munich Personal RePEc Archive
Thoughts on quantifying overconfidence
in economic experiments
Michailova, Julija and Katter, Joana K. Q.
Helmut-Schmidt Univeristy, York Univeristy
January 2013
Thoughts on quantifying overconfidence in economic experiments
Julija Michailova
Department of Economics, Helmut Schmidt University, Holstenhofweg 85, 22043 Hamburg, Germany
Phone: +494065413401 Fax: +494065412043
E-mail: [email protected]
Joana K. Q. Katter
Department of Psychology, York University, 309 Behavioural Science Bldg., 4700 Keele St., Toronto, Canada M3J1P3
Abstract
This article illustrates the difficulties of quantifying overconfidence in economic experiments and suggests a procedure for the development of the reliable overconfidence measurement instrument (test). Following the suggested two-stage procedure a sample measure of overconfidence is developed. First a pilot test is conducted to divide the initial fifty items into three difficulty levels: hard, moderate and easy questions. A final test was compiled of six questions of each difficulty levels. In the second phase a replicability check was run with the final instrument.
Keywords: overconfidence quantification, instrument development, economic experiment.
1. Introduction
A growing body of economic literature presents results of experiments on overconfidence.
The concept of overconfidence1 is based on evidence from cognitive psychological research which suggests that human beings overestimate the precision of their knowledge, and is
operationalized as miscalibration. Individual calibration is tested by comparing the percentage
of questions that a participant has answered correctly with her average confidence in the
answers. A person is considered to be well calibrated if the following condition is satisfied:
over the long run of those responses made with confidence P, about P% are correct (Adams
1957). However most people are not well-calibrated and demonstrate overconfidence, which
manifests itself through a systematic deviation from perfect calibration and is defined as an
‘unwarranted belief in the correctness of one’s answer’ (Lichtenstein et al. 1977).
Theoretical models of overconfidence in financial markets have linked market overconfidence
to occurrence of speculative bubbles (Scheinkman and Xiong 2003), excessive trade (De
Bondt and Thaler 1985) and price volatility (Benos 1998). Economic experiments testing for
these theoretical assumptions are becoming increasingly common in the literature (cf.
Kirchler and Maciejovsky 2002; Deaves et al. 2009; Michailova and Schmidt 2011)2. However little theoretical attention has been paid to the construct, and no conventional
method for quantifying overconfidence has been developed. Some papers do not even attempt
to present the numerical measurement of the degree of overconfidence and use various
proxies instead (e.g. Barber and Odean 2001; Statman, Thorley and Vorkink 2006). Hereby,
there is a danger that in economic experiments overconfidence may be inadequately measured
and influenced by other factors than the imperfection of human nature, e.g. by the
inappropriateness of the task inasmuch as it might be unclear to subjects and lack motivation
for active participation (see Fischhoff 1982). The lack of a reliable overconfidence measure
calls in to question the conclusions drawn by existing experimental research on
overconfidence.
The current paper is aimed at drawing attention to the importance of overconfidence
measurement in economic experiments, highlighting the theoretical considerations that need
to be taken into account when developing a suitable measurement method, including issues of
1
cultural bias and question difficulty. We will then illustrate these theoretical considerations
with a practical example, developing and testing a sample measure of overconfidence.
This article proceeds as follows. Section 2 outlines the necessary theoretical and practical
considerations that need to be taken into account when constructing a measure of
overconfidence. Section 3 presents the methodology of the test construction. Section 4
elaborates on the statistical data analysis. Section 5 analyzes the findings from the
replicability check, and, finally Section 6 concludes.
2. Theoretical considerations in constructing an overconfidence measure
There are several theoretical considerations that need to be taken into account when
constructing a measure of overconfidence. Overconfidence is most simply measured using
knowledge tests. However, the degree of overconfidence is connected to the complexity of the
task, such that overconfidence will be most pronounced for hard questions (few people know
the correct answer) and least pronounced for easy ones (most people know the answer). An
instrument that does not take the hard-easy effect into account in balancing the question
difficulty may be prone to floor or ceiling effects of overconfidence (cf. Gigerenzer et al.
1991). E.g. in Deaves et al. (2009) even the best calibrated participants exhibited rather high
degree of overconfidence. Proper calibration requires an initial administration of a large pool
of items so that group accuracy can be estimated. The test items can then be drawn from this
pool, where difficulty is determined based on the number of correct responses in the pilot
testing. The individual overconfidence measures can then be balanced to the hard-easy effect
by the inclusion of an equal number of questions from three difficulty levels (hard, medium
and easy).
A related consideration is the potential for a cultural bias in the selected items, (cf. van
Hemert, Baerveldt and Vermande 2001) which occurs when the general knowledge questions
are culture specific and might be familiar (i.e. easy) for individuals from a certain cultural or
geographic group, but unfamiliar (i.e. hard) for individuals from another. A similar problem
may occur with regards to a gender bias or a bias based on socioeconomic status. In order to
avoid giving any “group of participants a relative advantage because of subject content”
(Deaves et al. 2004), the target group for which the questionnaire is intended needs to be
clearly defined and the items selected from the general knowledge domain of the target
2
population. Particular care should be taken to ensure that the items are gender neutral. A
sample drawn from the target group is then needed to test and validate the measure (Kennedy
et al. 2010).
Another set of considerations relate to the quantitative properties of the test. There are two
types of calibration assessment techniques used in the psychological experiments: making
probability judgments about discrete propositions and calibration of probability density
functions assessed for numerical quantities (interval elicitation). With regards to test format,
most previous research used interval elicitation tasks to assess overconfidence (see Russo and
Schoemaker 1992). To measure overconfidence with this method, the assessor has to state for
a series of questions with known numerical answer, upper and lower limits such that she is
X% sure that the real answer would fall into that interval (cf. Lichtenstein et al. 1982). These
tasks are prone to extreme overconfidence levels (cf. Klayman et al. 1999), which may partly
be due to participants’ difficulties in understanding the nature of the intervals (Deaves et al. 2004). A better question format is to use discrete propositions with multiple-choice
alternatives. To measure overconfidence with discrete propositions subjects are suggested to
answer a series of questions and state their confidence for every question that their answer
was correct (cf. Lichtenstein et al. 1982; Gigerenzer et al. 1991). These tasks are clearer to
subjects and are not inherently prone to extreme overconfidence levels (cf. Klayman et al.
1999). Also, overconfidence in economic experiments is often assessed based on the
insufficient number of items, e.g. Menkhoff et al. (2006) used three assignments and Barber
and Odean (2002) only two assignments to measure individual overconfidence.
Recommendations from psychometrics suggest a minimum of 10-items to be used to provide
a stable measure of a construct (cf. Kline 1993).
Last but not least, overconfidence measurement in economic experiments should be
administered with supervision, and should involve a financial incentive. This helps to reduce
the desire of subjects to share the answers and increase the precision of the obtained
individual bias scores. E.g. Glaser and Weber (2007) conducted their survey via internet, and
subjects might have used other sources than their own knowledge for answering the questions.
3. Method
Procedure and subjects
A pilot study was conducted using 84 social science students from the Christian-Albrechts
30 minutes (instructions are available in Appendix A). Three monetary prizes were offered to
those participants who got the most items right. Of the 84 completed tests, 50 tests were
randomly chosen for further analysis – 25 of men and 25 of women. Participants had a mean age of 24.32 (SD = 0.31) and have studied from 3 to 11 semesters (M = 6.98, SD = 2.11).
Most of the subjects were German (94.8%).
Design and materials
For the pilot test 50 general knowledge questions were selected from the German quiz
web-page http://wissen.de. Each question had three short (one or two-word) multiple choice
answers. Students had to answer all the questions and state their confidence in the correctness
of their answer. Any number between 33% and 100% could be used to express subjects’ confidence, where 33% meant that subjects did not know the correct answer and were
guessing, and 100% corresponded to being absolutely certain that the answer was correct.
Individual overconfidence was measured as a bias score, which was calculated as the
difference between the average confidence level across all questions and the proportion of
correct answers. A positive score represented overconfidence, a negative score represented
underconfidence, and a bias score of zero indicated an accurately calibrated person.
bias score = average confidence – average accuracy (1)
In addition to measuring how well the subjects were calibrated, some personal data were
collected: name, age, educational background, duration of studies in semesters, and nationality.
At the beginning of the pilot session participants were informed that their personal data would
be treated confidentially, and their identities would be used by the experimenter only for the
purposes of determining the three winners.
Based on the analysis of the pilot-test outcomes, a final test (test-18) was constructed from 18
questions of the three difficulty levels: six hard, six medium and six easy questions. Items
were assigned to the three difficulty levels based on the average group accuracy: 0-33%
accuracy hard questions, 34-66% medium difficulty, 67-100% easy questions. After the initial
division, four questions have fallen in the category of hard questions (average accuracy
17.5%), 10 in the category of medium questions (average accuracy 55.2%) and 36 in the
category of easy questions (average accuracy 88.5%). Since there were not enough hard
questions, based on the idea that overconfidence is the most pronounced for hard questions
calculated and two with the highest value were added to hard questions. The eighteen items
are listed in Table 1.
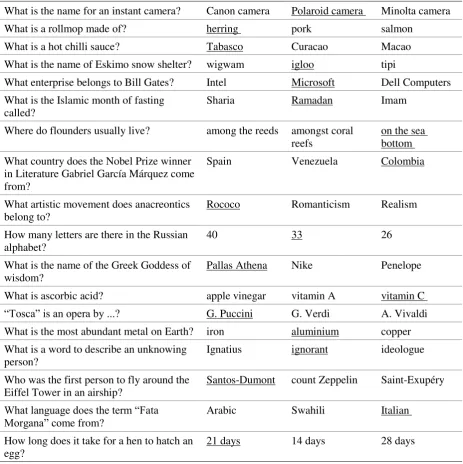
Table 1 Items included in test-18 (translation from German; arranged from easy to hard;
correct answer is underlined)
4. Results
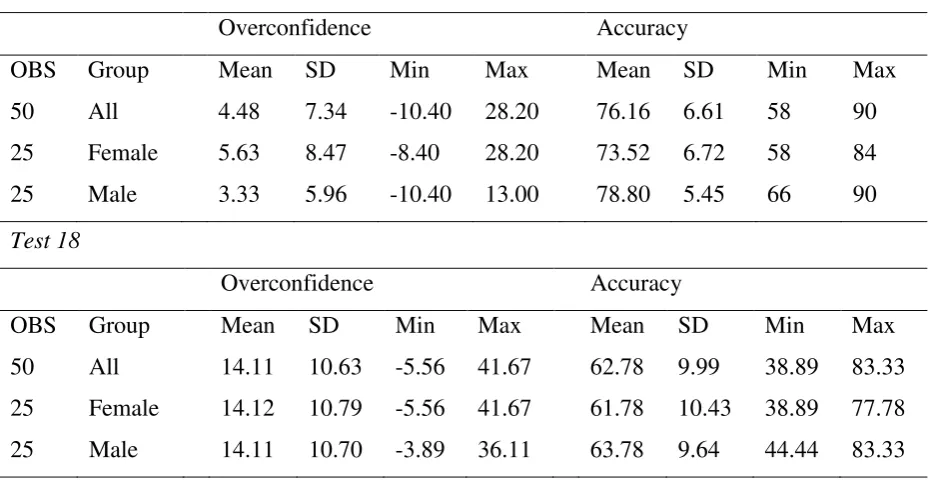
Consistent with the previous research, on average subjects were overconfident: the bias score
of the group on the test-50 pointed at slight overconfidence (M = 4.47, SD = 7.34);
recalculation of the bias score for the test-18 increased the average overconfidence measure
(M = 14.11, SD = 10.63). Table 2 presents the bias scores and accuracy of all participants of
the pilot study for both test-50 and test-18, and males and females separately.
What is the name for an instant camera? Canon camera Polaroid camera Minolta camera What is a rollmop made of? herring pork salmon
What is a hot chilli sauce? Tabasco Curacao Macao What is the name of Eskimo snow shelter? wigwam igloo tipi
What enterprise belongs to Bill Gates? Intel Microsoft Dell Computers What is the Islamic month of fasting
called?
Sharia Ramadan Imam
Where do flounders usually live? among the reeds amongst coral reefs
on the sea bottom What country does the Nobel Prize winner
in Literature Gabriel García Márquez come from?
Spain Venezuela Colombia
What artistic movement does anacreontics belong to?
Rococo Romanticism Realism
How many letters are there in the Russian alphabet?
40 33 26
What is the name of the Greek Goddess of wisdom?
Pallas Athena Nike Penelope
What is ascorbic acid? apple vinegar vitamin A vitamin C
“Tosca” is an opera by ...? G. Puccini G. Verdi A. Vivaldi
What is the most abundant metal on Earth? iron aluminium copper What is a word to describe an unknowing
person?
Ignatius ignorant ideologue
Who was the first person to fly around the Eiffel Tower in an airship?
Santos-Dumont count Zeppelin Saint-Exupéry
What language does the term “Fata Morgana” come from?
Arabic Swahili Italian
How long does it take for a hen to hatch an egg?
[image:7.595.81.545.167.632.2]Table 2 Pilot study: Overconfidence and accuracy
Test 50
Overconfidence Accuracy
OBS Group Mean SD Min Max Mean SD Min Max
50 All 4.48 7.34 -10.40 28.20 76.16 6.61 58 90
25 Female 5.63 8.47 -8.40 28.20 73.52 6.72 58 84
25 Male 3.33 5.96 -10.40 13.00 78.80 5.45 66 90
Test 18
Overconfidence Accuracy
OBS Group Mean SD Min Max Mean SD Min Max
50 All 14.11 10.63 -5.56 41.67 62.78 9.99 38.89 83.33
25 Female 14.12 10.79 -5.56 41.67 61.78 10.43 38.89 77.78
25 Male 14.11 10.70 -3.89 36.11 63.78 9.64 44.44 83.33
It shall be noted that whereas for the test-50 average overconfidence of men was slightly
lower than that of women, after recalculating the overconfidence ratio for the test-18, the
average bias score for both groups became almost identical. Pearson’s correlation analysis has not detected any significant linear relationship between the individual bias scores and
individual age (test-50: Pearson correlation(48) = -0.629, p = 0.377, one-sided; test-18: Pearson
correlation(48) = 0.078, p = 0.312, one-sided) or duration of study in semesters (test-50:
Pearson correlation(48) = 0.148, p = 0.152, one-sided; test-18: Pearson correlation(48) = 0.194,
p = 0.088, one-sided). Thus students of different age groups and being at different levels of
progress with their studies can be recruited for participation at economic overconfidence
experiments. For the test-50 correlation between accuracy and the bias score is found to be
strong and significant, pointing at the decrease in overconfidence with the increase in accuracy
(Pearson correlation (48) = -0.629, p < 0.01, one-sided); for the test-18 this relationship is even
stronger (Pearson correlation (48) = -0.823, p < 0.01, one-sided). This is in line with previous
findings (cf. Brenner, Koehler, Liberman and Tversky 1996)
Test-50 versus test-18: accuracy and confidence
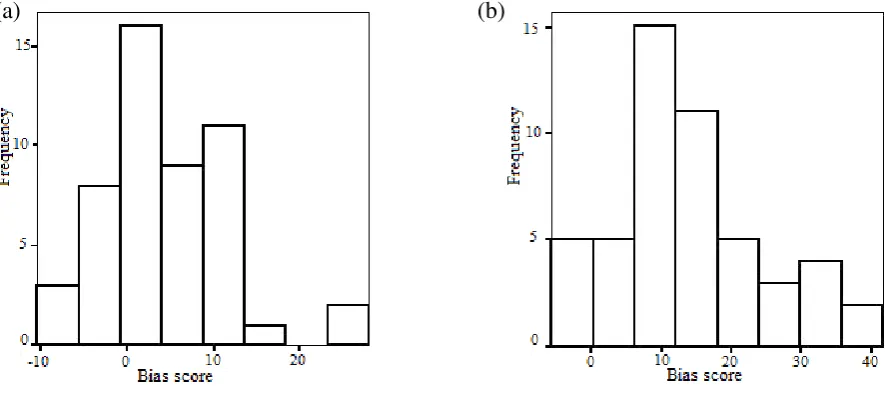
Analysis of the group accuracy for test-50 revealed that 72% of the questions were easy
(67-100% accuracy) (see Figure 1 (a). This test was characterized by high precision and low
confidence, consequently 58% of the questions resulted in average underconfidence (Figure
1(b). This outcome illustrates the danger of using the unbalanced to hard-easy effect test for
(a) (b)
Fig.1 Distribution of accuracy (a) and overconfidence per question (b) in test-50
Employment of test-50 would result in average group underconfidence3, as 24% of subjects who completed test-50 were underconfident (see Figure 2(a); for test-18 this number
decreased to 8% (see Figure 2(b). Comparison of the test-50 to test-18, revealed that the later
also results in the improvement in the symmetry of the distribution of the bias score (test-50:
skewness = 0.73; test-18: skewness = 0.53). Alongside an increase in the range of the bias
score is observed (from 38.60 for test-50 to 47.23 for test-18). This increase is important for
economic experiments as it leaves more room for finding subjects whose degree of
overconfidence differs significantly.
(a) (b)
Fig. 2 Distribution of individual bias scores by test: (a) test-50; (b) test-18
3
[image:9.595.94.537.485.683.2]Statistical Tests
This section presents the results of the statistical tests that verify the success of the
categorization of the questions into three levels of difficulty for the test-18. Characteristics of
the final test in terms of the confidence, accuracy and the bias score are presented in the Table
[image:10.595.83.545.211.314.2]3.
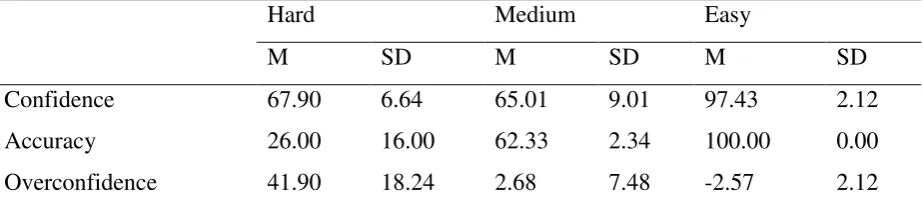
Table 3 Pilot study: Numerical characteristics of the test-18
Hard Medium Easy
M SD M SD M SD
Confidence 67.90 6.64 65.01 9.01 97.43 2.12
Accuracy 26.00 16.00 62.33 2.34 100.00 0.00
Overconfidence 41.90 18.24 2.68 7.48 -2.57 2.12
Participants exhibited overconfidence for hard and medium questions, and underconfidence
for easy questions. This is in line with previous research, which found hard questions to be the
most prone to overconfidence and easy questions often to be subject to underconfidence (e.g.
Pitz 1974; Lichtenstein et al. 1982). The bias scores for easy and hard questions differ
significantly from zero (easy questions: Wilcoxon signed rank test T = 2.097, p < 0.05,
two-sided; hard questions: Wilcoxon T = 2.097, p <0.05, two-sided). However, for medium
questions the null hypothesis of the equality of the bias score to zero cannot be rejected
(Wilcoxon T = 0.419, p = 0.675, two-sided). It can be concluded that medium questions
produced in average the bias score which was the most indistinguishable from the perfect
calibration score of zero. Kruskal-Wallis H Test indicated that the three difficulty levels of
questions resulted in significantly different levels of accuracy (Chi-squared (2) = 15.760, p =
0.00; effect size η2
= 0.926), confidence (Chi-squared (2) = 11.617, p < 0.01; effect size η2 = 0.856) and bias scores (Chi-squared (2) = 12.117, p < 0.01; effect size η2 = 0.783). These results proved that the division of questions into three difficulty levels was successful.
Gender Differences Test-50: Although no statistically significant difference was found in
overconfidence between the two genders (t(48) = -1.109, p = 0.27, two-sided), males were
significantly more accurate (t(48) = 3.053, p < 0.01, one-sided; effect size η2 = 0.163) and confident than females (t(48) = 1.840, p < 0.05, one-sided; effect size η2 = 0.069). These results suggested that there was gender bias in the pilot test items. Correlation between
0.01, one-sided). Test-18: Difference between males and females in confidence (t(48) = 1.37,
p = 0.176, two-sided; effect size η2 = 0.037), accuracy (t(48) = 0.704, p = 0.485, two-sided;
effect size η2
= 0.01) and overconfidence (t(48) = -0.002, p = 0.998, two-sided; effect size η2 = 0.00) was insignificant. No significant difference in overconfidence was found between
male and female subjects for the three levels of question difficulty (hard: t(48) = 0.085, p =
0.933, two-sided; medium: t(48) = 0.354, p = 0.725, two-sided; easy: t(48) = 0.737, p = 0.465,
two-sided). Correlation between overconfidence and accuracy is strong and significant for
both genders (men: Pearson’s Correlation (23) = -0.630, p < 0.01, one-sided; women:
Pearson’s Correlation (23) = -0.625, p < 0.01, one-sided).
5. Replicability check
The study was repeated with different students from the target group. A total of 34
participants, 21 males and 13 females, were given approximately 15 minutes to fill in the final
overconfidence test (test-18). As in the pilot study, three monetary prizes were offered to the
subjects who got the most items right. Participants had a mean age of 26.06 (SD = 2.62) and
have on average studied 9.10 semesters (SD = 2.60). Most of the subjects were German
(86%). On average subjects were found to be overconfident (M = 10.41, SD = 9.26). Average
group overconfidence in test-18 did not significantly differ between the pilot and the
replicability check (t(82) = 1.649, p = 0.103, two-sided; size effect η2 = 0.032). Table 4 presents the bias scores and accuracy of all participants of the study, and males and females
separately. As in the pilot study, no significant linear relationship between the individual bias
scores and individual age (Pearson correlation(32) = 0.189, p = 0.142, one-sided) or duration of
study in semesters (Pearson correlation(32) = -0.054, p = 0.338, one-sided) could be detected.
Correlation between the accuracy and the bias score is strong and significant, pointing at the
decrease in overconfidence with the increase in accuracy (Pearson correlation (332) = -0.731,
[image:11.595.82.545.637.743.2]p < 0.01).
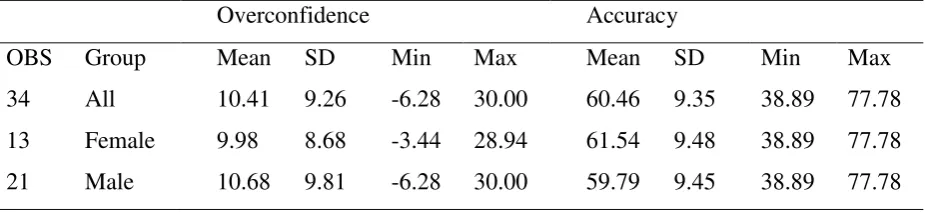
Table 4 Replicability check: Overconfidence and accuracy
Overconfidence Accuracy
OBS Group Mean SD Min Max Mean SD Min Max
34 All 10.41 9.26 -6.28 30.00 60.46 9.35 38.89 77.78
13 Female 9.98 8.68 -3.44 28.94 61.54 9.48 38.89 77.78
Gender differences Difference between male and female participants in confidence (t(32) =
-0.53, p = 0.600, two-sided; effect size η2 = 0.009), accuracy (t(32) = -0.524, p = 0.604,
two-sided; effect size η2
= 0.009) and overconfidence (t(32) = 0.211, p = 0.834, two-sided; effect
size η2
= 0.001) were insignificant. No significant difference in overconfidence was found
between male and female subjects for the three levels of question difficulty (hard: t(32) =
0.042, p = 0.967, two-sided; medium: t(32) = -0.357, p = 0.723, two-sided; easy: t(32) =
1.468, p = 0.152, two-sided).
Reliability For the instrument three values of Cronbach’s alpha were calculated: αconfidence =
0.79, αaccuracy= 0.54, and αoverconfidence = 0.68. Values of the calculated alphas were either close
or exceeded the threshold values, considered optimal for the use in social research (cf. Moss
et al. 1993). Thus, the developed instrument possesses good internal consistency (reliability).
A somewhat lower degree of alpha for the accuracy dimension resulted from low variance in
answering easy questions. Easy questions cannot be removed from the test, as a good
instrument should not only have a reasonable internal consistency but also a “meaningful
content coverage” (Schmitt 1996).
6. Conclusions
This article demonstrates the difficulties of quantifying overconfidence in economic
experiments and suggests a procedure for the development of the reliable overconfidence
measure. The principal steps to improve the instrument were: 1) choice of another test format
(discrete propositions with multiple-choice alternatives instead of confidence intervals), 2)
balancing the test for the hard-easy effect, and 3) controlling for gender and country bias.
Following the suggested procedure an instrument is developed in a two-stage procedure. In
the first phase a pilot test was conducted to assess questions’ difficulty, based on the group
accuracy in answering the initial test items. Subsequently, six questions of the three difficulty
types were included in the final test. The second phase was aimed at verification of
replicability of results. Both studies were administered with the students of the target group,
who were offered a reward on the basis of competition in test accuracy. Evidence was found
for the significant effect of the question difficulty on the overconfidence measure and for the
existence of the gender bias. The statistical analysis confirmed that the three types of
questions significantly differed from each other in terms of the produced confidence, accuracy
and overconfidence. In the created instrument gender is not associated with overconfidence.
importance of employment of a reliable measure to assess subjects’ overconfidence for the
validity of the results of economic experiments, it can be concluded that the instrument
suitable for evaluation of individual differences in the degree overconfidence was created.
Acknowledgements
We want to express gratitude to Briony D. Pulford for a fruitful cooperation. We thank Jürgen
Golz for valuable comments. A special thank to Christian Radden, who helped in translating
the experimental instructions to German. Julija Michailova acknowledges a German
Academic Exchange Office (DAAD) scholarship.
References
Adams, J. K. (1957). A confidence scale defined in terms of expected percentages. The
American Journal of Psychology, 70, 432–436.
Barber, B., Odean, T. (2001). Boys will be boys: Gender, overconfidence and common stocks
investments. Quarterly Journal of Economics, 116, 261–292.
Barber, B. M., Odean, T. (2002). Online investors: do the slow die first? Review of Financial
Studies, 15, 455–487.
Benos, A. (1998). Aggressiveness and Survival of Overconfident Traders. Journal of
Financial Markets, 1, 353–383.
Brenner, L. A., Koehler, D., J., Liberman, V., Tversky, A. (1996). Overconfidence in
probability and frequency judgments: A critical examination. Organizational Behavior and
Human Decision Processes, 65(3), 212–219.
Deaves, R., Lüders, E., Luo, G. Y. (2009). An experimental test of the impact of
overconfidence and gender on trading activity. Review of Finance, 13, 555–575.
De Bondt, W. F. M., Thaler R. (1985). Does the Stock Market Overreact? The Journal of
Finance, 40, 793–805.
Fischhoff, B. (1982). Debiasing. In D. Kahneman, P. Slovic, A. Tversky (Ed.), Judgment
Gigerenzer, G., Hoffrage, U., Kleinbölting, H. (1991). Probabilistic mental models: A
Brunswikian theory of confidence. Psychological Review, 98, 506–28.
Glaser, M., Weber, M. (2007). Overconfidence and trading volume. The Geneva Risk and
Insurance Review, 32, 1–36.
Kennedy, J. M., Tarnai, J., Wolf, J. G. (2010). Managing Survey Research Projects. In P. V
Marsden, J. D. Wright, (Ed.), Handbook of survey research (pp. 575–592). Bingley: Emerald Group Publishing Ltd.
Klayman, J., Soll., J. B., Gonzáles-Vallejo, C., Barlas, S. (1999). Overconfidence: it depends
on how, what, and whom you ask. Organizational Behavior and Human Decision Processes,
79, 216–247.
Kline, P. (1993). The Handbook of Psychological Testing. London. New York: Routledge.
Kirchler, E., Maciejovsky, B. (2002). Simultaneous Over- and Underconfidence: Evidence
from Experimental Asset Markets. Journal of Risk and Uncertainty, 25, 65–85.
Lichtenstein, S., Fischhoff, B., Phillips, L. D. (1977). Calibration of probabilities: The state of
the art. In H. Jungermann, G. deZeeuw, (Ed.), Decision Making and Change in Human
Affairs (pp. 275–324). Amsterdam: D. Reidel.
Lichtenstein, S., Fischhoff, B., Phillips, L. D. (1982). Calibration of probabilities: the state of
the art to 1980. In D. Kahneman, P. Slovic, A. Tversky, (Ed.), Judgment under Uncertainty:
Heuristics and Biases (pp. 306–334). New York: Cambridge University Press.
Michailova, J., Schmidt, U. (2011). Overconfidence and bubbles in experimental asset
markets. Kiel Working Papers 1729, Kiel Institute for the World Economy.
Menkhoff, L., Schmidt, U., Brozynski, T. (2006). The impact of experience on risk taking,
overconfidence, and herding of fund managers: Complementary survey evidence. European
Economic Review, 50, 1753–1766.
Moss, S., Patel, P., Prosser, H., Goldber, D., Simpson, N., Rowe, S., Lucchino, R. (1993).
Psychiatric morbidity in older people with moderate and severe learning disability. I:
Pitz, G.F. (1974). Subjective probability distributions for imperfectly known quantities. In L.
W. Gregg (Ed.), Knowledge and Cognition (pp. 29–41). New York: Wiley.
Russo, J. E., Schoemaker, P. J. (1992). Managing overconfidence. Sloan Management
Review, 33, 7–17.
Scheinkman, J. A., Xiong, W. (2003). Overconfidence and Speculative Bubbles. Journal of
Political Economy, 111, 1183–1219.
Schmitt, N. (1996). Uses and Abuses of Coefficient Alpha. Psychological Assessment, 8,
350–353.
Statman, M., Thorley, S., Vorkink, K. (2006). Investor overconfidence and trading volume.
Review of Financial Studies, 19, 1531–1565.
van Hemert, D. A., Baerveldt, C., Vermande, M. (2001). Assessing cross-cultural item bias in
questionnaires. Acculturation and the measurement of social support and family cohesion for
Appendix A Experimental Instructions (text is based on the sample received from Dr. Briony
D. Pulford)
General Knowledge Questionnaire
Below you will be presented with some general knowledge questions. Imagine that you are taking part in a game, like “Trivial Pursuit” or “Who wants to be a Millionaire?”, and you have to choose the correct answer from the three given alternatives. A person who answers the most questions right will get a 30 EUR prize. The second place will be awarded by the 20 EUR prize, and the third place by 10 EUR. You will be paid next week!
1) Please circle ONLY ONE of three given answers. Only one of them is correct.
2) When you have made your choice and have circled your answer, we would like to know how sure/confident you are that your answer is correct. Since there are three alternative answers and only one of them is correct you have a 33% chance of giving a correct answer. Therefore 33% means that you are guessing and do not know the correct answer, and 100% corresponds to absolute certainty.
You can use any number between 33% and 100% to indicate your confidence that your answer is correct.
Enter your confidence for every answer in the gap in the question after every test item:
How confident are you that your answer is correct? _______ %
Please answer all questions. Even if you have to guess everything, you could answer 33% correct by chance. You are not allowed to consult anyone else, or copy the answers from somebody.
NOTE: Please answer all questions, one after another in order in which they are presented in the questionnaire. Guess any answers you do not know. Do not jump around the questions, and do not return to already answered questions to change your answers; we are interested in your first answer.
You will be paid the money only if you have filled in the WHOLE questionnaire! Don’t leave unanswered questions or unfilled gaps!
Please ask questions if something is unclear to you.
Thank you for your patience in completing this questionnaire.
_________________________________________________________________
Your personal data will be treated confidentially.
1. What is the name for an instant camera? (circle one)
Canon camera Polaroid camera Minolta camera
How confident are you that your answer is correct? _______ %
2. Where do flounders usually live? (circle one)
among the reeds amongst coral reefs on the sea bottom
How confident are you that your answer is correct? _______ %
3. What is a rollmop made of? (circle one)
herring pork salmon
How confident are you that your answer is correct? _______ %
4. What country does the Nobel Prize winner in Literature Gabriel García Márquez come from? (circle one)
Spain Venezuela Colombia
How confident are you that your answer is correct? _______ %
5. What artistic movement does anacreontics belong to? (circle one)
Rococo Romanticism Realism
How confident are you that your answer is correct? _______ %
6. What is a hot chilli sauce? (circle one)
Tabasco Curacao Macao
How confident are you that your answer is correct? _______ %
7. How many letters are there in the Russian alphabet? (circle one)
40 33 26
How confident are you that your answer is correct? _______ %
8. “Tosca” is an opera by ...? (circle one)
G. Puccini G. Verdi A. Vivaldi
How confident are you that your answer is correct? _______ %
9. What is the name of the Greek Goddess of wisdom? (circle one)
Pallas Athena Nike Penelope
10. What is the most abundant metal on Earth? (circle one)
iron aluminum copper
How confident are you that your answer is correct? _______ %
11. What is a word to describe an unknowing person? (circle one)
Ignatius ignorant ideologue
How confident are you that your answer is correct? _______ %
12. Who was the first person to fly around the Eiffel Tower in an airship? (circle one)
Santos-Dumont count Zeppelin Saint-Exupéry
How confident are you that your answer is correct? _______ %
13. What is the name of Eskimo snow shelter? (circle one)
wigwam igloo tipi
How confident are you that your answer is correct? _______ %
14. What enterprise belongs to Bill Gates? (circle one)
Intel Microsoft Dell Computers
How confident are you that your answer is correct? _______ %
15. What is the Islamic month of fasting called? (circle one)
Sharia Ramadan Imam
How confident are you that your answer is correct? _______ %
16. What language does the term “Fata Morgana” come from? (circle one)
Arabic Swahili Italian
How confident are you that your answer is correct? _______ %
17. How long does it take for a hen to hatch an egg? (circle one)
21 days 14 days 28 days
How confident are you that your answer is correct? _______ %
18. What is ascorbic acid? (circle one)
apple vinegar vitamin A vitamin C