ORIGINAL RESEARCH
Evaluation of Automatic Measurement of the
Intracranial Volume Based on Quantitative MR
Imaging
K. Ambarki T. Lindqvist A. Wåhlin E. Petterson M.J.B. Warntjes R. Birgander J. Malm A. Eklund
BACKGROUND AND PURPOSE: Brain size is commonly described in relation to ICV, whereby accurate assessment of this quantity is fundamental. Recently, an optimized MR sequence (QRAPMASTER) was developed for simultaneous quantification of T1, T2, and proton density. ICV can be measured automatically within minutes from QRAPMASTER outputs and a dedicated software, SyMRI. Auto-matic estimations of ICV were evaluated against the manual segmentation.
MATERIALS AND METHODS: In 19 healthy subjects, manual segmentation of ICV was performed by 2 neuroradiologists (Obs1, Obs2) by using QBrain software and conventional T2-weighted images. The automatic segmentation from the QRAPMASTER output was performed by using SyMRI. Manual corrections of the automatic segmentation were performed (corrected-automatic) by Obs1 and Obs2, who were blinded from each other. Finally, the repeatability of the automatic method was evaluated in 6 additional healthy subjects, each having 6 repeated QRAPMASTER scans. The time required to measure ICV was recorded.
RESULTS: No significant difference was found between reference and automatic (and corrected-automatic) ICV (P⬎.25). The mean difference between the reference and automatic measurement was ⫺4.84 ⫾ 19.57 mL (or 0.31 ⫾ 1.35%). Mean differences between the reference and the corrected-automatic measurements were⫺0.47⫾17.95 mL (⫺0.01⫾1.24%) and⫺1.26⫾17.68 mL (⫺0.06⫾1.22%) for Obs1 and Obs2, respectively. The repeatability errors of the automatic and the corrected-automatic method were⬍1%. The automatic method required 1 minute 11 seconds (SD⫽ 12 seconds) of processing. Adding manual corrections required another 1 minute 32 seconds (SD⫽ 38 seconds).
CONCLUSIONS:Automatic and corrected-automatic quantification of ICV showed good agreement with the reference method. SyMRI software provided a fast and reproducible measure of ICV.
ABBREVIATIONS:CoV⫽coefficient of variation; ICV⫽intracranial volume; Obs1⫽observer 1; Obs 2⫽observer 2; PD⫽proton density; QRAPMASTER⫽ quantification of relaxation times and proton density by multi-echo acquisition of a saturation-recovery using turbo spin-echo readout
M
R imaging– based brain volume quantification is impor-tant in several neurologic diseases.1-3 The size of the brain ventricles is enlarged in hydrocephalus, and brain vol-ume is decreased in dementia disorders.4-7The number, the volume, and the longitudinal evolution of white matter lesions describe the clinical course in multiple sclerosis.8Commonly, the volumetric measures are normalized in relation to the ICV to decrease the effect of variations in head size.9-11Manual segmentation of ICV is considered the reference method.12 This is performed by tracing the outer contour of the ICV oneach frame in a stack of images covering the head. Unfortu-nately, this method is laborious, operator-dependent, and time-consuming for a large structure such as the ICV. There-fore, manual segmentation is impractical for clinical routine, and it is important to develop automatic tools to rapidly and accurately assess ICV.
Automatic postprocessing tools exist, such as FreeSurfer (http://surfer.nmr.mgh.harvard.edu/) and SPM (www.fil.ion. ucl.ac.uk/spm), for computing brain volumes and ICV. How-ever, their clinical usefulness is limited by time-consuming work flows.11
Recently, a novel MR imaging quantification sequence, QRAPMASTER, was developed for rapid and simultaneous sampling of the longitudinal relaxation time (T1), the trans-versal relaxation time (T2), and PD.13,14Included in this mea-surement is the correction for the B1 field inhomogeneity. With dedicated software, SyMRI Brain Studio (SyntheticMR, Linko¨ping, Sweden), the QRAPMASTER quantification maps can be processed to automatically segment the ICV, as well as CSF, gray matter, and white matter, a process called “synthetic tissue mapping.” This method is an application of synthetic imaging in which tissue maps are used for brain volume quantification.
The purpose of this study was to compare the automatic computation of ICV based on synthetic tissue mapping with a
Received November 29, 2011; accepted after revision January 11, 2012.
From the Department of Radiation Science (K.A., T.L., A.W., R.B., A.E.), Center for Biomedical Engineering and Physics (K.A., A.W., A.E.), and Department of Clinical Neuro-sciences (J.M.), Umeå University, Umeå, Sweden; SyntheticMR ABE, (E.P., M.J.B.W.), Linko¨ping, Sweden; and Center for Medical Image Science and Visualization (M.J.B.W.), Linko¨ping University, Linkoping, Sweden.
This work was funded by the Objective 2 Norra Norland-EU Structural Fund, the Swedish Research Council, Vinnova, the Foundation for Strategic Research though their joint initiative Biomedical Engineering for Better Health, and the Va¨stterbotten County Council ALF medal.
Please address correspondence to Khalid Ambarki, PhD, Department of Radiation Sciences, Umeå University Hospital, Va¨sterbotten SE-901-87, Sweden; e-mail: [email protected]
Indicates open access to non-subscribers at www.ajnr.org
http://dx.doi.org/10.3174/ajnr.A3067
BRAIN
ORIGINAL
reference. The reproducibility of the automatic method was further investigated by repeating the measurement on differ-ent occasions.
Materials and Methods
Subjects
Nineteen healthy volunteers (mean age, 34⫾8 years) were included in the comparison. Additionally 6 healthy volunteers (mean age, 32⫾ 7 years) were scanned 6 times with the QRAPMASTER sequence. The study was approved by the local ethics committee. Informed consent was obtained from all subjects.
MR Imaging Acquisitions
All scans were obtained on a 3T Achieva system (Philips Healthcare, Best, the Netherlands). A conventional axial T2-weighted turbo spin-echo sequence was acquired with TR⫽3000 ms, TE⫽80 ms, 3-mm section thickness, 0.3-mm intersection gap, and 0.5-mm in-plane res-olution; 50 sections were collected to cover the ICV. The scanning time was 3 minutes 36 seconds.
Assessment by using QRAPMASTER was performed to retrieve the T1 and T2 relaxation and the PD. The sequence was a multi-spin-echo saturation-recovery sequence, with 4 saturation delays and 5 echoes.13The saturation delays were at 130, 500, 1370, and 2970 ms with a TR⫽3090 ms. The TEs were 17.5, 35, 52.5, 70, and 87.5 ms. Each acquisition led to 4⫻5⫽20 images per section with different combinations of saturation delay times and TEs. The in-plane reso-lution was 1 mm, section thickness was 6 mm, 25 axial sections were collected to cover the ICV without intersection gap, and the scanning time was 5 minutes 28 seconds.
ICV Measurements
Reference Method.The ICV was defined as the volume of the
intracranial cavity from the foramen magnum to the vertex. The man-ual segmentation of the ICV was performed on conventional T2-weighted images by using the image-analysis software QBrain (Ver-sion 2.0; Medis Medical Imaging Systems BV, Leiden, the Netherlands).15The ICV was computed by using a standard com-puter (2.19 GHz, 1.96 GB of RAM). The ICV border was defined by using a local threshold fixed by an experienced operator (K.A.). In each section, an area was segmented by manually tracing the borders of the region of interest. All manual ICV masks were saved and later reviewed in a session with 2 experienced radiologists (Obs1⫽R.B. and Obs2⫽T.L.) to ensure segmentation accuracy. ICV masks were corrected until a consensus was reached. The outcome of this proce-dure was considered the reference ICV.
Automatic Method.The QRAPMASTER T1, T2, and PD data
were analyzed with the SyMRI Brain Studio software, which was in-tegrated in a standard PACS workstation. The software detected T1, T2, and PD combinations characteristic of white matter, gray matter, and CSF, including voxels with mixtures of tissues.16A region-grow-ing algorithm detected the largest contiguous volume with WM, GM, and CSF and refined the border exactly at PD⫽50%, under the
assumption that the ICV border corresponds to the interface between CSF (PD⫽100%) and bone (PD⫽0%).
No head-motion-correction technique was used with either the reference method or the automatic method.
Corrected-Automatic Method. For the corrected-automatic
method, the suggested result of the automatic method was taken and manually corrected by using the SyMRI software. Manual correction was performed by 2 neuroradiologists (Obs1 and Obs2), separately and blinded from each other.
Repeatability
To verify the repeatability of the synthetic tissue-mapping method for ICV measurements, we scanned 6 healthy subjects 6 times. Between the scans, the subjects were taken out of the MR imaging system to stand on the floor for a few seconds; thereafter, they were repositioned into the MR imaging system for the next brain scan. The time taken to perform the quantification of ICV by using the reference, automatic, and corrected-automatic methods was assessed.
Statistical Analysis
Regression analysis and Bland-Altman plots were used to assess agree-ment between methods and operators. The Shapiro-Wilk test was used to test normality. Differences between the means of repeated intracranial volume measurements were analyzed by using the paired ttest or the Wilcoxon-Mann-Whitney test when appropriate.
To quantify the intrasubject repeatability error (from 6 repeti-tions) of ICV measurements by using SyMRI software, we calculated the CoV (CoV⫽SD / mean) for each subject and each method (au-tomatic and corrected-au(au-tomatic). The group CoV was derived as the average of the intrasubject CoV across all subjects.
Pvalues⬍.05 were considered statistically significant. The statis-tical analysis was performed with the Statisstatis-tical Package for the Social Sciences software, Version 12.0 (SPSS, Chicago, Illinois).
Results
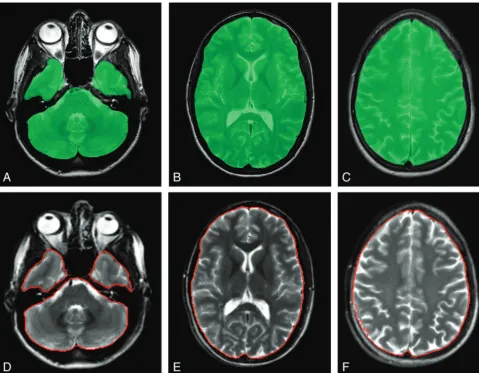
Intracranial volumes of the 19 subjects assessed by the refer-ence, automatic, and corrected-automatic methods are shown in the Table. Typical sections of reference ICV and automatic ICV method are shown in Fig 1.
Reference ICV versus Automatic/Corrected-Automatic ICV
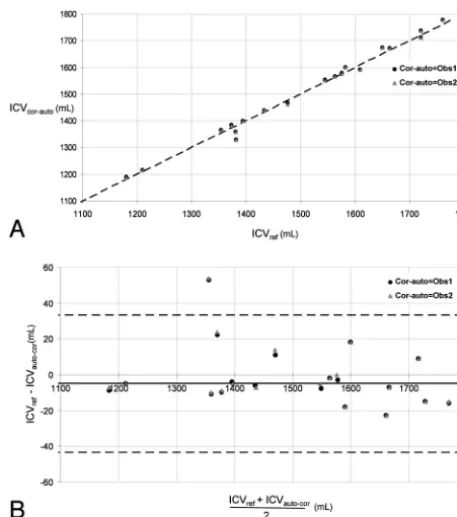
Comparisons between the reference ICV measurements and the automatic/corrected-automatic ICV measurements are shown in Figs 2Aand 3A. They were highly correlated (refer-ence versus automatic:R⫽0.99,P⬍.01; reference versus corrected-automatic Obs1:R⫽0.99,P⬍.01; reference versus corrected-automatic Obs2:R⫽0.99,P⬍.01). No significant difference was found between reference and automatic ICV (pairedttest,P⫽.295) or between reference and corrected-automatic ICV (paired t test, P ⫽ .910 [Obs1]; P ⫽ .759 [Obs2]).
The mean difference between the reference and the auto-Intracranial volume using the reference, automatic, and corrected-automatic methods from 19 subjects
Reference (mL) Automatic (mL)
Corrected-Automatic Obs1 (mL)
Corrected-Automatic Obs2 (mL)
Mean 1504⫾169 1509⫾172 1504⫾174 1505⫾173
Median 1545 1566 1550 1553
matic measurement was⫺4.84⫾19.57 mL, corresponding to a relative percentage error of 0.31⫾1.35% (Fig 2B). The av-erage difference between the reference and the corrected-au-tomatic measurement was⫺0.47⫾17.95 mL or ⫺0.01⫾ 1.24% for Obs1 and⫺1.26⫾17.68 mL or⫺0.06⫾1.22% for Obs2 (Fig 3B).
Interoperator Variability of the Corrected-Automatic ICV Measurements
The interoperator variability of the corrected-automatic ICV measurement showed a high reproducibility with an average difference of⫺0.79⫾1.27 mL or⫺0.05⫾0.08%.
Repeatability
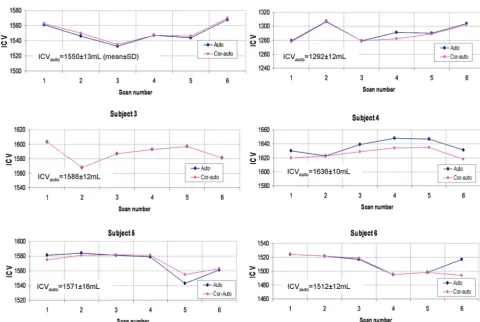
The repeatability of ICV measurements for each subject and each repetition is shown in Fig 4. The CoVs of the ICV from the automatic and corrected-automatic method were 0.83⫾ 0.14% and 0.77⫾0.18%, respectively.
Processing Time to Quantify ICV by using the Reference, Automatic, and Corrected-Automatic Methods
The mean duration to quantify ICV with the reference method exceeded 30 minutes for all subjects. The automatic method required approximately 1 minute 11 seconds (SD⫽12
sec-onds) to read the dataset and to display the results. The cor-rected-automatic method time to assess the ICV required an additional 1 minute 32 seconds (SD⫽38 seconds) per subject.
Discussion
We evaluated a new quantitative MR imaging method on the basis of a combination of the QRAPMASTER MR imaging sequence and SyMRI software, which together produced an automatic measurement of intracranial volume called “syn-thetic tissue mapping. ” A high correlation between the refer-ence and both the automatic and the corrected-automatic methods was found. Occasional automatic inclusion of obvi-ous extracranial structures like the orbits motivated manual corrections. The automatic and also the corrected-automatic estimations of ICV with SyMRI software were performed by the evaluator within minutes. Moreover, repeated scans showed the consistency and robustness of ICV measurement by using the automatic or corrected-automatic SyMRI software.
[image:3.594.55.535.43.416.2]overestimation of ICV (average difference of 133 mL) com-pared with the manual segmentation. FreeSurfer software is based on gradient-echo T1-weighted images, in which it is difficult to localize the border between the CSF and the skull and the images might be subject to geometric distortion. Fur-thermore, it uses a scaling factor based on an atlas to quantify ICV,18which may lead to a dependence on the group charac-teristics of the subjects that were included in the model. The SyMRI ICV segmentation, on the other hand, is based on spin-echo images, which are less sensitive to geometric distortion, and is model-free. Moreover, the ICV edge does not depend on the image histogram but on the absolute estimation of 50% proton density. Using SPM5 software, a recent study has re-ported a mean relative error of 3⫾2.5% and 10.2⫾1.3% by using 2 different SPM5 settings (from a 3T scanner) between the automatic ICV and the reference method.19 However, when SPM5 was combined with a postprocessing method called N320(to correct the radio-frequency field inhomogene-ities in MR images), the mean relative errors between the au-tomatic ICV and the reference method were of the same mag-nitude as those found for automatic ICV by using SyMRI software. The authors observed that as a common finding us-ing SPM5 to quantify ICV, a large portion of CSF may be excluded, and this might represent the main source of error. With the SyMRI tool, no such bias was observed for CSF.
The misclassifications of the ICV by using the automatic SyMRI were mainly localized in the regions of the eyes, optic nerves, and lower part of the cerebellum. However, the re-quired manual corrections of the automatic ICV mask were easy and fast (⬍2 minutes). Despite the excellent agreement between the automatic and reference ICV quantities, we still
believe it will be necessary to review and correct the automatic intracranial volume delineation.
The partial volume effects are taken into account in the algorithm of the SyMRI software, and lower spatial resolution does not change the estimated ICV.21The partial volume esti-mation seems to work well because the acquisition of the QRAPMASTER scan was done with voxels of 1⫻1⫻6 mm, which is a much lower resolution than that of the T2-weighted images of the reference method with voxels of 0.5⫻0.5⫻3 mm.
Although the mean difference in this evaluation was close to zero, we still found randomized variations (Figs 2Band 3B). We believe that the main source of the difference was due to the partial volume effects, which, for the manual segmenta-tion, complicate the use of an intensity threshold, especially in the uppermost sections at the vertex of the brain and also at the base of the cerebellum. Another reason might be the slight geometric distortion of the images as a function of patient position. For comparison, a 1500-mL perfect sphere has a ra-dius of 71.0 mm. An apparent inflation of such a sphere with only 1 mm (to a 72.0-mm radius) would lead to an increase of 64 mL of measured volume. The observed SD of 10 –20 mL is very small in comparison.
Current automatic software tools are not commonly used by clinicians because the computing time and the workflow are considered too long. Pengas et al11have reported a com-puting time of several hours for FreeSurfer and 15 minutes for SPM. ICV measurement with the SyMRI software is consider-ably faster. It takes⬍3 minutes per subject. Furthermore, the SyMRI tool was directly available from a PACS workstation Fig 3.A, Corrected-automatic-versus-reference segmentation of the ICV in 19 subjects. The oblique black line represents the equality line. ICVcor-autoindicates corrected-automatic
intracranial volume; ICVref, reference intracranial volume; Cor-auto, corrected-automatic.B,
Bland-Altman plot of the data inA. The horizontal dashed lines are the 95% confidence intervals of the difference between manual and automatic ICV. ICVcor-autoindicates
corrected-automatic intracranial volume; ICVref, reference intracranial volume; Cor-auto,
corrected-automatic. Fig 2.A, Automatic-versus-reference segmentation of the ICV in 19 subjects. The oblique
black line represents the equality line. The ICV unit is in milliliters. ICVautoindicates
automatic intracranial volume; ICVref, reference intracranial volume.B, Bland-Altman plot
of the data inA. The horizontal dashed lines are the 95% confidence intervals of the difference between manual and automatic ICV. ICVautoindicates automatic intracranial
[image:4.594.302.531.42.301.2] [image:4.594.52.284.43.304.2]and, therefore, facilitates the workflow of clinicians to perform the automatic or corrected-automatic quantification of ICV.
The repeatability of ICV estimation with the automatic and corrected-automatic methods by using SyMRI software was adequate (CoV⬍1%). These results were comparable with the scan-rescan ICV reproducibility with FreeSurfer software. A recent study reported a scan-rescan reproducibility (on 2 separate scanning dates with a 2-week delay) of 1.34% and 2.56% in an older group and a younger group, respectively.10 Pengas et al11reported that the precision of automatic ICV measurements were better in SPM compared with FreeSurfer when the subjects were scanned twice with an interscan time interval of several months.
In a recent study, a fully-automatic commercial software (NeuroQuant; CorTechs, La Jolla, California) was used for volume assessment of several brain structures in dementia.22 This software was evaluated against the manual segmentation, and a good agreement was found between manual and auto-matic segmentation.23However, we cannot compare it with our study because the ICV data were not presented.
The relatively small sample size and only 3T MR imaging investigations are limitations. Therefore, more research is needed, and it should include patients with tissue abnormali-ties such as small-vessel ischemic disease and arachnoid cysts and should also investigate the effect of the magnetic field strengths. Furthermore, the next step in the evaluation process of this novel promising contribution to the neuroradiologist
tool box would be an evaluation of ventricular volume as well as the brain volume fraction, hence getting a rapid and reliable index of ventriculomegaly and brain atrophy.
Conclusions
Automatic and corrected-automatic estimations of ICV with SyMRI software agreed with the reference method. The com-bination of the QRAPMASTER MR imaging sequence and SyMRI software provides fast and repeatable measures of ICV, and it might help clinicians to rapidly estimate ICV in patients.
Disclosures: M.J.B. Warntjes—UNRELATED:Employment: SyntheticMR AB,Comments: employed part-time by SyntheticMR AB, a company providing software solutions for MR imaging quantification and automatic tissue segmentation. Erika Petterson—UNRELATED: Employment: SyntheticMR AB,Comments: employed full-time and took part in the writing within my employment at Synthetic MR AB. Jan Malm—UNRELATED:Patents (planned, pending, or issued): Likvor AB,*Royalties: Likvor AB. *Money paid to the institution.
References
1. Nopoulos PC, Aylward EH, Ross CA, et al.Smaller intracranial volume in prodromal Huntington’s disease: evidence for abnormal neurodevelopment.
Brain2011;134:137– 42
2. Jack CR Jr, Wiste HJ, Vemuri P, et al.Brain beta-amyloid measures and mag-netic resonance imaging atrophy both predict time-to-progression from mild cognitive impairment to Alzheimer’s disease.Brain2010;133:3336 – 48 3. Palm WM, Saczynski JS, van der Grond J, et al.Ventricular dilation:
associa-tion with gait and cogniassocia-tion.Ann Neurol2009;66:485–93
4. Relkin N, Marmarou A, Klinge P, et al.Diagnosing idiopathic normal-pressure hydrocephalus.Neurosurgery2005;57:S4 –16, discussion ii-v
[image:5.594.55.536.58.380.2]of atrophy in subjects with mild cognitive impairment that predict subse-quent diagnosis of Alzheimer disease.AJNR Am J Neuroradiol2009;30:532–38 6. Fjell AM, Amlien IK, Westlye LT, et al.Mini-mental state examination is sen-sitive to brain atrophy in Alzheimer’s disease.Dement Geriatr Cogn Disord
2009;28:252–58
7. Henneman WJ, Sluimer JD, Barnes J, et al.Hippocampal atrophy rates in Alz-heimer disease: added value over whole brain volume measures.Neurology
2009;72:999 –1007
8. Zhao GJ, Li DK, Wolinsky JS, et al.Clinical and magnetic resonance imaging changes correlate in a clinical trial monitoring cyclosporine therapy for mul-tiple sclerosis. The MS Study Group.J Neuroimaging1997;7:1–7
9. Barnes J, Ridgway GR, Bartlett J, et al.Head size, age and gender adjustment in MRI studies: a necessary nuisance?Neuroimage2010;53:1244 –55
10. Jovicich J, Czanner S, Han X, et al.MRI-derived measurements of human subcortical, ventricular and intracranial brain volumes: reliability effects of scan sessions, acquisition sequences, data analyses, scanner upgrade, scanner vendors and field strengths.Neuroimage2009;46:177–92
11. Pengas G, Pereira JM, Williams GB, et al.Comparative reliability of total in-tracranial volume estimation methods and the influence of atrophy in a lon-gitudinal semantic dementia cohort.J Neuroimaging2009;19:37– 46 12. Ambarki K, Wåhlin A, Birgander R, et al.MR imaging of brain volumes:
eval-uation of a fully automatic software.AJNR Am J Neuroradiol2011;32:408 –12 13. Warntjes JB, Dahlqvist O, Lundberg P.Novel method for rapid, simultaneous T1, T2*, and proton density quantification.Magn Reson Med2007;57:528 –37 14. Warntjes JB, Leinhard OD, West J, et al.Rapid magnetic resonance quantifica-tion on the brain: optimizaquantifica-tion for clinical usage. Magn Reson Med
2008;60:320 –29
15. Ambarki K, Israelsson H, Wåhlin A, et al.Brain ventricular size in healthy elderly: comparison between Evans index and volume measurement. Neuro-surgery2010;67:94 –99, discussion 99
16. West J, Warntjes JB, Lundberg P.Novel whole brain segmentation and volume estimation using quantitative MRI.Eur Radiol2012;22:998 –1007
17. Lehmann M, Douiri A, Kim LG, et al.Atrophy patterns in Alzheimer’s disease and semantic dementia: a comparison of FreeSurfer and manual volumetric measurements.Neuroimage2010;49:2264 –74
18. Buckner RL, Head D, Parker J, et al.A unified approach for morphometric and functional data analysis in young, old, and demented adults using automated atlas-based head size normalization: reliability and validation against manual measurement of total intracranial volume.Neuroimage2004;23:724 –38 19. Keihaninejad S, Heckemann RA, Fagiolo G, et al.A robust method to estimate
the intracranial volume across MRI field strengths (1.5T and 3T).Neuroimage
2010;50:1427–37
20. Ashburner J, Friston KJ.Unified segmentation.Neuroimage2005;26:839 –51 21. West J, Warntjes JB, Lundberg P.Segmentation and volume estimation on a
sub-voxel basis using quantitative MR: a validation study. In:Proceedings of the 18th Annual Meeting of the International Society for Magnetic Resonance in Medicine,Stockholm, Sweden. May 1–7, 2010:3898
22. Heister D, Brewer JB, Magda S, et al.Predicting MCI outcome with clinically available MRI and CSF biomarkers.Neurology2011;77:1619 –28