ORIGINAL RESEARCH
CT Analysis Demonstrates That Cochlear Height
Does Not Change with Age
M.C. Mori K.W. Chang
BACKGROUND AND PURPOSE: CH measurements can often be useful in the diagnosis of inner ear malformations associated with SNHL. Our aim was to establish the relationship between CH and age by using analysis of CT images in patients who underwent coronal CT scans of the temporal bone between 2001 and 2007.
MATERIALS AND METHODS: We measured CH on coronal CT scans of the temporal bone of 422 ears scanned from 2001 to 2007 in 211 patients, 1 month to 23 years of age. Using multivariate linear regression analysis, we determined the relationship of CH to age, sex, and HL type. In addition, 11 patients with multiple scans at different ages were assessed for change in CH with age.
RESULTS: Average CH was 5.3 mm (normal range, 4.4 – 6.2 mm). Analysis showed no statistically significant change in CH across ages from 1 month to 23 years (95% CI for regression line slope⫽ ⫺0.003, 0.013). Likewise, there were no statistically significant differences in CH for patients with multiple scans at different ages. ICW increased with age as expected with increased cranial size. A small difference in CH between sexes was noted with males having greater CHs than females (P⬍ .01). All patients with hypoplastic cochleas, defined by a CH⬍2 SDs from the mean (4.48 mm for males and 4.25 mm for females), had HL with a positive predictive value of 86%.
CONCLUSIONS:CH does not change from 1 month of age to adulthood and is slightly greater in males than in females.
ABBREVIATIONS:CH⫽cochlear height; CHL⫽conductive hearing loss; CI⫽confidence interval; HL⫽hearing loss; ICW⫽intercochlear width; SNHL⫽sensorineural hearing loss
C
ochlear malformations are well-established causes of con-genital SNHL in children. Cochlear anomalies such as common cavity deformity, cochlear aplasia, cochlear hypopla-sia, and incomplete partition (classic Mondini deformity) are thought to result from the premature arrest in cochlear devel-opment during various stages of gestation. These abnormal cochleas have fewer than the standard 2.5–2.75 cochlear turns and diminished cochlear size.1Recent studies have sought to increase the number of radiographically recognizable causes of congenital SNHL, because historically only 20%–39% of children with congenital SNHL have an associated radio-graphic abnormality.2-4A study by Purcell et al5found that measuring the CH resulted in the identification of twice as many cases of cochlear hypoplasia associated with SNHL as with visual inspection alone.6While there are normative val-ues for CH, these valval-ues have not been differentiated by age or sex.Previous studies have examined fetal and postnatal co-chlear growth and have shown that the cochlea ceases growth and undergoes ossification between gestational weeks 16 and 25.7-9However, these studies are limited by small sample sizes and age ranges. There has never been a
comprehensive radiologic study of CH with age from shortly after birth to adulthood in living patients with large sample size, to our knowledge. Clinically, it is important to establish norms for CH for specific ages and sex to facilitate diagnosis of cochlear hypoplasia and other congenital mal-formations of the cochlea. Finding specific anatomic anom-alies associated with HL can help direct treatment—for ex-ample, in surgical planning for patients receiving cochlear implants and research into the developmental causes of congenital HL.
Materials and Methods
This study was reviewed and approved by the Stanford University institutional review board.
Patient Population
This study included 211 patients (123 male, 88 female) with 396 ears undergoing temporal bone CT from 2001 to 2007 at Lucile Packard Children’s Hospital, Stanford, California. Eleven patients had multi-ple temporal bone CT studies, with an average time of 2.6 years, max-imum time of 5.5 years, and minmax-imum time of 0.8 years between scans. Patients ranged from 1 month to 23 years of age, with an aver-age aver-age of 7.3 years aver-age. Divided into quartiles by aver-age, the patients in the first quartile had an age range of 0.1–3.1 years, the second quartile had an age range of 3.1– 6.4 years, the third quartile had an age range of 6.4 –10.6 years, and fourth quartile had an age range of 10.6 –23.4 years. Patients underwent temporal bone CT as part of their routine radiologic evaluation for diagnoses, including, but not limited to, normal hearing with otologic symptoms, SNHL, CHL, mixed HL, cholesteatoma, otalgia, and external ear deformities. Patients with temporal bone CT scans were included regardless of hearing status or specific indications for radiologic examinations.
Received November 5, 2010; accepted after revision May 1, 2011.
From the Department of Otolaryngology–Head and Neck Surgery, Stanford University School of Medicine, Palo Alto, California.
Matthew Mori was supported by a Stanford Medical Scholars Research Fellowship. All research was completed at Lucile Packard Children’s Hospital, Stanford, California. Please address correspondence to Kay W. Chang, MD, Department of Otolaryngology— Head and Neck Surgery, Stanford University, 801 Welch Rd, Palo Alto, CA 94305; e-mail: [email protected]
http://dx.doi.org/10.3174/ajnr.A2713
HEAD
&
NECK
ORIGINAL
CT of the Temporal Bone
All studies were performed at the Lucile Packard Children’s Hospital by using standard temporal bone protocol. Contiguous 1-mm scans of the temporal bone were acquired in the axial and coronal plane with a Somatom Sensation 64-detector row system (Siemens, Malvern, Pennsylvania). Studies were reviewed by using PACS with magnification and electronic caliper capabilities.
CH Measurements
Measurements were taken by a single reader by using electronic cali-pers and recorded in units of millimeters at a magnification of 4, center of 200, and width of 4000. CH was defined as the measurement from the midpoint of the basal turn to the midpoint of the apical turn taken perpendicular to the axes of the cochlear lumens in the coronal view (Fig 1).5It was measured on the cut with the maximum height that included the basal and apical turns. The distance between the left and right cochlea (ICW) was also measured in each scan.
Statistics
We used Excel (Microsoft, Redmond, Washington) to record and analyze our data. Normative values were determined by using 74 nor-mal-hearing ears, 52 from male patients and 22 from female patients. We calculated averages and SDs. CH was considered normal if it was within 2 SDs of the sex-specific normative mean CH. Two-samplet test statistical analysis was used to compare CHs of normal-hearing patients with the CHs of SNHL, CHL, mixed HL, and unknown-hearing status in patients grouped by unknown-hearing status and sex. For the relationships among CH and sex and age, we used multivariate linear regression analysis.
Audiometry
Audiology data acquired by the audiologists at Lucile Packard Chil-dren’s Hospital was used to classify patients’ hearing into 5 categories. On the basis of the audiology results, we recorded a classification of normal hearing, SNHL, CHL, or mixed HL for each ear. Patients who did not have audiology tests were classified as having “unknown” hearing.
Results
Patient Population
A total of 211 patients (422 ears) was included in this study. This included 162 ears with SNHL, 101 ears with CHL, 25 ears
with mixed HL, 74 ears with normal hearing, and 60 ears with unknown hearing.
CT
CH by Sex and HL Type.Results of the CH measurements are presented in Table 1. When we controlled for age and ICW, multivariate linear regression analysis showed a statistically significant difference between male and female CH, with a regression coefficient of 0.12 (P⬍.01). Female patients had an average CH of 5.2 mm (95% CI, 4.3– 6.1 mm), while male patients had an average CH of 5.3 mm (95% CI, 4.5– 6.2 mm). Two-samplettest also demonstrated a statistically significant difference between male and female CHs for normal-hearing patients (P⬍.05). Normal-hearing females had a mean CH of 5.3 mm (95% CI, 4.6 – 6.0 mm) and normal-hearing males’ mean CH was 5.5 mm (95% CI, 4.7– 6.2 mm). In the compar-ison of HL type and CH, we noted that the mean CHs of ears with SNHL and mixed HL were significantly less than the mean CHs of ears with normal hearing. There was no statisti-cal difference between left CH and right CH.
CH versus Age.CH is plotted versus age in Fig 2. The re-gression line equation for the relationship between CH and age for all categories of hearing is CH⫽0.005[Age]⫹5.22. The regression coefficient was not statistically significant (95% CI, 0.003– 0.013). Even when regression coefficients were calculated dividing the population by hearing category, the 95% CI always included zero, again demonstrating that CH was not affected by age. Using the 2-samplettest, we also compared the CHs of patients divided into quartiles by age with no statistical difference between the groups. Most signif-icantly, the CHs of the first quartile (ages, 0.1–3.1 years) were not statistically different from those of the fourth quartile (ages, 10.6 –23.4 years).
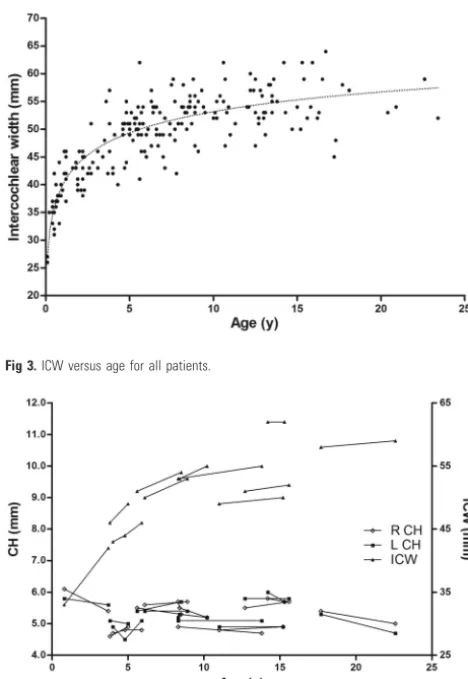
CH versus ICW.In contrast to the lack of change in CH growth, ICW increased logarithmically with age (equation: ICW⫽5.7 Ln[Age]⫹40) as seen in Fig 3. Using multivariate
[image:2.594.91.247.42.188.2]Fig 1.Cochlear height measured from the midpoint of the basal turn to the midpoint of the apical turn on a coronal section.
Table 1: Results of CT studies of CHa
Hearing
Category No. of Ears Min. Max. Mean SD PValue
SNHL (all) 162 2.5 6.1 5.23 0.46 .002b
Males 90 4.0 6.1 5.29 0.37 .004b
Females 72 2.5 6.1 5.16 0.55 .33
CHL (all) 101 4.2 6.1 5.32 0.37 .09
Males 61 4.2 6.1 5.38 0.39 .17
Females 40 4.7 6.1 5.24 0.33 .60
Mixed HL (all) 25 3.4 5.5 4.67 0.69 ⬍.00001b
Males 11 3.4 5.5 4.53 0.69 ⬍.00001b
Females 14 3.5 5.4 4.79 0.70 .008b
Normal (all) 74 4.5 6.3 5.42 0.38 1
Males 52 4.5 6.3 5.48 0.38 1
Females 22 4.6 6.0 5.28 0.35 1
Unknown (all) 60 4.6 5.9 5.29 0.30 .04
Males 32 4.6 5.9 5.32 0.35 .06
Females 28 4.6 5.6 5.26 0.26 .82
Total (all) 422 2.5 6.3 5.26 0.45
Males 246 3.4 6.3 5.32 0.43 .009c
Females 176 2.5 6.1 5.18 0.47
Note:—Min. indicates minimum; Max, maximum.
a
Two-samplettestPvalues are for comparisons among SNHL, CHL, mixed HL, or unknown-hearing ears and normal-hearing ears divided by all, male, or female.
b
Statistically significant differences (P⬍.01).
cFor the comparison of male and female CHs, multivariate linear regression controlling for
[image:2.594.300.531.62.265.2]linear regression controlling for age and sex, we found ICW to have no statistically significant relationship with CH (95% CI, ⫺0.005– 0.013), indicating that CH was not affected by skull size.
Patients with Multiple Imaging Studies at Different Time Points.Results are plotted in Fig 4. Logarithmic growth is evident in the plot of ICW versus age, while CH does not change significantly with age. The mean slope of the lines con-necting individual patient’s CH data points is⫺0.03 (95% CI,
⫺0.11– 0.04), demonstrating no significant changes in CH with age. The mean slope of the lines connecting individual patient’s ICW data points is 1.13 (95% CI, 0.50 –1.75), dem-onstrating statistically significant changes in ICW with age.
Patients with Small CHs.All patients with hypoplastic co-chleas, defined by a CH⬍2 SDs from the calculated normal-hearing CH mean,⬍4.48 mm for males and 4.25 mm for females, had either SNHL, CHL, or mixed HL. Two of the patients had branchio-oto-renal syndrome, 2 patients had CHARGE syndrome, 1 patient had bilateral vestibulocochlear dysplasia with a unilateral Mondini malformation, 1 patient had enlarged vestibular aqueduct syndrome, and 1 patient had bilateral class II microtia with external auditory canal atresia.
Discussion
In this study, we examined the relationship between postnatal cochlear size and age. The human cochlea has long been thought to cease growing before birth. In the third week of gestation, the cochlea initially begins as the otic placode, an ectodermal thickening that develops into the whole inner ear. By the eighth to ninth week of gestation, the cochlea has grown and completed its coiling into 2.5–2.75 turns.1,10However, after the first trimester, it has been difficult to assess the exact timing of the end of cochlear growth and development due to lack of fetal specimens.10Before imaging was widely available, the complete maturation of the cochlea without further growth was thought to be true largely because ossification of the otic capsule is complete by approximately 20 –25 weeks gestation.11
More recent studies have analyzed images of small sample sizes of fetal museum specimens to estimate cochlear growth cessation. A study published in 2004 by Jeffery and Spoor8by using high-resolution MR imaging of 41 late first trimester to early third trimester fetal museum specimens from the early to mid-20th century showed that the height and width of the basal turn of the cochlea reaches adult equivalent size by 16 –19 weeks gestation. Another study by Nemzek et al9by using 18 fetal specimens and CT or MR imaging found that the length of the basal turn of the cochlea and the otic capsule of the fetus reached adult dimensions by approximately 21 weeks’ gestation. Postnatal growth of the cochlea has been measured in even fewer studies. One postmortem study of 27 children from 12 hours to 12 years of age by Eby and Nadol7 showed no significant changes in CH or width with age. Our study used a greater number of patients with a broader age range than previous studies. By showing no statistically signif-icant change in CH with age, our data signifsignif-icantly strengthen the existing belief that the cochlea does not grow postnatally. Although CH does not change with age, average CH varies with hearing status and sex. Patients with SNHL and mixed HL demonstrate significantly smaller CHs compared with normal-hearing patients. While cochlear hypoplasia alone is associated with SNHL, it is only one of the malformations resulting from arrested or aberrant development of the inner ear at various stages of embryogenesis.1Some of these other congenital abnormalities, such as dilated vestibular aqueduct, can coexist with cochlear hypoplasia and are independently associated with SNHL. The cochlear malformations seen in our patients with cochlear hypoplasia (Table 2) included aplastic modiolus, hypoplastic modiolus, Mondini deformity,
Fig 2.CH versus age categorized by patient hearing category. The upper dashed line (4.48 mm) is 2 SDs below the male mean CH. The lower dashed line (4.25 mm) is 2 SDs below female mean CH.
Fig 3.ICW versus age for all patients.
[image:3.594.54.283.46.198.2] [image:3.594.51.285.242.581.2]and vestibulocochlear dysplasia. Also there are many causes of mixed HL and SNHL that do not involve small cochleas. Thus, the sensitivity of cochlear hypoplasia in identifying patients with mixed HL or SNHL is low. Our data showed a sensitivity of⬃6%. However, cochlear hypoplasia is a useful predictor of SNHL. Six of the 7 patients with cochlear hypoplasia had mixed HL or SNHL, giving cochlear hypoplasia a positive pre-dictive value of 86% for an associated mixed HL or SNHL. Therefore, it is important to measure CH given the relatively low percentage of associated radiographic abnormalities iden-tifiable with congenital HL. As found in previous studies, stan-dard measurements of the cochlea can double the identifica-tion of cochlear hypoplasia as a congenital malformaidentifica-tion associated with SNHL.5
We also found that CH differs between males and females. This difference is likely not functional but should be used in establishing sex-specific CH normative measurements to aid in the diagnosis of cochlear hypoplasia. In our study normal CHs were 5.2 mm (95% CI, 4.3– 6.1 mm) in females and 5.3 mm (95% CI 4.5– 6.2 mm) in males. Similar sexual dimor-phism has been demonstrated in separate studies measuring cochlear length and the vestibular apparatus.12,13
Interscan variation was evidenced by our CH measure-ments of patients with multiple scans. Cochlear height mea-surements differed by as much as 0.7 mm among scans of the same ear. This variability could be due to differences in CT scan orientation or image quality.
There were several limitations to this study. There was only 1 reader. Multiple readers would increase the reliability and reproducibility of our data. CT scans were not uniformly aligned. This means that we measured the CH through slightly different cuts, depending on the orientation of the scan. Ideally, we would reformat each cochlea on the basis of ana-tomic landmarks to capture an anaana-tomically standardized CH. However, we chose our method without reformatting because it is more consistent with clinical practice and still offers a good estimate of CH. Time between scans for patients with multiple scans was relatively short. Although we were able to assess significant changes in ICW, long intervals between scans are ideal for assessing CH changes, especially if the scans are obtained right after birth and once the patient reaches adult-hood. Another limitation is that we did not have any patients who were younger than 1 month of age. Theoretically, the cochlea could grow in the month after birth. However, we think that this is unlikely, given the evidence of studies show-ing cochlear growth cessation in fetal specimens.
Conclusions
[image:4.594.55.519.58.394.2]In conjunction with previous fetal specimen and postnatal postmortem studies, this radiologic study provides strong ev-idence that there is no cochlear growth postnatally. Although CH does not change from 1 month of age to early adulthood, CH does vary on the basis of sex, with males having slightly greater measurements than females. In addition, the average Table 2: Patients with cochlear hypoplasiaa
Patient
Age (yr) Sex
L CH (mm)
R CH
(mm) TYPE HL Diagnosis CT Findings
1 6.3 2.8 2.5 SNHL, Bilateral vestibulocochlear dysplasia,
L Mondini malformation
Bilateral vestibulocochlear dysplasia
Female bilaterally R common chamber malformation, absent vestibular
aqueduct, aplastic modiolus
L Mondini malformation (hypoplastic cochlea with partition defect)
2 1.9
Male
3.4 3.6 Mixed HL BOR syndrome Bilateral dilated vestibular aqueduct with small modiolus, trumpet-shaped IAC, small mass in R middle ear (possible congenital cholesteatoma)
3 0.8
Female
3.7 3.5 Mixed HL BOR syndrome Bilateral tympanostomy tubes, hypoplasia of modiolus, vestibular ectasia, dilated vestibular aqueducts, Mondini deformities (cochlear ectasia with partition defects), question of ossicular fusion
R middle ear and mastoid air cell opacification; absent vs hypoplastic stapes
L hypoplastic mastoid with soft tissue thickening at L mesotympanum
4 6.7
Female
3.6 4.3 Mixed HL,
bilaterally
CHARGE syndrome Bilateral hypoplastic SCCs, prominent EAC, vestibular dysplasia, cochlear ectasia with partition defects, hypoplastic stapes
R sclerosis of ossicles, poorly visualized oval window, L poorly defined modiolus
5 0.1
Male
4.2 3.8 Mixed HL,
bilaterally
CHARGE syndrome Bilateral absent SCCs, middle ear/mastoid air cell congestion or inflammation, normal middle ear morphology
6 6.6 4.0 4.5 SNHL, EVA syndrome Bilateral enlarged vestibular aqueducts, R cochlear
Male bilaterally implant, L hypoplastic modiolus
7 7.1
Male
4.2 4.3 CHL,
bilaterally
Bilateral class II microtia and EAC atresia
R malformed IAC, partially formed middle ear cavity, poorly defined ossicles, narrow EAC, normal SCCs/ vestibule
L absent lateral SCC, vestibular dysplasia, ossicular dysplasia, absent membranous EAC, normal cochlea
Note:—R indicates right; L, left; IAC, internal auditory canal; SCC, semicircular canals; BOR, branchio-oto-renal; EVA, enlarged vestibular aqueduct; EAC, external auditory canal..
a
CH is smaller in patients with mixed HL or sensorineural HL than in patients with normal hearing. Normative sex-specific CH measurements can be used across all ages to diagnose co-chlear hypoplasia. Using 2 SDs below the mean, we found that CHs below 4.48 mm in males and 4.25 mm in females were useful thresholds to define cochlear hypoplasia resulting in HL.
References
1. Jackler RK, Luxford WM, House WF.Congenital malformations of the inner ear: a classification based on embryogenesis.Laryngoscope1987;97(3 pt 2 suppl 40):2–14
2. Jensen J.Malformations of the inner ear in deaf children: a tomographic and clinical study.Acta Radiol Diagn (Stockh)1968(suppl 286):283⫹
3. Mafong DD, Shin EJ, Lalwani AK.Use of laboratory evaluation and radiologic imaging in the diagnostic evaluation of children with sensorineural hearing loss.Laryngoscope2002;112:1–7
4. Chen JL, Gittleman A, Barnes PD, et al.Utility of temporal bone computed tomographic measurements in the evaluation of inner ear malformations. Arch Otolaryngol Head Neck Surg2008;134:50 –56
5. Purcell D, Johnson J, Fischbein N, et al.Establishment of normative cochlear and vestibular measurements to aid in the diagnosis of inner ear malforma-tions.Otolaryngol Head Neck Surg2003;128:78 – 87
6. Purcell DD, Fischbein NJ, Patel A, et al.Two temporal bone computed tomog-raphy measurements increase recognition of malformations and predict sen-sorineural hearing loss.Laryngoscope2006;116:1439 – 46
7. Eby TL, Nadol JB Jr.Postnatal growth of the human temporal bone: implica-tions for cochlear implants in children.Ann Otol Rhinol Laryngol1986;95(4 pt 1):356 – 64
8. Jeffery N, Spoor F.Prenatal growth and development of the modern human labyrinth. J Anat2004;204:71–92
9. Nemzek WR, Brodie HA, Chong BW, et al.Imaging findings of the developing temporal bone in fetal specimens.AJNR Am J Neuroradiol1996;17:1467–77 10. Pujol R, Lavigne-Rebillard M, Uziel A.Development of the human cochlea.
Acta Otolaryngol Suppl1991;482:7–12, discussion 13
11. Bast T.Ossification of the otic capsule in human fetuses.Carnegie Contribu-tions to Embryology1930;121:53– 82
12. Sato H, Sando I, Takahashi H.Sexual dimorphism and development of the human cochlea: computer 3-D measurement.Acta Otolaryngol 1991;111: 1037– 40