Anomalous Behaviour Detection using Heterogeneous Data
Azliza Mohd Ali
This dissertation is submitted for the degree of Doctor of
Philosophy
March 2018
i
Dedicated to my husband, Hasrin and my sons: Zaim, Wafi and Aqil, whose always gives
unconditional loves and support;
to my parents, without whom I would not be where I am today optional
ii
Declaration
I certify that work presented in this thesis has not been submitted in support of an application for another degree at this or any other university. It is the result of my own work and includes nothing that is the outcome of work done in collaboration except where specifically indicated. Many of the ideas in this thesis were the product of discussion with my supervisor Prof. Plamen Angelov. Wherever contributions of others are involved, I have taken extra care to indicate this clearly, with due reference to the literature.
iii
List of Publications
1. Mohd Ali, A., & Angelov, P. Computational Intelligence Techniques for Biometrics and Forensics: A Survey. In UKCI 2015
2. Gu, X., Angelov, P., Mohd Ali, A., & Gruver, W. A. (2014). Online Evolving Fuzzy Rule-Based Prediction Model for High-Frequency Trading Financial Data Stream. In Evolving and Adaptive Intelligent Systems (EAIS), 2016 (pp. 1–9). IEEE. http://doi.org/10.1109/EAIS.2016.7502509
3. Mohd Ali, A., Angelov, P., & Gu, X. (2016). Detecting Anomalous Behaviour Using Heterogeneous Data. In Advances in Computational Intelligence Systems: Contributions Presented at the 16th UK Workshop on Computational Intelligence, September 7–9, 2016, Lancaster, UK (pp. 253–273). Springer. http://doi.org/10.1007/978-3-319-46562-3
4. Mohd Ali, A., & Angelov, P. (2017). Applying Computational Intelligence to Community Policing and Forensic Investigations. In Community Policing - A European Perspective (pp. 1–16). http://doi.org/10.1007/978-3-319-53396-4
5. Wang, X., Mohd Ali, A., & Angelov, P. (2017). Gender and Age Classification of Human Faces for Automatic Detection of Anomalous Human Behaviour. In International Conference on Cybernetics (CYBCONF 2017) (pp. 1–6). IEEE.
http://doi.org/10.1109/CYBConf.2017.7985780
6. Mohd Ali, A. & Angelov, P. (2018) Anomalous Behaviour Detection Based on Heterogeneous Data and Data Fusion. In Soft Computing: A Fusion of Foundations, Methodologies and Applications. (pp 1-15). Springer. https://doi.org/10.1007/s00500-017-2989-5
iv
Abstract
v
vi
Acknowledgements
Alhamdulillah and thank you, Allah. All praise to the most Gracious and Merciful Almighty who makes this journey possible, without whom nothing is possible. I would like to thank my supervisor Prof. Plamen Angelov. Thank you for your patience, guidance, encouragement, inspiration and advice throughout my time as your student. I am fortunate to have a supervisor who always cared about my work, and who responded to my questions and queries so promptly. Thank you also to my lab mate, Xiaowei Gu, who is always help me in any problem that I had. I will always remember your kindness and your support during my study. I would like to thank all the members of School of Computing and Communications for assisting throughout my study here.
To my beloved husband, Hasrin Abu Hassan, thank you for your endless love, sacrifice and support especially before I began my study and along my PhD journey. Thank you for believing me that I can do it. My sons, Hassan Zaim, Hassan Wafi and Hassan Aqil, I always love you. To my parents, Mohd Ali and Azaiyah, my mother in law, Mariah, my brothers, Azlizam and Azlimin, and my in-law, Shuhada, thank you for prayer, love, and everything.
To my Pandora Chics, Juliana, Irni, Liyana and Anis thank you for always be a good listener and never-ending support. Thank you also to all my Malaysian friends for being like my family here. Thank you to my sponsor, Ministry of Higher Education and Universiti Teknologi MARA for giving the opportunity to study abroad further and giving financial support. Lastly, to all, who involved in this journey, thank you for your support and prayers. Thank you, Allah.
vii
Table of
Contents
Dedication………....…………i
Declaration………..ii
List of publications……….iii
Abstract………...iv
Acknowledgement………..vi
List of Tables………...…….x
List of Figures………...……….…….xi
List of Abbreviations……….………...xiii
1 INTRODUCTION ... 1
Problem definition ... 1
1.1 Aims and Objectives ... 3
1.2 Contributions of the Thesis ... 3
1.3 Thesis Structure ... 4
1.4 2 LITERATURE REVIEW ... 7
Digital Forensics ... 7
2.1 Biometrics ... 14
2.2 Heterogeneous Nature of the Human Behaviour Data ... 20
2.3 Anomaly Detection ... 23
2.4 Data Fusion ... 32
2.5 Summary ... 43
2.6 3 RESEARCH METHODOLOGY ... 45
Challenges ... 45
3.1 Proposed Approach ... 47
3.2 Summary ... 51
3.3 4 DETECTING ANOMALOUS BEHAVIOUR ... 53
Introduction ... 53
viii
Summary ... 68 4.3
5 GENDER AND AGE CLASSIFICATION BASED ON IMAGES FOR DETECTING
ANOMALOUS BEHAVIOUR ... 69
Introduction ... 69 5.1
Gender and age classifications ... 70 5.2
Deep learning ... 70 5.3
Summary ... 74 5.4
6 DATA FUSION OF HETEROGENEOUS DATA FOR DECISION MAKING . 75
Introduction ... 75 6.1
Data Fusion ... 75 6.2
Data transformation ... 76 6.3
Fusion technique ... 82 6.4
Summary ... 84 6.5
7 EXPERIMENTAL DATA ... 85
Heterogeneous Data ... 85 7.1
VAST Challenge 2014 ... 86 7.2
Face Image Dataset - GAFace Dataset ... 88 7.3
Summary ... 95 7.5
8 RESULTS AND ANALYSIS ... 96
Introduction ... 96 8.1
Anomaly Detection Results ... 96 8.2
Image Data Results ... 109 8.3
Data Fusion Results ... 114 8.4
Summary ... 119 8.5
9 EVALUATION ... 120
Introduction ... 120 9.1
Comparison of anomaly detection ... 120 9.2
Summary ... 126 9.3
x
List of Tables
Table 2.1 Categories And Comparison of Biometric Systems (High, Medium and Low are
denoted by H, M, and L, respectively [68]) ... 15
Table 6.1: Sample data after calculating the degree of suspicion in terms of the distance ... 82
Table 7.1: Description of Datasets ... 87
Table 7.2: Sample of GPS Data ... 87
Table 7.3: Sample of Car Assignment Data ... 87
Table 7.4: Sample of Credit Card Data ... 88
Table 7.5: Sample of Loyalty Card Data ... 88
Table 7.6: Descriptions of datasets ... 89
Table 7.7: Samples of images from GAFace dataset ... 89
Table 7.8: Sample images of each class ... 89
Table 8.1: Location legend ... 103
Table 8.2: Description on abnormal trajectory ... 108
Table 8.3: Haar-like features and classification SVM rates (accuracy) ... 112
Table 8.4: Pre-trained net results ... 112
Table 8.5: Confusion matrix of age classification ... 112
Table 8.6: Confusion matrix of gender classification ... 113
Table 8.8: Results of data fusion ... 115
Table 8.9: Example of several cases of different gender ... 118
Table 8.10: Weighted Total ... 118
Table 9.1: Labels in the comparison table ... 123
Table 9.2: Comparison of anomalies detected using credit card data ... 123
Table 9.3: Comparison of anomalies detected using credit card data (without 10000 spending data) ... 124
Table 9.4: Comparison of anomalies detected using loyalty card data ... 125
xi
List of Figures
Figure 2.1: Example of point anomaly ... 27
Figure 2.2: Durrant -Whyte’s Classification Based on the Relations between the Data Sources [130] ... 35
Figure 2.3: Darasathy’s Classification [130] ... 36
Figure 2.4: JDL Data Fusion [130] ... 38
Figure 2.5: Classification based on the type of architecture [130] ... 40
Figure 3.1: Research Framework ... 47
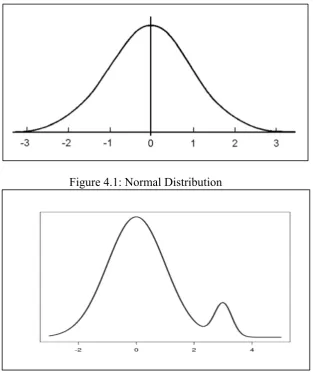
Figure 4.1: Normal Distribution ... 55
Figure 4.2: Arbitrary Distribution ... 55
Figure 4.3: Histogram plot of temperature in Manchester from 2010 to 2012 ... 56
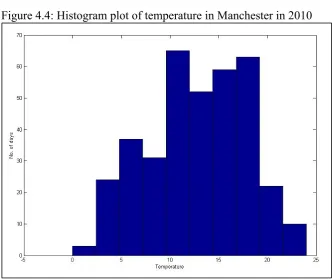
Figure 4.4: Histogram plot of temperature in Manchester in 2010 ... 57
Figure 4.5: Histogram plot of temperature in Manchester in 2011 ... 57
Figure 4.6 Histogram plot of temperature in Manchester in 2012 ... 58
Figure 4.7: Plotting the temperatures and days from 2010 to 2012 ... 58
Figure 4.8: Plotting the temperatures and days in 2010 ... 59
Figure 4.9: Plotting the temperatures and days in 2011 ... 59
Figure 4.10: Plotting the temperatures and days in 2012 ... 60
Figure 4.11: Eccentricity of temperature from 2010 to 2012 ... 66
Figure 4.12: Eccentricity of temperature in 2010 ... 66
Figure 4.13: Eccentricity of temperature in 2011 ... 67
Figure 4.14: Eccentricity of temperature in 2012 ... 67
Figure 5.1: Difference between machine learning approaches and knowledge transfer approaches [Ling Shoa 2015] ... 72
Figure 5.2: AlexNet Structure ... 73
Figure 5.3: Pre-trained net application structure ... 74
Figure 6.1: Degree of suspicion – credit card ... 78
Figure 6.2 : Degree of suspicion – Loyalty card ... 79
Figure 6.3: 50 metres distance from the car park to the shop location ... 80
Figure 6.4: 555 metres distance from the car park to the shop location ... 81
Figure 6.5: 700 metres distance from the car park to the shop location ... 81
xii
Figure 8.2: RDE on loyalty card data – 6σ ... 97
Figure 8.3: RDE on loyalty card data – 3σ ... 98
Figure 8.4: RDE on credit card data – 3σ ... 98
Figure 8.5: Anomaly on credit card usage ... 100
Figure 8.6: Anomaly on money spend, day and staff ID ... 101
Figure 8.7: Anomalies based on the credit card transaction data after removing the first anomaly ... 101
Figure 8.8: Anomalies based on the money spend, day and staff ID after removing the first anomaly ... 102
Figure 8.9: Anomalies by the loyalty card data ... 102
Figure 8.10: Anomalies by the loyalty card data, day and staff ID ... 103
Figure 8.11: Comparison of the total spending using credit card and loyalty card in different locations ... 103
Figure 8.12: Total spending per person using credit card data ... 104
Figure 8.13: Total spending per person using loyalty card data ... 104
Figure 8.14: Total spending per day using credit card data- Staff Member no.31 ... 104
Figure 8.15: Total spending per day using loyalty card data – Staff Member no.31 ... 105
Figure 8.16: Total spending using credit card data per day at Frydos Autosupply ... 105
Figure 8.17: Total spending using loyalty card data per day at Frydos Autosupply ... 105
Figure 8.18: Eccentricity of travel time, distance and trajectory angle ratio and normal and abnormal behaviour. ... 107
Figure 8.19: Example of abnormal and normal trajectory ... 107
Figure 8.20: Anomalies detected based on the travel time using 5σ ... 108
Figure 8.21: Anomalies detected based on distance using 5σ ... 108
Figure 8.22: Anomalies detected based on the ratio of the trajectory angle using 5σ ... 108
Figure 8.23: Comparison of the trajectory for staff member no.31 (left) and staff member no.41 (right) ... 109
Figure 8.24: Example rectangle features shown relative to the enclosing detection window. Figure (A) and (B) show two-rectangle features. The three-rectangle feature shown in figure (C), and (D) shown a four-rectangle feature. ... 111
Figure 8.25: Details on data no.1 ... 117
Figure 8.26: Details on data no.2 ... 117
xiii
Figure 8.28: Comparison between original data and fused data ... 119
Figure 9.1: Distribution of UK income from 2012 to 2013 [156] ... 122
xiv
List of Abbreviations
CSI : Crime Scene Investigation DNA : Deoxyribonucleic Acid GPS : Global Positioning System EDA : Empirical Data Analytics
DFRWS : Digital Forensics Research Workshop ANN : Artificial Neural Network
SVM : Support Vector Machine k-NN : k-Nearest Neighbour GAs : Genetic Algorithms FL : Fuzzy Logic
ML : Machine Learning
ALS : Autonomous Learning Systems RDE : Recursive Density Estimation CNN : Convolutional Neural Network PCA : Principle Component Analysis CCTV : Closed-circuit Television ECG : Electrocardiogram
NLP : Natural Language Processing IDS : Intrusion Detection Systems TPM : Topology Preserving Mapping JDL : Joint Directors of Laboratory KF : Kalman Filter
HCI : Human-Computer Interaction DoD : Department of Defense
PDA : Probabilistic Data Association PIR : Passive Infrared
MRI : Magnetic Resonance Imaging
fMRI : functional Magnetic Resonance Imaging sMRI : Structural Magnetic Resonance Imaging EEG : Electroencephalography
xv
tIVA : transposed Independent Vector Analysis DCxWT : Daubechies Complex Wavelet Transform DTCWT : Dual-Tree Complex Wavelet Transform LWT : Lifting Wavelet Transform
MWT : Multiwavelet Transform SWT : Stationary Wavelet Transform CT : Contourlet Transform
NSCT : Nonsubsampled Contourlet Transform WSNs : Wireless Sensor Networks
QoS : Quality of Service BA : Blowfish Algorithm
GM-KRLS : Grey Model – Kernel Recursive Lease Squares ReLU : Rectified Linear Unit
NLP : Natural Language Processing
VAST : Visual Analytics Science and Technology ROC : Receiving Operating Characteristics PR : Precision-Recall
1
1
Introduction
Problem definition 1.1
2
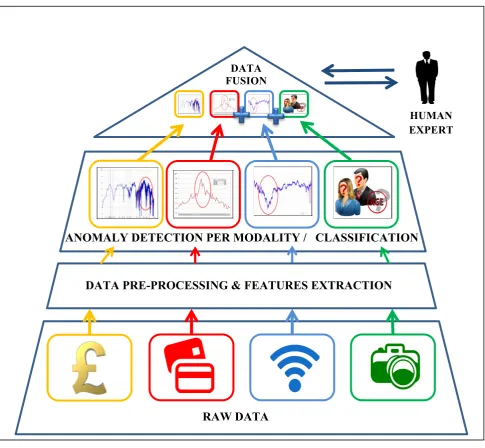
Human behaviour can be identified from everyday routine. Every day, waking up, taking a shower, having breakfast, then going to work is an example of a normal routine which we can consider normal human behaviour. This routine human behaviour can be tracked digitally; for example, if we have surveillance cameras at home, all activity there can be recorded. When going to work by car, if a Global Positioning System (GPS) is installed, then trajectory data can be traced. If we buy a coffee at the café or groceries and pay using a debit or credit card, data about financial and transaction can be retrieved. Data also can be created from mobile applications such as WhatsApp, Telegram, or email. All information about communication in the applications can be processed to produce a pattern of communication. This is a simple example of data on human behaviour that can be easily retrieved. People nowadays carry electronic devices everywhere they go. They may connect to the Wi-Fi to access the internet. Details of each person can be easily retrieved in real-time from interconnected devices. All of this data contains information about human behaviour.
Anomaly detection is one of the most important methods to find and process abnormal data [4], as this method can distinguish between normal and abnormal behaviour. Anomaly detection has been applied in many areas, such as the medical sector [5], fraud detection in finance [6], fault detection in machines [7], intrusion detection in networks [8], surveillance systems for security [9], as well as forensic investigations [6], [10]. Abnormal behaviour can give information or provide answers during an investigation. Anomaly detection is one way to simplify the big data. We can focus on the data that has been clustered by the anomaly detection method. In this study, a new method to detect abnormal behaviour is proposed in different datasets, combining anomalies and evidence from images automatically.
3
data fusion include addressing data ambiguity, as data fusion can improve detection, confidence, and reliability [11]; and the use of multiple sensors, which can improve the result of estimation or velocity (e.g., in tracking moving the object by radar) [12]. Data fusion is a challenging task. According to Lahat et al. [13], there are three challenges in data fusion:
a) data produced from very complex systems such as biological, environmental, sociological and psychological systems;
b) increased diversity, including the number, type, and scope of the data;
c) working with heterogeneous datasets, meaning that the respective advantages of each dataset are maximally exploited and drawbacks suppressed.
In this study, data fusion is applied to challenge problem in heterogeneous data. This study applies many types of data and integrates all using data fusion techniques.
Aims and Objectives 1.2
a) Develop a new framework and methods for detecting anomalies in heterogeneous data.
b) Develop new algorithm which combines anomaly detection result using data fusion technique and constructing diagram and sequence of events.
c) Improve the computational efficiency and assist the human expert in processing huge amount of data proficiently.
Contributions of the Thesis 1.3
4
a) Heterogeneous data
This study applied different data modalities. In a real situation, data may come from different modalities. Therefore, this study applied data on numerical (financial data), signal data (GPS) and images (face images).
b) Anomaly detection on heterogeneous data
Anomaly detection was applied to find possible anomalies in the original data. This method is novel because it is applied to different data modalities (financial data and GPS signals), is based on new technique recursive density estimation (RDE) and does take context into account.
c) Data fusion for detecting anomalous behaviour
This is a new technique and algorithm for data fusion by integrating heterogeneous data to produce well-organised and summarised data. Data fusion helps in making overall decision based on heterogeneous types of data.
Thesis Structure 1.4
This thesis consists of ten chapters, including this introductory chapter. This section presents an overview of each chapter throughout the research journey of the author.
Chapter 2: Literature Review
5
Chapter 3: Research Framework
Chapter 3 present the challenges of the study and overall view of research framework implemented in this study.
Chapter 4: Detecting Anomalous Behaviour
This chapter discusses how to detect anomalous behaviour using heterogeneous data. The new methodology of empirical data analytics (EDA) is employed to detect possible anomalies. There are two publications generated from this study. [10], [14]
Chapter 5: Gender and Age Classification for Detecting Anomalous Behaviour
In this chapter, the study uses face images to classify gender and age. Transfer learning is applied based on the deep convolutional neural network to extract the features. Then they are classified using support vector machine classifier. There is one publication generated from this study. [15]
Chapter 6: Data Fusion of Heterogeneous Data for Making the Overall Decision
6
Chapter 7: Experimental Data
This chapter details the dataset that has been used in this study as a proof of concept. There are two main datasets: the one coming from the VAST Challenge 2014 [17] and one called GAFace.
Chapter 8: Result and Analysis
This chapter discusses the results of the experiments with the data. Then, the analysis of the results is discussed.
Chapter 9: Evaluation
This chapter compares the proposed method with other comparative methods and discusses the outcome from this comparison.
Chapter 10: Conclusion
7
2
Literature Review
Digital Forensics 2.1
8
A definition of digital forensics was provided by the Digital Forensics Research Workshop (DFRWS) in 2001. The participants of the DFRWS workshop suggested a definition of digital forensic as follows:
Digital Forensics is the use of scientifically derived and proven methods towards the
preservation, collection, validation, identification, analysis, interpretation, documentation and presentation of digital evidence derived from digital sources for the purpose of
facilitating or furthering the reconstruction of events found to be criminal, or helping to anticipate unauthorized actions shown to be disruptive to planned operations.
This definition concerns the methods used in digital forensics, which is transitioning from the traditional methods in forensic science [19]. According to Pratama et al. [2], digital forensic science is a method to preserve, collect, validate, identify, analyse, interpret, document and present digital evidence derived from digital sources. Digital forensic principles, procedures and methods shared by practitioners such as defence consultants, corporate investigators, criminal prosecution and compliance officers make the process in digital forensics becomes advanced [19]. Recently, the number and size of digital sources such as in the hard disks, smartphones, tablets and cloud services have grown exponentially. Crimes can involve a network. For instance, fraud often occurs in e-commerce or e-business. Digital evidence such as video or photo images can be used in the court to solve crime cases. Quick & Choo [20] found that a major challenge in the digital forensic analysis is the growth of storage technology and increased storage capacity in consumer devices or cloud storage devices. They also identified the research gap in digital forensic data, including data reduction techniques, data mining, intelligence analysis, and the use of an open and closed source of information. This also includes the application of real-world data and the acceptance of the courts.
9
a) Image integrity analysis (with 137,518 publications) b) Surveillance object tracking (32,823 publications) c) Fingerprint analysis (29,485 publications)
Research into shoeprint analysis (175), bloodstain analysis (2,008) and surveillance image restoration (3,872) have the smaller number of publication for the same period [2]. Moreover, there are many challenges in digital forensics. The major challenge is the evolution of storage technology [21], [20], and ‘big data’ [19]. Another challenge is system reliability and accuracy, response time, and protecting user privacy [22]. In cybersecurity, real-time response is essential in digital forensics, and providing results in real-time is not as important. The data to be investigated is more significant [21].
2.1.1 Machine learning for forensics
10
Machine learning is closely related to statistics and data mining and can be used in making predictions. Approaches to machine learning include the decision tree, artificial neural network, support vector machine, clustering and genetic algorithm. Forensic applications apply these approaches to solving a problem. Mangesh et al. [23] and Navega et al. [24] applied machine learning in forensic anthropology to detect the sex of skeletons. Mangesh et al. combined neural network and support vector machine in the cranial metric dataset and achieved 80% accuracy in classifying male and female skulls. Navega et al. [24] achieved an 88.3% success rate in classifying the sex of the skeleton using a Portuguese sample with a statistical and machine learning method.
Cybercrime is a cybersecurity problem which can apply machine learning to assist in digital forensics. Cyberstalking is a cybercrime in which the suspect or cyberstalker may send email, SMS or instant messages to harass, threaten or insult victims. Zinnar et al. [25] created a framework on cyberstalking to help in finding the identity of the cyberstalker. They discussed a few machines learning methods such as a artificial neural network (ANN) and support vector machine (SVM) to be applied to categorise text to identify a cyberstalker. Reynolds et al. [26] applied a decision tree and instant based learning techniques to determine cyberbullying in the social network with 78.5% accuracy. Al-gharadi et al. [27] applied Twitter network data to detect cyberbullying using machine learning techniques such as Naive Bayes, SVM, Random Forest and k-nearest neighbour (KNN). Then, they proposed a model that provides a feasible solution to detecting cyberbullying.
11
applied Behaviour-Knowledge Space method to classify the image and later point out the area of forgery.
2.1.2 Computational Intelligence for forensics
Computational Intelligence is a fast-growing research field and widely used in the digital forensics. It has many real-world applications such as biometric authentication and identification [31] [32]. Applications include face detection, iris recognition, speech recognition, handwriting and signature recognition [32]. Computational intelligence can be applied to simplify the processes of investigation and analysis of criminal cases and in forensics. It can substitute or augment the human intelligence. The use of computational intelligence is hoped to be better than humans in performing various forensic activities [2]. Forensics is a post-event activity [18]. Forensic investigation begins after a crime takes place and is a crucial task. It requires skills and time to solve the cases. Computational intelligence can be used in assisting the process of investigation. There are many techniques which involve computational intelligence, such as knowledge representation, automated reasoning, inference, pattern recognition techniques and machine learning that can be applied to digital forensic investigation and analysis [10]. Computational intelligence has great potential in finding patterns and solving issues in cyber-security and digital forensics [21]. Computational intelligence is based on biologically inspired computation such as artificial neural network (ANN), genetic algorithms (GAs), and fuzzy logic (FL), and is included in computational intelligence such as machine learning (ML) and autonomous learning systems (ALS).
12
There are many types of ANN, including feedforward neural network, multi-layer perceptron, radial basis function, and Kohonen self-organizing network [35]. ANN training can be divided into supervised and unsupervised learning. In supervised learning, a neural network obtains different input patterns and determines important features in these input patterns, categorising the data into the right categories. However, unsupervised learning only has input patterns without output data. It aims to learn more quickly than supervised learning. Therefore, it can be used in real time [36].
GAs are inspired by Darwinian evolution [37]. The major role in GAs is selection, mutation, and crossover. The algorithm is based on fitness function to optimise problems [34]. The GAs process starts with generating the population of chromosomes randomly. It represents all possible solutions to a problem. Different chromosome positions (referred as genes) are set as bits, characters and numbers. The fitness function is used to calculate each of chromosomes based on the desired solution [38]. Genetic operators simulate the random variation of a chromosome which modify and combine chromosomes [33]. For example, the crossover is used to exchange part between two single chromosomes to produce offspring [39], and mutation will randomly change individual genes [33].
13
are not limited to true or false but in some degree of true or false. Fuzzy logic can use vagueness to get a better answer [39].
Fuzzy logic is a technique that can be applied in forensic investigations. For example, Al Amro et al. [41] combined fuzzy inference with linguistic variables to detect the security threats. Fuzzy systems are more efficient when detecting anomalous behaviour [41]. Classification and clustering using fuzzy techniques produce an effective result, such as when dealing with malicious attacks [41]. Also, fuzzy logic can be instrumental in forensic investigations, because it is a human-intelligible and transparent form of expression, has excellent robustness and scalability and can deal efficiently with the subjective type of uncertainty and ambiguous cases. Many forensic applications are based on ANN techniques [42]. For example, Boo and Ahalakoon [43] applied Growing Self-Organizing Maps (GSOM) to perform crime profiling computationally, mimicking the human profiling processes. Rodriguez et al. [44] applied Growing Neural GAs (GNG) in surveillance systems to detect and interpret the action in video sequences. GNG is a kind of self-organising network introduced in the early 1990s. Beebe and Liu [45] compared clustering algorithms for digital forensic text string search output. Research showed that the Latent Dirichlet Allocation and k-means method produces best results.
14
Specific techniques and methods that fall into the category of ALS include, but are not limited to:
a) Evolving Clustering - eClustering [55], Evolving Local Means [56], Dynamically Evolving Clustering [57], Data Density Based Clustering [58], and Evolving Clustering Method [59]
b) Evolving Classifier - eClass [60][61], AutoClassify [46] and TEDAClass [62] c) Evolving Predictors - eTS [63], neuro-fuzzy systems with nonparametric
antecedents called AnYa [64]; evolving controllers [65][66], self-calibrating sensors and eSensor [60]
d) Anomaly detection method within EDA – RDE [46] and standardised eccentricity The pillar of ALS is their ability to develop an internal structure in response to changing data patterns based on the computationally efficient recursive density estimation (RDE) method [46]. In addition to that, the evolving Takagi-Sugeno fuzzy system forms human-intelligible linguistic descriptions which are easy to understand and interpret. Indeed, humans solve problems based on rules. Therefore, fuzzy rule-based systems can help forensic investigators in decision-making by producing sets of rules to solve the cases. For example, AnYa is a type of fuzzy rule-based systems with simplified linguistic expressions in comparison with the Mamdani and Takagi-Sugeno types [46]. Therefore, such a rule-based system can be more efficient in extracting knowledge from data as well as to formalise the existing expert knowledge. Hence, it can assist forensic investigators in solving cases.
Biometrics 2.2
15
each other. Biometrics concern a pre-event activity while forensics is the post-event activity [18]. Biometrics is used to identify and verify a person's identity. Identification of a person using biometric techniques is reliable, unlike presenting an ID card, for example. Biometric system properties include the following [68]:
[image:31.595.146.450.424.631.2]a) Universality b) Uniqueness c) Permanence d) Measurability e) Performance f) Acceptability g) Circumvention
Table 2.1 Categories And Comparison of Biometric Systems (High, Medium and Low are denoted by H, M, and L, respectively [69])
Biometric Category a b c d e f g Physiological • Face • Fingerprint • DNA • Palmprint • Iris H M H M H L H H H H M H H H H H M L M M L H H H H H M L M L H M L M L Behavioural • Keystroke • Signature • Voice • Gait L L M M L L L L L L L L M H M H L L L L M H H H M H H M
16
[68]. The identification process uses biometrics because of uniqueness. People cannot borrow, steal, or forget biometric traits. Biometric authentication is an automatic method used to identify and verify users using unique physiological or behavioural traits. Physiological traits are biometric features that are owned by the people. Examples of physiological traits include fingerprint, iris, ear and facial characteristics. The leading biometrics widely used in forensic applications include fingerprints, facial characteristics, and iris patterns [22].
Fingerprint identification has been used since the eighteenth century [3]. In 1970, law enforcement agencies such as Interpol, FBI, Home Office in the UK, and Police Department in Paris, started developing Automatic Fingerprint Identification Systems (AFIS) to improve the efficiency and accuracy of fingerprint matching [70]. Automatic fingerprint technology has been widely used in many applications such as PC logins, electronic commerce, ATMs and mobile phones [68]. Research on fingerprint identification systems still faces challenges related to system performance. The current challenge is the identification time [22]. Another challenge is related to latent fingerprint [71]. A latent fingerprint is a significant evidence taken from a crime scene. Its resolution, therefore, may differ from live-scanned fingerprints. It also needs special care to enhance the quality of feature extraction and matching operations.
The face is one biometric trait that can be easily captured from the surveillance systems. There are three main issues in capturing facial images in forensic investigation. These are:
a) facial image immutability over time b) facial image retrieval
c) matching forensic (sketched) images with real captured facial images
17
can be detected. Since 2001, there has been a great deal of research on detecting age and gender from face images [72][73][74].
The iris allows for high accuracy in identifying a person. Iris is better than other types of biometrics because of its uniqueness and is stable for extended periods of time [75], [67]. According to Awad and Hassanien [22], one issue regarding iris is related to capturing the iris images. User misbehaviour can lead to problems when capturing irises. Problems include blurred irises and irises occluded by eyelids and eyelashes. The new direction of individual identification and authentication is to use saccadic eye movement [22]. Additionally, it requires very close physical positioning of the person.
Behavioural traits concern the behaviour of individuals that are acquired and learned over time. Gait, signature, voice, handwriting and keystroke dynamic are examples of behavioural traits. Gait is an evolving biometric and attracts many researchers and industry [76]. Gait is defined as the way of walking and can be recognised at a distance. Thus, gait can be captured from a surveillance video. However, choice of footwear, walking surface, nature of clothing, and so on can affect the individual’s gait [70]. A signature is a behavioural form of biometric influenced by physical and emotional factors and may change over time [70]. Authentication using signature biometrics does not require special devices. It only uses a pen and a piece of paper. Signature played a significant role for centuries in document authentication, for example, in banking, government documents, forum applications, and so on. Therefore, signature biometrics is widely used in forensic applications. The aim of using signature biometrics in forensics is to prevent crime from happening [77].
18
many activities on the Internet such as email, online banking and online shopping. If an authentication system is not safe, private profiles can easily be accessed. Pisani and Lorena [81] stated that passwords are a method of authentication but can easily be copied and guessed. An access card can be used as authentication but can be stolen. There are many identity thefts because of the weaknesses of the passwords. Keystroke dynamics are a form of biometrics that can be used without additional cost because they incorporate the common keyboard. Compared to a traditional signature, the system still needs to define which users are legal and which are illegal.
2.2.1 Machine learning for biometrics
Machine learning is a technique that has been successfully applied in biometrics. Images or signals are common data needed in biometric systems. Face recognition is a biometric system that has been under research since the 1960s. The convolutional neural network (CNN) is one of the latest technique that been implemented in face recognition. Nakada et al. [82] proposed an active face recognition system to identify human behaviours in three common scenarios: changing viewpoint, greeting, and ignoring. For classification, K-NN produces 90% results compared with SVM and linear regression at only 20%. Wen et al. [83] also applied CNN to recognise the face. Ucar et al. [84] studied face expression using a new technique with a curvelet transform and online sequential extreme learning machine, then spherical clustering to find the optimal hidden node.
19
the augmented labelled training data. Reynard and Terrier [86] and Shirakawa et al. [87] used gait to determine healthy adults by looking their gait on the treadmill. Reynard and Terrier [86] applied random forest and multiple adaptive regression splines to access the preferred walking style for an adult who can influence their gait. However, Shirakawa et al. [87] clustered the walking pattern of adults. They applied principle component analysis (PCA) and hierarchical clustering.
The EEG signal is fast becoming one of the most popular modalities for biometric authentications. EEG signals can be used in identification as an alternative to password, PIN or card which can be forgotten or stolen. Bashar et al. [88] applied SVM and get 94.44% accuracy in identifying human using EEG signal. Johannesen et al. [89] also applied SVM with EEG data but to classify working memory performance in healthy human and
schizophrenia patient. They achieved 87% of accuracy on distinguishing individuals with
schizophrenia. However, most methods for EEG signal acquisition are intrusive and require a special electrode head-set to be able to work which makes them inconvenient.
2.2.2 Computational Intelligence for biometrics
20
Sánchez et al. [90] and Sánchez and Melin [91] applied modular granular neural networks and genetic algorithm for human recognition based on iris and ear. They reported good results in human recognition based on both, iris and ear of individuals. Mai et al. [92] applied a multilayer perceptron and radial basis function type ANNs to identify electrocardiogram (ECG) signal of individuals. Beltrán et al. [93] combined ANNs and fuzzy logic methods to find patterns in the fingerprint. GAs is used to optimise the fuzzy rules and then to combine these with ANNs. This research obtains good results especially for blurred patterns in fingerprint analysis. Tiwari et al. [94] researched retrieving face images using Self-Organizing Map type of Neural Networks. They proposed an algorithm that can retrieve an image in one second. Research is done in [95] applied kernel-based machine learning to recognise face and iris. There is research on human classification using gait features. They applied SVM and achieve higher results [96], [97]. Boyadzieva and Gluhchev [98] classified forgeries into random and skilled categories by verifying the online signature using K-nearest neighbour (KNN) method combined with ANNs. These are only some of the many reported types of research applying computational intelligence to biometrics to produce better results.
Heterogeneous Nature of the Human Behaviour Data 2.3
21
Digital data such as text and images from social media are an example of unstructured data which have different modalities and are sometimes too short and contain noise. Due to the enormous amount of data, data scientist processed all of this data to produce beneficial results which can assist the expert in making decisions. Data science is a new area of study which helps to process and extracting knowledge and information in various forms [100]. For example, when people go shopping and buy grocery, the supermarket gives customers a loyalty card. Customers give personal information to the supermarket, and they can establish spending behaviour from shopping lists using data mining techniques. Special offers will be given on selected items a particular customer purchases, and this will make the customer happy and loyal to the supermarket. Moreover, there are many ways to detect human behaviour which later can help an investigator if sometimes abnormal happens.
22
The data can be seen as a raw material (e.g. facts, numbers, letters and symbols) that can be extracted from observations, experiments, computation and record keeping [107]. Until the 1980s, most data were scattered. Text data can be found in documents such as letters, reports, books or journals and processed as image data (analogue photography, radio, and telephony; images were produced from negative film or drawing, and signal data can be recorded using vinyl records or compact cassette and transmitted through analogue communications). Text data is unstructured and requires the natural language processing (NLP) technique to pre-process the data. Features such as keywords, topics, and so forth need to be extracted from the data. Then, the text data can be processed to produce information. Image data differs from text data. Digital images consist of binary representations. Many formats are available, such as jpg, bmp, gif and png. The size of the digital images is based on the number of pixels. There are several steps in pre-processing digital images such as image resampling, segmentation, grey scale and noise removal. Previously, all of this data had to be processed manually before becoming useful information. The process is difficult and time-consuming.
23
[110]. With digitalisation, traditional databases have moved to network data infrastructure and more data is publicly available, leading to data revolution which brought to life the term “big data”. In business, for example, big data providing new resources for company activities and can leverage additional profit by enhancing productivity, competitiveness and market knowledge.
Heterogeneous data includes data forms or types such as qualitative or quantitative, structured or unstructured, and primary or secondary. In reality, most situations or applications will produce heterogeneous data such as when the crime takes place; evidence can be in the form of many types of data. The combination of all the data types can produce rich information insights. Nowadays, data becomes ‘big’ because it is generated every second of every day. The processing part is time-consuming and tedious. Also, different data must be processed differently based on data features. Features extraction need to be carried out to select the relevant features. This phase is a pre-processing phase. After processing data, anomaly/outliers can be detected, and in statistics, outliers should be removed to prevent errors in results [111]. However, in some situations such as forensic applications, anomalies or outliers can represent significant information.
Anomaly Detection 2.4
24
and outputs of the anomaly detection [112]. Anomaly detection is crucial in the analysis of fraud detection, drift detection in data streams [113], clustering, outlier detection and autonomous video analytics [4]. The result of such detection is used in many applications such as intrusion detection in cybersecurity [114], fraud detection [6], surveillance system [115] and military surveillance of enemy activities [116].
Traditionally, anomaly detection is addressed using statistical methods where frequentistic techniques representing probabilities are applied, and prior assumptions must be made [4]. The main decision is traditionally made using threshold values. These thresholds are based on the normal distribution of random variables (usually assuming Gaussians) while for arbitrary distributions, they are based on the well-known Chebyshev inequality [4]. These approaches have the following disadvantages [4]:
a) they require strict prior assumptions;
b) they relax the conditions too much to avoid false positives to the level where it misses many true positives (the3σ rule sometimes fails to detect some obvious outliers);
c) Many data samples are required;
d) a single data sample is compared with the average, instead of comparing pairs of data samples; therefore, the information is blurred and is no longer point-wise and local. According to [4], eccentricity can be applied to avoid the disadvantages of the traditional statistical method. This approach does not require any prior assumption, and aσgap can be
formulated between the eccentricities of the data samples with the larger eccentricity [4]. 2.4.1 Types of Anomaly
25
attributes value from the rest of the data. This type of anomaly can be identified in appropriate visualisation [117]. The simplest plot is two-dimensional. For example, figure 2.1 shows points A1, A2 and A3 as anomalies since they are far away from the other points and have different features. An example of real-life application is an individual’s credit card transactions. If the amount spent is very high compared to another spending, this is known as a point anomaly.
Contextual anomalies refer to a specific context [112]. For example, in the same credit card transaction, if we take the time and the amount spent, then we can relate why there is too much spending in December, because of so many things to buy during Christmas and can be considered normal. However, it will be an anomaly if the spending is too high in May. Contextual anomalies are mostly applied to time series data. Another example of time series data is the temperature in climate data. During the summer season, it is normal to have a temperature between 15o to 30o during summer time in England. If the temperature is below 5o during summer, then it can be considered an anomaly. It is not easy to define the context
and to depend on data and applications.
26
2.4.2 Categories of anomaly detection
Anomaly detection can be categories into three main types[117]: a) supervised
b) semi-supervised c) unsupervised.
Supervised anomaly detection has normal and anomalous data in the training set, and the data has a label. Then, this data usually can be trained by supervised machine learning to find the anomaly. The difference between supervised machine learning and supervised anomaly detection is that the training data is unbalanced. The probability of anomalies is usually below 5% (0.05) [117]. This anomaly detection can be categorised as extremely rare because anomalies are by nature often new and occur for the first time. Due to this, anomaly detection is also known as novelty detection. The axioms of anomalies also state that anomalies differ in their features and are rare [117].
Semi-supervised anomaly detection looks similar to supervised anomaly detection. However, in semi-supervised anomaly detection, normal data are used in the training data, and the testing phase will be used to find the anomalies [117]. The anomalous class or target does not need to be known in advanced. The traditional method of semi-supervised anomaly detection is using clustering algorithms [117]. Normal data will be clustered during the training phase, then in the testing phase, the distance to the cluster centre is computed. If the data has a large distance to the centre, it may be considered anomalous.
27
for unsupervised anomaly detection that anomalies need to be rare, and the features must be different from the normal behaviour. The algorithm normally performs density estimation such as done by [46].
Figure 2.1: Example of point anomaly 2.4.3 Chebyshev Inequality
Chebyshev inequality is a theorem in probability theory introduced by a Russian mathematician Pafnuty Chebyshev in 1867. Chebyshev inequality normally used when data distribution is unknown. It is calculated as follows [118]:
2
1 (| | ) (1 )
P X k
k
µ σ
− ≤ ≥ − (2.1)
Where X denotes the data, µ is represent the mean of data, σ is the standard deviation of the
28
independent of each other because there is no assumption on data distribution. At least 75% of the data would fall within two standard deviations (k=2) from the mean [118].
If the data is normally distributed (based on Gaussian) and represents a significant amount of data sample, the vast majority of the data is 99.7% is considered normal (if use3σ) [4]. The
probability of the data is anomalous is 0.3%. In order cases, where the data distribution is unknown, Chebyshev inequality is applied when no more than 12
n of the data samples are
more than nσ (where σ denotes the standard deviation) the away from the mean [4]. The
probability of data point distant from the mean is greater: for example, 3σ is 1
9
< (11%). A
large amount of data can be considered anomalous. Therefore, for this case (unknown distribution), many researchers use 6σ (to get 3% or 1
36
< ) or even higher if the data is
declared anomalous [4].
2.4.4 Thresholds based (subjective) method
The simplest statistical anomaly detector is the simple threshold method. This method is commonly used in IT analytic applications. If the data falls inside or outside a specific range of values then the simple threshold method flag data as anomalous [119]. This method is very fast to compute and required virtually no CPU or memory to compute and suitable for thousands of metrics data for the need for straightforward detection. Simple threshold methods have the following disadvantages:
29
b) A simple threshold can generate many false positives because it cannot learn new changes or behaviour. For example, if IT staff increases memory on a server, the percentage of memory used may fall below a threshold.
c) The threshold does not consider the temporal sequences. Therefore, the simple threshold cannot identify a pattern within the range.
The threshold in anomaly detection also called nσ principles. In the normal distributed
random variable, for example, Gaussian, if used 3σ , >99.7% will be considered “normal”
and probability of abnormal data is <0.3%. Another example is if used 2σ , the percentage of
normal is 95.45% and abnormal 4.55% [4]. In any distribution of data, Chebyshev inequality is applied which state that no more than 12
n of the data points are more than nσ away from
the mean (where σ denotes the standard deviation) [4].
2.4.5 How to define “normality.”
Before detecting an anomaly in data set, normal data should be defined first. It is not easy to define normality. For example, in a medical application, small deviation might be abnormal such as fluctuation in body temperature, though similar deviation in the stock market might be considered as normal [112]. Therefore, it is not straightforward to apply any anomaly detection technique one application to another. Most of the anomaly detection is a problem specifically because it is not easy to solve anomaly detection problem in general. Various factors are involved such as nature of data, availability of labelled data, types of anomalies to be detected [112]. Many studies applied statistics, machine learning or data mining techniques to a specific problem formulation [112].
30
2.4.6 Applications of Anomaly Detection
Anomaly detection is a method or process to identify data samples which is different from normal behaviour in datasets. In statistics, anomaly or outliers will be removed to get a better result of analysis [120]. Anomalies or outliers are important in some applications. Anomalous data can help solving a problem and giving a better solution for a certain problem such as in forensic applications, medical diagnosis, and surveillance systems. This method has been successfully applied in:
a) Intrusion detection systems (IDS) – IDS can monitor cyber-attacks or cyber threats in the network systems and server applications. Anomaly detection evaluates monitoring data against normal baseline and will issue an alert if there is an occurrence of the abnormal behaviour. Challenges in IDS are the big heterogeneous data which need to be processed in real-time [8]. Zuech, Khoshgoftaar, and Wald [8] stated that correlating security events from various heterogeneous sources such as network and server could enhance the cyber threat analysis and cyber intelligence. Machine learning can be used to learn the nature of the normal traffic behaviour autonomously, which can adapt normal structure and recognise suspicious or anomalous events [121]. This technique can detect unknown attacks and not be restricted to any specific environment.
31
created; the system can analyse spending behaviour patterns of the user. If an inconsistency appears throughout the transaction, then the suspicious activity can be detected [124].
c) Medical applications – Patient monitoring such as electrocardiography (ECG) is an example of a medical application that utilises anomaly detection. ECG is a test that produces a signal from the heartbeat to monitor possible heart problems [125]. The reported application also develops a new algorithm based on time series to detect an abnormality in the ECG signal. However, the algorithm cannot be applied to large datasets in real-time interaction. Meanwhile, Salem, Guerassimov, Marcus, and Furht, [52] also detected anomalies in ECG using a combination of various patient metrics such as blood pressure, body temperature, respiration rate, and blood glucose level. This study develops a wireless sensor network to detect an anomaly in the patient’s body and achieved high detection accuracy.
d) Surveillance systems – Surveillance systems use closed-circuit television (CCTV) and are installed in buildings for security purposes. The system analyses suspicious movement recorded in the video and categorised them as an abnormal activity. Examples of surveillance system applications have been reported in [115], [126]. A surveillance system applied to the train platform to monitor people jumping or falling off train platform is reported in [115], which can be considered as an abnormal activity, while Li, Mahadevan, and Vasconcelos [126] created a model of the crowded scene and applied benchmark dataset to detect an anomaly in the pedestrian walkway. These two applications were utilised in crowd environment and Delgado, Tahboub, and Delp [115] claim their system to be capable of achieving 90% accuracy in detecting an anomaly. Li et al. [126] achieved a better result as compared with other techniques.
32
aircraft to observe enemy activities. In [116] authors apply topology preserving mapping (TPM) and Pallotta, Vespe, and Bryan [127] applied rule-based and log-likelihood methods to detect an anomaly. These are unsupervised methods. TPM can capture and visualise vessels’ behaviour, and have a probability estimator which later can evaluate likelihoods and detect anomalies;
Data Fusion 2.5
33
performed during the routing process, sensor data is fused and only the results are forwarded. Thus, the number of messages is reduced, collisions are avoided, and energy is saved.
2.5.1 Challenging in Data Fusion
34
and non-human sensors [11]. Hall et al. [130] briefly discuss dynamic fusion of soft and hard data. They also present the motivation and challenges also advantages and requirements for data fusion of soft and hard data.
2.5.2 Data Fusion Classification Techniques
Data fusion is a combination of data and related information to improve information and produce a better decision. Data fusion has been employed in multisensor environments to achieve lower detection error probability and higher reliability based on multiple sources of data. Based on a review by [131], there are three nonexclusive categories of data fusion techniques: data association, state estimation and decision fusion. Data fusion is difficult to reach a clear and strict classification because it involves several fields in multidisciplinary areas. Data fusion techniques can be classified into the following [131]:
a) Classification based on the relation between the data sources This classification was introduced by Durrant-Whyte (figure 2.2):
i. Complementary – The input is the different part of information and then combined to obtain complete information. For example, two cameras provide information on the same target but with different fields of view;
ii. Redundant - Two or more inputs provide the same information and maybe overlapped. For example, input data are from overlapped areas in visual sensor network;
iii. Cooperative – Provided information is combined with new information which is more complex than the original information. For example, multimodal data fusion includes audio and video.
35
Dasarathy’s classification is one of the well-known data fusion classification systems and there are five categories in this classification (figure 2.3):
i. data in-data out – The most basic data fusion method. Data fusion process input and output raw data and the results are more accurate or reliable. Data fusion is processed immediately after received data from the sensors. Signal and image processing are the algorithms that will be applied at this level;
ii. data in-feature out – Data fusion is generated raw data from the sensor and extracts the features that explain in the environment.
iii. feature in-feature out – Features in the data fusion process are both the input and output. Therefore, the features in the data fusion a process are addressed to improve, refine, or obtain new features.
iv. feature in-decision out – Set of features is obtained as input, and set of decisions becomes an output.
v. decision in-decision out – This classification is decision fusion, which fuses the input decisions to acquire better decisions.
[image:51.595.124.472.485.716.2]
36
c) Classification based on the abstraction levels [132]
There are four abstraction levels: signal level, in which the signal from the sensor is directly addressed; pixel level, in which an image level is improved for image processing tasks; characteristic level, in which features are extracted from the image and signal; and symbol level, in which information is represented as symbols, known as the decision level.
[image:52.595.183.413.238.509.2]
Figure 2.3: Darasathy’s Classification [131] d) JDL Data Fusion Classification
The most popular conceptual model of data fusion was proposed by JDL and the American Department of Defense (DoD). They classified the data fusion process into five processing levels.
37
ii. level 1 – object refinement – Received data from level 0. Common procedures include spatiotemporal alignment, correlation, clustering, association, identify fusion and combine the features that have been extracted from images. Output from this level includes object discrimination (classification and identification) and object tracking (state of the object and orientation);
iii. level 2 – situation assessment – Higher level inference than level 1. This level purposes to identify the possible situation from the observed events and acquired data. It creates links between objects (e.g. proximity, communication). Performing high-level inferences and identifying significant events are also the aims of this high-level. The output from this level includes a set of high level inferences;
iv. level 3 – impact assessment – The impact of detected activities in level 2 is evaluated to acquire a proper perspective on this level. This level will evaluate the possible risks, vulnerabilities, and operational opportunities and then predicted the logical outcome;
38
Figure 2.4: JDL Data Fusion [131] e) Classification based on the type of architecture
When designing a data fusion system, a key issue is where the data fusion process will be implemented. The following are data fusion classifications based on the type of architecture:
i. Centralised architecture – The fusion node resides in the processor which in the centre of the architecture and all input sources received information in the processor;
ii. Decentralised architecture – Every network node has its processor, and there is no single point of data fusion. Data fusion is processed autonomously where every node fuses its local information with the information received from its peer;
iii. Distributed architecture – Each source node is processed independently. Then, the information is sent to the fusion node. Before the information is communicated with the fusion node, data association and state estimation are performed in the source node;
iv. Hierarchical architecture – This architecture is the combination of decentralized and distributed nodes. Data fusion is processed at a different level in the hierarchy.
39
2.5.3 Data Fusion Algorithms
Many algorithms have been developed to apply data fusion. Algorithms can be divided into data association, state estimation and decision fusion. Data association is the process of computing measurements that correspond to each other [131]. Nearest neighbours, k-means, probabilistic data association (PDA), joint probabilistic data association, distributed joint probabilistic data association, distributed multiple hypothesis test and graphical models are examples of data association algorithm. The basic algorithm to perform data association is nearest neighbours and k-means. These algorithms are clustering algorithms which calculate distances between instances and then cluster the instances.
State estimation technique is a tracking technique used to determine the state of the target based on observation and measurements [131]. The most common estimation methods
are maximum likelihood and maximum posterior, Kalman filter, particle filter, distributed Kalman filter, distributed particle filter and covariance consistency methods. Decision fusion is a high-level inference about event and activities that are produced from the detected target (normally use symbolic information). Examples of algorithms to apply decision fusion include Bayesian methods, Dampster-Shafer inference, Abductive reasoning and semantic methods
40
2.5.4 Data Fusion Applications
[image:56.595.74.519.69.570.2]Recently, there have been many applications developed for applied data fusion to produce better results and decisions. Data may be produced from sensors or other sources. A combination of different sources of data will create better results or decisions. Data fusion is
41
one way to combine data from many sources and provide decision or solution. Examples of applications that have applied data fusion include human detection, networking, transportation, medical and fraud system. These are some examples of successful applications applying data fusion.
a) Human Presence Detection
42
b) Medical imaging
Medical imaging refers to capturing images of the body for clinical and medical use. Examples of medical imaging include ultrasound image, x-ray image, radiography image and magnetic resonance imaging (MRI). Image modalities can be multiplied to improve the quality of imaging. Medical fusion imaging can be applied to get a better medical or clinical result. Adali et al. [135] used medical imaging from three modalities, namely functional magnetic resonance imaging (fMRI), structural MRI (sMRI), and electroencephalography (EEG). They are applying joint independent component analysis (jICA) and the transposed independent vector analysis (tIVA) models to enable fusion of data from the three image modalities. The results show that jICA produces a more desirable solution within the limited number of subjects. Singh and Khare [136] proposed a multimodal medical image fusion using Daubechies complex wavelet transform (DCxWT). They also compared the proposed fusion method with wavelet domain (Dual tree complex wavelet transform (DTCWT), Lifting wavelet transform (LWT), Multiwavelet transform (MWT), Stationary wavelet transform (SWT), spatial domain (Principal component analysis (PCA), linear and sharp), Contourlet transform (CT), and Nonsubsampled contourlet transform (NSCT) image fusion methods. The results show that the proposed method DCxWT produce better performance than another fusion method. These two examples of medical image fusion show that fusion techniques give significant results and can help in making decisions using multimodalities images.
a) Wireless Sensor Networks
43
the applications can increase confidence in the sensor measurements and minimize energy consumption [137]. Quality of service (QoS) is an important issue in data accuracy, delay in data aggregations and maximisation the lifetime network. Izadi [137] proposed research about the fuzzy-based approach for WSN to increase the QoS and reduce energy consumption. The proposed data fusion approach is compared with two baseline approaches in term of data collection, the data packet and energy consumption. Their research achieves better results compared to baseline approaches. Luo et al. [138] studied a prediction-based data sensing and fusion technique in WSN to reduce data transmission and maintain the coverage of sensor levels. The proposed technique is grey model – kernel recursive least squares (GM-KRLS), and Blowfish algorithm (BA). GM will predict data of the next period with a small number of the data item and KRLS will predict the value approximate the true value with high accuracy during data sensing and fusion. This proposed technique achieves high accuracy prediction, good scalability, and low communication and confidentiality. Besides the two examples of applications, there are much more research applying data fusion and received better results. Therefore, it can be concluded that applying data fusion in multisensor offers many benefits compared to a single sensor.
Summary 2.6
44
applications of anomaly detection also presented. There are disadvantages of Chebyshev inequality and threshold-based anomaly which later this study proposed the recent technique to detect an anomaly. The last section of this chapter explained on data fusion techniques, algorithms, applications and challenging in data fusion. Some challenges in data fusion are overcome in this study using the proposed data fusion technique. Next chapter will discuss the research methodology of this study.
![Table 2.1 Categories And Comparison of Biometric Systems (High, Medium and Low are denoted by H, M, and L, respectively [69])](https://thumb-us.123doks.com/thumbv2/123dok_us/9340544.436082/31.595.146.450.424.631/table-categories-comparison-biometric-systems-medium-denoted-respectively.webp)
![Figure 2.2: Durrant -Whyte’s Classification Based on the Relations between the Data Sources [131]](https://thumb-us.123doks.com/thumbv2/123dok_us/9340544.436082/51.595.124.472.485.716/figure-durrant-whyte-classification-based-relations-data-sources.webp)
![Figure 2.3: Darasathy’s Classification [131]](https://thumb-us.123doks.com/thumbv2/123dok_us/9340544.436082/52.595.183.413.238.509/figure-darasathy-s-classification.webp)
![Figure 2.5: Classification based on the type of architecture [131]](https://thumb-us.123doks.com/thumbv2/123dok_us/9340544.436082/56.595.74.519.69.570/figure-classification-based-type-architecture.webp)


![Figure 5.1: Difference between machine learning approaches and knowledge transfer approaches [Ling Shoa 2015]](https://thumb-us.123doks.com/thumbv2/123dok_us/9340544.436082/88.595.57.534.116.363/figure-difference-machine-learning-approaches-knowledge-transfer-approaches.webp)
