warwick.ac.uk/lib-publications
Manuscript version: Author’s Accepted Manuscript
The version presented in WRAP is the author’s accepted manuscript and may differ from the published version or Version of Record.
Persistent WRAP URL:
http://wrap.warwick.ac.uk/116644
How to cite:
Please refer to published version for the most recent bibliographic citation information. If a published version is known of, the repository item page linked to above, will contain details on accessing it.
Copyright and reuse:
The Warwick Research Archive Portal (WRAP) makes this work by researchers of the University of Warwick available open access under the following conditions.
Copyright © and all moral rights to the version of the paper presented here belong to the individual author(s) and/or other copyright owners. To the extent reasonable and
practicable the material made available in WRAP has been checked for eligibility before being made available.
Copies of full items can be used for personal research or study, educational, or not-for-profit purposes without prior permission or charge. Provided that the authors, title and full
bibliographic details are credited, a hyperlink and/or URL is given for the original metadata page and the content is not changed in any way.
Publisher’s statement:
Please refer to the repository item page, publisher’s statement section, for further information.
1
An efficient 2-way shear grillage model solution for bridge RC four-pile caps
under wall loading
Authors:
Dr Jing Cao
Senior Structural Engineer at HERA, New Zealand Email: [email protected]
Dr Alan G Bloodworth
Associate Professor, School of Engineering, University of Warwick, UK Email: [email protected]
Dr Ming Xu
Associate Professor, Department of Civil Engineering, Tsinghua University, China Address:
Email: [email protected]
Abstract
Reinforced concrete four-pile caps under wall loading occur in heavily-loaded foundations in
bridge construction. The failure mode of shear across the full width of the cap may occur in these
deep structural elements. A statically determinate two-way grillage model, comprising
orthogonal deep beam grillage elements obeying a predetermined test observed deflection
pattern and boundary conditions, is established to solve the structure’s shear capacity. The
model gives more accurate and faster solutions than the traditional strut-and-tie method and
commercial non-linear numerical modelling. A key step to solve the model is a linear constitutive
(load-deflection) relationship developed for the grillage elements. The grillage model is verified
against nine pile cap laboratory experiments at University of Southampton (UoS) and results of a
2
developed incorporating the model, enabling engineers to obtain the shear capacity, full field
reinforcement stress distribution and cap deflections within seconds.
Keywords: bridge foundation, reinforced concrete, pile cap, shear, deep beam deflection,
strut-and-tie, wall loading, grillage model, VBA Userform design software, constitutive relationship
Background
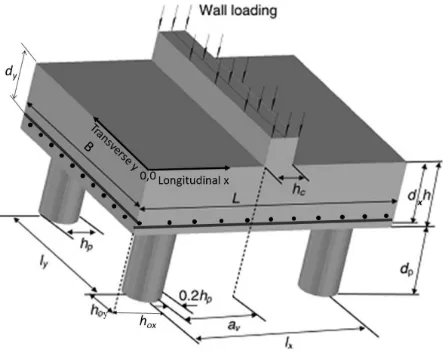
Reinforced concrete (RC) four-pile caps under wall loading serve as independent bridge
foundations or form a basic unit for multi-pile caps for heavily-loaded railway steel bridges, as
shown in Fig. 1, identifying its longitudinal and transverse directions (LD, TD). International
standards (BSI 2004, 2005; Standards Australia 2009) and previous research (Clarke 1973) provide
guidance on shear design under concentrated loads, either by a pyramid spatial strut-and-tie (ST)
model or by extending a semi-empirical one-way bending theory-based design method to the
two-way situation with a shear enhancement factor applied over a pile width. For wall loading,
engineers employ the same rules, which is too conservative (Cao 2009). By commercial
constraints in a design office, the real lower bound ST solution may never be found among
multiple ST layout options. A commercial nonlinear numerical model (NNM), obtaining either ST
topology or shear solution directly, may ill-converge at the paucity of test results for verification.
Advanced NNM in research (e.g. Cao 2009) is more accurate but not economic for use in design
3
Fig. 1. Dimensions of a typical bridge RC four-pile cap under wall loading
The authors developed a semi-empirical ST model (Bloodworth et al. 2012; Cao 2009), verified
against tests at UoS for caps over certain ranges of the geometric ratios n and μ (Table 1), which
are respectively the LD and TD pile spacings (lx, ly) divided by pile diameter (hp). An empirically
derived 90% of the LD reinforcement Ast was taken as the yielding tie, independent of μ.
Therefore, the model may not apply to cap configurations outside the test scope.
This research further develops a two-way grillage model representing true cap shear behaviour
for general application. The model employs for the grillage elements a well verified linear
4
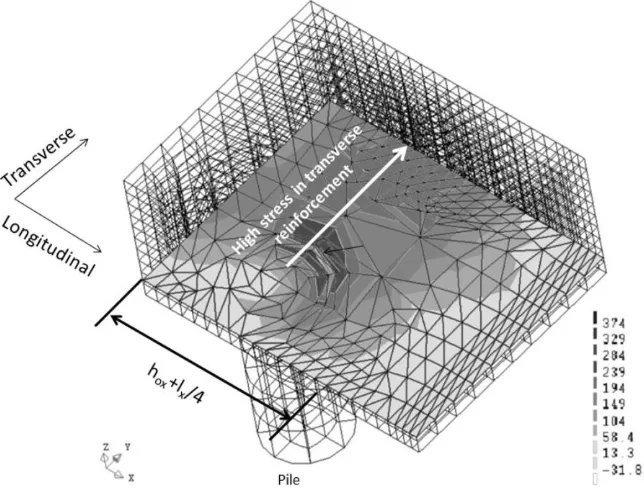
Table 1. Key dimensions (mm) of pile cap samples at UoS (B4xx – experiment, E1xx parametrical study – only four extreme samples
listed) Cap reference
Transverse direction (TD) Longitudinal direction (LD) Others
ly B dy hoy lx L dx hox hc hp h n=lx/hp μ=ly/hp lx /h ly /h
B4A1 300 500 187 100 800 1100 199 150 100 130 230 6.15 2.31 3.45 1.30
B4A2 300 500 187 100 650 950 199 150 100 130 230 5.00 2.31 2.86 1.30
B4A3 300 500 187 100 550 850 199 150 100 130 230 4.23 2.31 2.38 1.30
B4A4 300 500 187 100 500 800 199 150 100 130 230 3.85 2.31 2.17 1.30
B4A5 300 500 187 100 400 700 199 150 100 130 230 3.08 2.31 1.72 1.30
B4B1 300 500 190 100 650 950 200 150 100 130 230 5.00 2.31 2.86 1.30
B4B2 450 650 190 100 650 950 200 150 100 130 230 5.00 3.46 2.86 1.96
B4B3 550 750 190 100 650 950 200 150 100 130 230 5.00 4.23 2.86 2.38
B4B4 700 900 190 100 650 950 200 150 100 130 230 5.00 5.38 2.86 3.03
E1dl 1200 1400 187 100 300 600 199 150 100 130 230 2.31 9.23 1.30 5.26
E1ll 1200 1400 187 100 1200 1500 199 150 100 130 230 9.23 9.23 5.26 5.26
E1da 150 350 187 100 300 600 199 150 100 130 230 2.31 1.15 1.30 0.65
5
model predicts shear capacity, reinforcement stress distribution and cap deflection rapidly,
assisted by a VBA Userform based design software.
UoS experimental samples
The UoS experiments tested nine half-scale four-pile cap specimens, of which Fig. 2 is an example.
Cap series B4A1~B4A5 and B4B1~B4B4 covered the ranges 3.08<n<6.15 and 2.31< μ<5.38 (Table
1). Height to span ratios range 1.72<lx/h<3.45 and 1.30<ly/h<3.03. B4A1~B4A5 were designed
with constant μ (=2.31) but varying n. B4B1~B4B4, with lower reinforcement ratio, have constant
n (=5.0) but varying μ. These experiments were studied by advanced NMM which was then
applied in 88 numerical samples in a parametric study (Cao 2009), extending geometries to
2.31<n<9.23, 1.15<μ<9.23, 1.30< lx/h<5.26 and 0.65<ly/h< 5.26.
Pile cap shear behaviour
The proposed grillage model is developed to be compatible with the observed shear behavior:
1. Shear resistance develops both in LD and TD with major cracks running through front and
back surfaces and minor bending cracks on the side surface extend into the soffit (e.g. Fig.2).
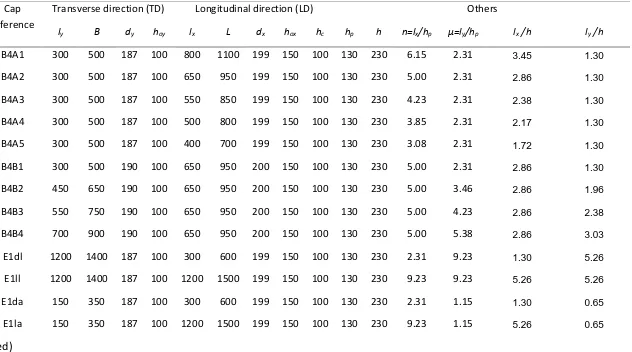
2. Reinforcement stress exhibits two-way behavior. LD stress (Fig.3) is constant at the yield
stress fy (=547MPa) along the span for a strip along the front surface, degrading towards the
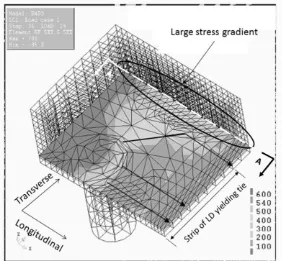
cap centre. Fig. 4 shows high TD stress over the pile head on a width approximately hox + lx/4.
3. The cap fails in a ductile LD ST mechanism, with tie width hoy+hp/2 width on each side.
6
Fig. 2. Experimental observation of a UoS test sample at shear failure (B4B3 n=5.00, μ=4.23)
Fig. 3. Numerical model of ¼ pile cap showing LD reinforcement stress (MPa) at shear failure
[image:7.612.77.359.391.652.2]7
Fig. 4. Numerical model of ¼ pile cap showing TD reinforcement stress (MPa) at shear failure
(B4B3 n=5.00, μ=4.23)
Proposed 2-way grillage model
The 2-way cap shear behaviour leads to a grillage model with orthogonal elements of one-way
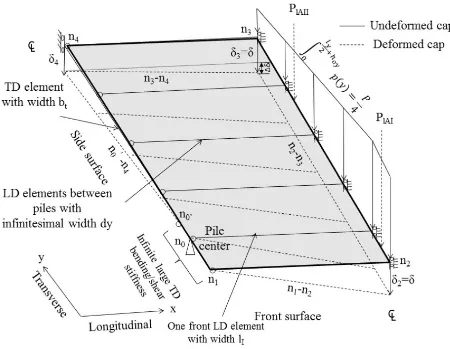
RC deep beams, as shown in perspective view in Fig. 5 for a ¼ cap with side views in Figs. 6 and
7. The model consists of one front LD element of width lI spanning over the piles, a continuum of LD elements with infinitesimal width dy over width lII (see Fig. 7 for lI and lII) and a TD element n1 -n0-n0’-n4 with width bt (Fig. 6), bearing distributed transverse loading (p(y) in Fig.7) from the LD
elements and transmitting shear to the front LD element at the pile inner edge through the point
n0’ of segment n1-n0-n0’. This segment is assigned infinitely large bending and shear stiffness due
to the short cantilever overhang. The resultant of p(y) is PtAII, and similarly PtAI is the resultant of
8
Fig. 5. Proposed grillage model for a ¼ pile cap under quarter of external load P
The model experiences uniform displacement under the wall loading (i.e. δ2= δ3=δ in Fig. 5) due
to high in-plane bending stiffness of the loading wall, which complies with practice and test
setups (Cao 2009). All elements are simply supported, deflecting linearly without shear
interaction between adjacent vertical surfaces. For the total force in the TD reinforcement to be
equal to that across cap length L/2 in reality, the proposed width of TD element n1-n0-n0’-n4,
above which there is negligible shear capacity gain in the model, is: 𝑏𝑡 = ℎ𝑜𝑥+ 𝑙𝑥
9
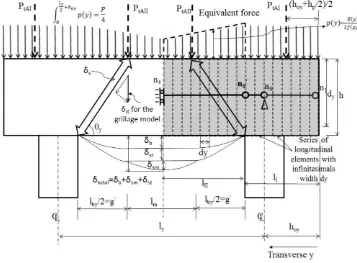
Fig. 6. Grillage elements and externally applied force seen from cap front surface
[image:10.612.83.440.424.687.2]10 Boundary conditions
In Fig. 5, the boundaries n2-n3 and n3-n4 are assigned with full moment restraints in the vertical
planes but with vertical shear released. The model is loaded along n2-n3 with a loading intensity
p(y) which integrates to P/4, where P is the total load on the cap.
Geometric compatibility
Fig. 5 shows the cap boundaries n1-n2, n2-n3, n3-n4 and n0’-n4deflect to dashed lines under the
action of p(y), with constant displacement along n2-n3 denoted as δ2=δ3=δ. Deflection at n4 is
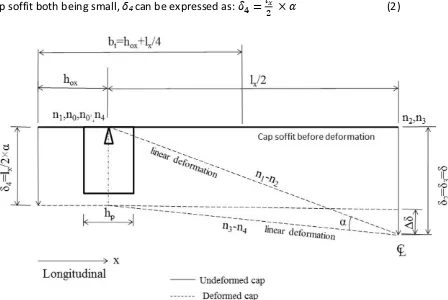
denoted as δ4 and n1-n0-n0’ considered rigid as discussed earlier. Fig. 8 defines the angle 𝛼
between the deformed n1-n2 and n3-n4. Due to α and angle between n1-n2 and the undeformed
cap soffit both being small, δ4can be expressed as: 𝛿4 =𝑙𝑥
[image:11.612.84.532.369.669.2]2 × 𝛼 (2)
11
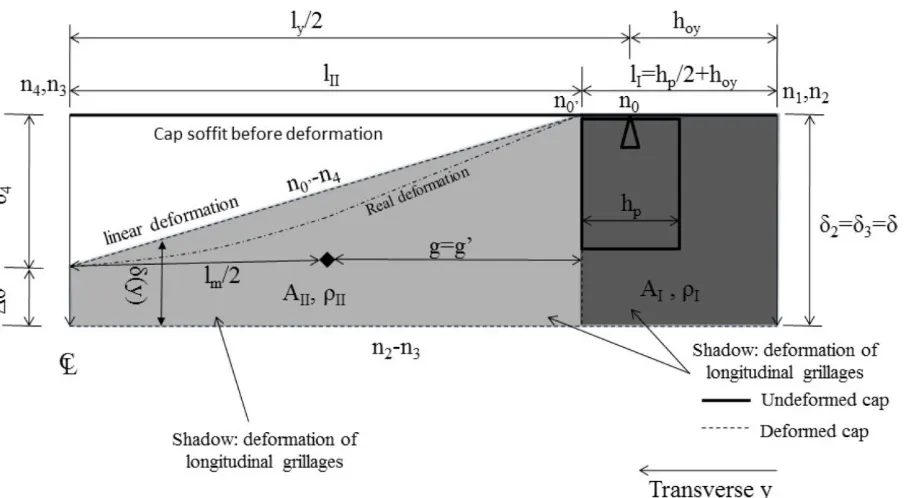
The relative deflection between n3 and n4is Δδ (also in Figs. 5). Figs 9 and 10 show the soffit
deflection seen from the side surface for two cases: δ4>δ (generally true for large μ with small n),
and δ4≤δ (for small μ). The shaded area enclosed by deformed n2-n3, deformed n0’-n4 and
undeformed rigid n1-n0-n0’represents the relative deflection of the LD elements. For larger μ, δ4
tends to be larger than δ, and the corresponding deformed n0’-n4 is shown in Fig. 9. This situation is impractical since it implies upward curvature in simply supported LD elements under
downward external loading. The study shows that it is logical to set Δδ=0 (i.e. δ4 =δ), where deformed n0’-n4and n2-n3 encloses a triangle, i.e. 𝛥𝛿 = 0 for 𝛿4 > 𝛿. (3)
Considering Eq. 2, we also have: 𝛥𝛿 = 𝛿 − 𝛿4 = 𝛿 −𝑙𝑥
2 × 𝛼 for 𝛿4 ≤ 𝛿 (4)
The shaded area in Figs. 9 and 10 can be divided into area AI over lI and area AII over lII, where:
𝑙𝐼 =ℎ𝑝
2 + ℎ𝑜𝑦 (5)
𝑙𝐼𝐼 =
𝑙𝑦 2 −
ℎ𝑝
2 (6)
𝐴𝐼 = 𝑙𝐼× 𝛿 = (
ℎ𝑝
2 + ℎ𝑜𝑦) × 𝛿 (7)
Employing a deflection function δ(y) over axis y, 𝐴𝐼𝐼 = ∫ 𝛿(𝑦)𝑑𝑦𝑙
𝐼𝐼 (8)
Where dy is the infinitesimal width of LD elements (Fig.7).
If 𝛿4 > 𝛿, considering Eqs. 3 and 6 and integrating Eq. 8, 𝐴𝐼𝐼 =
𝛿 2𝑙𝐼𝐼 =
𝛿 2(
𝑙𝑦 2 −
ℎ𝑝
2) (9)
The centroidal distance to pile inner edge (Fig. 9), 𝑔 =𝑙𝐼𝐼 3 =
𝑙𝑦 2−
ℎ𝑝 2
3 (10)
If 𝛿4 ≤ 𝛿, considering Eqs. 4 and 6, 𝐴𝐼𝐼 = 𝛿+𝛥𝛿
2 𝑙𝐼𝐼 =
4𝛿−𝑙𝑥𝛼 4 (
𝑙𝑦 2 −
ℎ𝑝
2) (11)
The centroidal distance to pile inner edge (Fig. 10), 𝑔 =
𝛿×𝑙𝐼𝐼2 2 −
𝛿4×𝑙𝐼𝐼2 3 𝐴𝐼𝐼 =
6𝛿−2𝑙𝑥𝛼 12𝛿−3𝑙𝑥𝛼(
𝑙𝑦 2 −
12
Fig. 9. Grillage deflection projected to cap side surface (δ4 > δ)
[image:13.612.84.536.375.624.2]13
Development of constitutive relationship for one-way RC deep beams
A linear constitutive load-deflection relationship for the grillage elements is developed to solve
the model efficiently. Evidence has it (Cao 2009) that shear resistance of RC deep beams is
contributed from both flexural and ST behaviour, with the latter dominating at shear failure. Kani
(1964) shows for three-point loaded (3PL) beams, a transition in strain distribution over the beam
height along shear cracks from triangular (signifying bending) to uniform at ST failure. A
procedure (CIRIA 1977) for predicting deflection of deep beams with lx/h < 2.0 under 3PL assumes
the deflection arises from reinforcement strain due to bending prior to cracking and a vertical
component of concrete strut shortening δs (Fig. 6), plus downward movement of strut tips
rotating to the geometric compatibility with reinforcement elongation.
Based on kinematic behaviour of RC deep beams observed in shear tests, Mihaylov et al. (2013,
2015) derived full load-deflection curves from four shear mechanisms (namely in critical loading
zone, cracks interlock, stirrup, dowel action) and one flexural mechanism (‘fan’ shape rigid beam
under the critical shear crack).
In light of these studies, a linear constitutive relationship is established by considering the
summation of both bending and ST mechanisms acting in series, under the same external load P.
For example, Fig. 6 is the 3PL scenario for UoS pile caps B4A1-B4A5 and B4B1 – close to one-way
structures with small ly. Total deflection δtotal = δb + δst under external loading P, where δb is
Bernoulli beam theory based deflection. δst is the resultant of strut shortening δs and a
14
𝛿𝑡𝑜𝑡𝑎𝑙 = ( 𝑙𝑏3 48×𝐸𝑐×𝐼𝑒𝑓+
εo′h 2 sin 𝜃2tan 𝜃×
1
𝐴𝑠𝑡𝑓𝑦)𝑃 (13)
The derivation of the second term of Eq. (13) is presented in Appendix 1.
The deflection at ST failure is derived by replacing P with shear capacity P*, i.e.
𝑃∗ = 2𝐴𝑠𝑡𝑓𝑦tan 𝜃 (14)
Where ε0’ is the concrete cylinder strain at peak strength fc’, ranging from 0.002 to 0.0025 for 15 MPa ≤ fc’≤ 50 MPa (Waner et al. 1998; BSI 2010). ε0’ = 0.002 is adopted here (Table 2). Ec is
concrete Young’s modulus; lb is effective beam span (double the shear span measured from the
external loading positions); θ is strut angle; h is beam depth; Ast is area of LD reinforcement; fy is
reinforcement yield strength. Effective second moment of area for a deep beam, Ief is given by
15
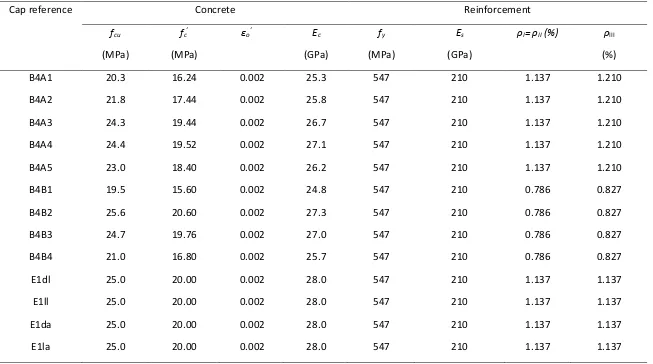
Table 2. Key material properties of pile cap samples at UoS (B4xx - experiment, E1xx parametrical study – only four extreme samples
listed)
Cap reference Concrete Reinforcement
fcu
(MPa)
fc’
(MPa)
εo’ Ec
(GPa)
fy
(MPa)
Es
(GPa)
ρI= ρII (%) ρIII
(%)
B4A1 20.3 16.24 0.002 25.3 547 210 1.137 1.210
B4A2 21.8 17.44 0.002 25.8 547 210 1.137 1.210
B4A3 24.3 19.44 0.002 26.7 547 210 1.137 1.210
B4A4 24.4 19.52 0.002 27.1 547 210 1.137 1.210
B4A5 23.0 18.40 0.002 26.2 547 210 1.137 1.210
B4B1 19.5 15.60 0.002 24.8 547 210 0.786 0.827
B4B2 25.6 20.60 0.002 27.3 547 210 0.786 0.827
B4B3 24.7 19.76 0.002 27.0 547 210 0.786 0.827
B4B4 21.0 16.80 0.002 25.7 547 210 0.786 0.827
E1dl 25.0 20.00 0.002 28.0 547 210 1.137 1.137
E1ll 25.0 20.00 0.002 28.0 547 210 1.137 1.137
E1da 25.0 20.00 0.002 28.0 547 210 1.137 1.137
16
Where 𝑌(𝜌, 𝑑) = (0.02 + 0.025𝜌)𝑑3 when 𝜌 ≥ 0.005 and 𝑌(𝜌, 𝑑) = (0.1 − 0.135𝜌)𝑑3 ≥
0.06𝑑3 when 𝜌 < 0.005, and B is the beam width.
For four-point loading (4PL), e.g. for the TD element between piles shown in Fig. 7 with two
pointed loads PtAII distanced at spacing lm, δtotal = δb + δst +δsm, where δsm is the deflection of the
intermediate beam segment lm subject to uniform bending moment only. Thus:
𝛿𝑡𝑜𝑡𝑎𝑙 = ( 𝑙𝑏3 48×𝐸𝑐×𝐼𝑒𝑓+
εo′h 2 sin 𝜃2tan 𝜃×
1 𝐴𝑠𝑡𝑓𝑦+
𝑙𝑏𝑙𝑚2
32×𝐸𝑐×𝐼𝑐𝑟)𝑃 (16)
Where Icr is the beam cracked second moment of area.
Validation of the proposed constitutive relationship
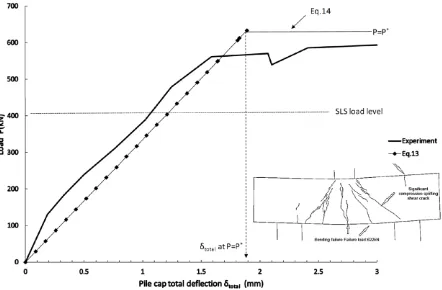
A comparison between Eqs. (13) and (14) with experiment is shown in Fig. 11 for UoS cap B4A3,
which gives good match for stiffness, kink point and ultimate load.
Combined with UoS tests, deflections at SLS load level round 70% of P* (Fig. 11) in a series of
international tests (Rao et al. 2007; Kotsovos 1987; Yang and Jun 2003; De Paiva and Austin 1960)
on caps under a mixture of 3PL, 4PL and uniformly distributed load (equivalent to 4PL) were
compared with Eqs.(13) and (16). The comparison (Fig. 12) shows good match between measured
17
Fig. 11 Load-deflection relationship for 3PL UoS pile cap B4A3 (n=4.23, µ=2.31)
Application of constitutive relationship to LD grillage elements
As LD grillage elements (Figs. 5 and 6) are subject to 3PL, Eq. (13) applies. Taking the shear span
between lines at 20% of pile diameter from the inner edge (BSI 1990):
𝑙𝑏= 𝑙𝑏𝑥 = 𝑙𝑥− 2 × 0.3 × ℎ𝑝−ℎ𝑐
2 (17)
Taking the shear span as lb rather than the pile centre span lx in Eq. (17) compensates for the reality that there will be some hogging moment restraint to the cap from the piles to the cap so
that the imagined grillage elements are not truly simply supported. An elastic frame analysis (Cao
2009) showed that reducing the shear span in this way was in close agreement with Eq. (17). It
was also observed in UoS experiments that although hogging vertical cracks above the piles
18
during maturing of the ST mechanism in the failure stage (Cao 2009). Therefore, this
simplification to simply supported conditions but with reduced shear span lb is thought to be sufficiently accurate for practical pile caps.
Fig.12 Comparison between Eqs. 13 and 16 predictions and measured deflections at SLS load
for all samples in the study
Concrete strut angle for LD elements is: 𝜃𝑥 = tan−1 ℎ 𝑙𝑥 2
(18)
An LD element of width dy is subjected to external loading (Fig. 5) 𝑃 = 2𝑝(𝑦)𝑑𝑦 (19)
From Eq.(13), define f(ρI) and f(ρII) as LD element flexibility over the lengths lI and lII, respectively:
𝑓(ρI) = 𝑙𝑏𝑥3
48×𝐸𝑐×𝑌(𝜌𝐼,𝑑𝑥)+
εo′h 2 sin𝜃𝑥2tan 𝜃𝑥×
1
𝜌𝐼𝑑𝑥𝑓𝑦 (20)
𝑓(ρII) = 𝑙𝑏𝑥3
48×𝐸𝑐×𝑌(𝜌𝐼𝐼,𝑑𝑥)+
εo′h 2 sin𝜃𝑥2tan 𝜃𝑥×
1
𝜌𝐼𝐼𝑑𝑥𝑓𝑦 (21)
19
From Figs. 9~10, δtotal for LD elements over width lI is equal to δ(y)=δ and over width lII is equal
to δ(y). Substituting Eqs. (19)-(21) into Eq. (13) and integrating along y:
Over lI: ∫ 𝛿(𝑦)𝑑𝑦𝑙
𝐼 = 𝐴𝐼 = ∫ 𝑓(𝜌𝑙𝐼 𝐼)2𝑝(𝑦)𝑑𝑦 = 2𝑓(𝜌𝐼) ∫ 𝑝(𝑦)𝑑𝑦𝑙𝐼 = 2𝑓(𝜌𝐼)P𝑙𝐴𝐼 (22)
Over lII:∫ 𝛿(𝑦)𝑑𝑦𝑙
𝐼𝐼 = 𝐴𝐼𝐼 = ∫ 𝑓(𝜌𝑙𝐼𝐼 𝐼𝐼)2𝑝(𝑦)𝑑𝑦 = 2𝑓(𝜌𝐼𝐼) ∫ 𝑝(𝑦)𝑑𝑦𝑙𝐼𝐼 = 2𝑓(𝜌𝐼𝐼)P𝑙𝐴𝐼𝐼 (23)
Where 𝑃𝑙𝐴𝐼 and 𝑃𝑙𝐴𝐼𝐼 are the resultant external loading applied to the LD elements on the
quarter cap over the lengths lI and lII respectively (Fig. 5).
Application of Constitutive relationship for TD grillage elements
For the TD element, Eq. (16) applies, in which lm (Fig. 7) is the intermediate beam length between
resultant loads PtAII transferred from LD elements. Effective span lb = lby for n0’-n4, twice the
distance g’ measured from the inner edge of the pile to each PtAII.
Eqs. (22) and (23) imply that the enclosed shapes of p(y) and the deflection δ(y) have the same
horizontal length but with vertical heights similar by scale factors 2f(ρI) and 2f(ρII). For example,
the trapezoidal area enclosed by dashed lines in Fig. 7 has the same length lII as area AII in Fig. 10
but height p(y) scaled by 2f(ρII) from δ(y) in Fig.10, i.e. 𝑝(𝑦) = 𝛿(𝑦)
2𝑓(𝜌𝐼𝐼). Therefore, distances to
centroids g’=g (with g from Eqs. (11) and (12)). Thereby, 𝑙𝑏𝑦 = 2𝑔′ = 2𝑔 (24)
Substituting into Eq. (16) with lb = lby, lm = ly - hp - 2g, b = bt, d = dy, θ = θy, ρ = ρIII, δtotal = δ4 and
P=2PtAII, defines the TD element flexibility f(ρIII) as:
𝑓(𝜌𝐼𝐼𝐼) = 𝑙𝑏𝑦3
48×𝐸𝑐×𝑌(𝜌𝐼𝐼𝐼,𝑑𝑦)𝑏𝑡+
𝜀𝑜′ℎ
2 𝑠𝑖𝑛𝜃𝑦2𝑡𝑎𝑛 𝜃𝑦× 1 𝜌𝐼𝐼𝐼𝑑𝑦𝑏𝑡𝑓𝑦+
𝑙𝑏(𝑙𝑦−ℎ𝑝−2𝑔)2
32×𝐸𝑐×𝑌(𝜌𝐼𝐼𝐼,𝑑𝑦)𝑏𝑡 (25)
20
Force equilibrium
The external forces 𝑃𝑙𝐴𝐼 and 𝑃𝑙𝐴𝐼𝐼 applied to LD elements (Fig.5) are balanced by the reactions at
the connection to the TD element, 𝑃𝑡𝐴𝐼 and 𝑃𝑡𝐴𝐼𝐼(Fig.7), which cause deflection in the TD
element. Considering a quarter cap: 𝑃𝑙𝐴𝐼+ 𝑃𝑙𝐴𝐼𝐼 = 𝑃𝑡𝐴𝐼+ 𝑃𝑡𝐴𝐼𝐼 = 𝑃
4 (27)
Failure criteria
Failure is observed by ST failure in LD elements over transverse width lI above the piles (Fig. 2).
Figs. 9-10 indicate that cap deflection δ along lI is always higher than δ(y) along lII in the model,
ensuring shear failure along lI prior to lII. It is also reflected in the grillage layout (Fig. 5) that once
the front LD element fails, it is no longer capable of supporting the TD element over n0’, leading
immediately to overall structural failure. The corresponding deflection δ of the front LD element
at failure can be obtained from Eqs. (13), (19) and (20) by replacing the general load intensity p(y)
with the load intensity at failure p(y)*: 𝛿 = 𝑓(𝜌
𝐼)2𝑝(𝑦)∗ (28)
Considering the force balance with the tie reinforcement in the ST model,𝑝(𝑦)∗× 𝑑𝑦 =
𝑡𝑎𝑛 𝜃𝑥𝜌𝐼𝑑𝑥𝑓𝑦𝑑𝑦 . Therefore, 𝑝(𝑦)∗ = 𝑡𝑎𝑛 𝜃𝑥𝜌𝐼𝑑𝑥𝑓𝑦 (29)
Shear capacity
Rearranging Eq. (23) gives: 𝐴𝐼𝐼
2𝑓(𝜌𝐼𝐼)= ∫ 𝑝(𝑦)𝑑𝑦 = 𝑃𝑙𝐼𝐼 𝑙𝐴𝐼𝐼 (30)
AII is derived from Eqs. (9) or (11), in which 𝛿 can be obtained from Eq. (28). PlAII (= PtAII = 𝛿4 2𝑓(𝜌𝐼𝐼𝐼))
21
deformed n1-n2 and n3-n4 (Fig. 8). As Eq. (30) contains a complex nonlinear function of α, a
numerical solution is proposed. Re-organizing Eq. (30), function f(α) is defined as:
𝑓(𝛼) = 𝐴𝐼𝐼
2𝑓(𝜌𝐼𝐼)− 𝛿4
2𝑓(𝜌𝐼𝐼𝐼) (31)
Following the procedure below, the solution for α is sought when f(α)=0:
1. Assume that δ4 ≤ δ and substitute Eqs. (2), (11), (21)-(25) into Eq. (31) Trial values of α in
increments between 0.00001~0.0001 radians, from which the α-f(α) curve is obtained.
2. The solution for α is obtained and the procedure stops when either:
(i) Two consecutive values of f(α) have opposite sign, when 𝛼 < 𝑙𝑥𝛿
2
(i.e. 𝛿4 < 𝛿 as per Eq. 2), so
obtain α for f(α)=0 by linear interpolation between the two neighboring points.
(ii) If 𝛼 = 𝑙𝑥𝛿
2
is reached prior to two consecutive f(α) values changing sign, the solution is 𝛼 = 𝑙𝑥𝛿
2
(i.e. δ4 =δ). This normally only occurs for caps with particularly large µ and small n.
Fig. 13 shows a worked example for cap B4B4. Procedure 2(i) applies for this case, with 𝛼 =
0.00108 for δ4 < δ obtained. Having α, AII is obtained from Eq. (11). Then derive 𝑃𝑙𝐴𝐼 and 𝑃𝑙𝐴𝐼𝐼
from Eqs. (22) and (23). Denoting P=P* as the external force at shear failure, i.e. the cap shear capacity, the expression for cap shear capacity, by transforming Eq. (27) becomes:
𝑃∗ = 4( 𝐴𝐼𝐼
2𝑓(𝜌𝐼𝐼)+ 𝐴𝐼
22
Fig. 13 α-f(α) curve and solution for for cap B4B4 (n=5.00, μ=5.38)
Reinforcement stress and cap soffit deflection
Reinforcement stress is obtained using the same philosophy, namely by linear superposition of
the stresses from bending and ST mechanisms, but capped by the maximum achievable fy. Soffit deflection at any location δ(x,y) is calculated by bi-linear interpolation between δ4, Δδ and δ
obtained previously (Figs. 5 and 8).
VBA Userform based design software S4PWv1.0
The above procedure has been written into a VBA Userform based design software S4PWv1.0 of
[image:23.612.89.535.81.384.2]23
material properties. Running within 5 seconds for each case, the programme provides cap shear
[image:24.612.73.537.133.567.2]capacity, full field cap deflection and TD/LD reinforcement stress distribution (over a ¼ cap).
Fig. 14 VBA Userform based design software S4PWv1.0 for solving grillage model for bridge RC
four-pile cap under wall loading
Comparison for shear capacity
The shear capacity predicted from Eq. (32) (calculated by S4PWv1.0) is compared with UoS
24
(refer Tables 1- 2). Fig. 15 shows the predictions match well with both the experimental results
and numerical modeling. Due to the innate variability of experimental data, Eq. (32) shows higher
accuracy and less scatter against NNM samples (R2=0.9827) than against experimental samples (R2=0.8597). Cap B4A5 failed by crushing of the piles, both in the experiment and NNM simulation, and B4A2 partially failed in the experiment towards the cap back surface (Cao 2009; Cao and
Bloodworth 2012). The shear capacity of these two caps should have been higher, meaning Eq.
(32) would perform even better. Excluding these two caps, the cumulative distribution function
of the prediction error is shown in Fig. 15. The probability of exceedance of Eq. (32) compared to
[image:25.612.80.538.346.648.2]the experiment and NNM is 96% and 78% respectively, showing conservatism level of Eq. (32).
25
Fig.16 shows the comparison for shear capacity between Eq. (32) and NNM for all 88 parametric
cap samples, from which good match is seen. Eq. (32) slightly underestimates the capacity, albeit
high R2=0.9684. The circled cases deviating from the group are individual caps with impractical dimensions of extreme large ly. The shear capacity from NNM for experiment samples is also
included which, if combined with parametric samples excluding impractical dimensions, makes
[image:26.612.79.503.259.539.2]Eq. (32) more faithful to NNM with R2=0.9874. The probability of exceedance of Eq. (32) is 42%.
Fig. 16 Comparison for shear capacity between S4PWv1.0 and NNM of all parametric studies
combined and experimental samples by FEA
Comparison for reinforcement stress
Comparison of LD reinforcement stress for cap B4B3 at shear failure from NNM and S4PWv1.0 is
shown in Figs. 3 and 17. Both figures show the yield strength fy=547MPa is mobilized on the whole
26
LD reinforcement stress along A-A section in Figs. 3 and 17 between NNM and S4PWv1.0, both
capturing the LD stress gradient along the TD centreline. NNM predicts 300MPa stress at x=hox
and 547MPa at midspan, while variation from 470MPa to 547MPa is estimated by S4PWv1.0.
Reinforcement stress is also compared for the 88 parametric study numerical samples. For
example, Fig. 19 shows comparison for full field LD reinforcement stress distributions between
NNM and S4PWv1.0 on ¼ cap E1dl, where similar distributions can be seen. The stress along A-A
is compared in Fig. 20. fy=547MPa is reached in both methods, with the plateau in each extending
to 330mm from the cap front surface (y=0mm), followed by stress degradation of similar
[image:27.612.77.487.337.652.2]magnitude towards the cap centre.
Fig. 17 Full field LD reinforcement stress (MPa) at shear failure predicted from S4PWv1.0 (¼ cap
27
Fig. 18 Comparison between NNM and S4PWv1.0 for LD reinforcement stress along A-A in Figs.
3 and 17 at shear failure (cap B4B3 n=5.00, μ=4.23)
Fig. 19 Full field LD reinforcement stress (MPa) at shear failure (¼ cap E1dl n=2.31 µ=9.23) (left)
[image:28.612.77.516.441.650.2]28
Fig. 20 Comparison of LD reinforcement stress along A-A in Fig. 19 between NNM and
S4PWv1.0 (cap E1dl n=2.31 µ=9.23)
Fig. 21 shows comparison of full field TD reinforcement stress distributions between NNM and
S4PWv1.0 on ¼ cap E1ej. Stress is concentrated over width bt=hox+lx/4 (Eq. 1) from both methods.
Stress along A-A over the pile head is shown in Fig. 22. The stress value from S4PWv1.0 stops at
the pile inner edge, from which the shear span starts in the model, whilst the NNM gives a full
width distribution. S4PWv1.0 predicts the stress fy=547MPa in the span centre. Although NNM
stress reduces slightly from the pile head towards the span centre, the difference from S4PWv1.0
29
Fig. 21 Full field TD reinforcement stress (MPa) at shear failure (¼ cap E1ej n=2.69 µ=6.15 (left)
NNM (right) S4PWv1.0
In Figs. 18, 20 and 22, the significant contribution of reinforcement stress from both bending and
ST mechanisms is manifest. This justifies the important assumption made for the constitutive
relationship of one-way RC deep beams in Eq. (13) and Eq. (16) that both mechanisms coexist in
the shear behaviour.
Evaluation of the proposed method - accuracy, efficiency and versatility
For shear capacity for 2-way RC four-pile caps under wall loading, international standards provide
three design methods, namely (i) Punching shear design method (BSI 2010; ACI 2014); (ii) Shear
enhancement width method (BSI 1990, 1997, 2010) and (iii) 3-D STM assisted by elastic numerical
modelling or NNM (BSI 2010; AASHTO, 2012; ACI, 2014). Method (ii) (BSI 1997) using 2-D STM,
with tie width maximum three times pile diameter centred over piles, is compared with the NNM
30
STM underestimates the shear capacity, especially for the circled cases with large LD pile spacing
where the actual width of LD yielding tie in ST mechanism (refer Fig. 3) is larger than 3hp. Considering the good match between S4PWv1.0 and NNM shown in Fig. 16, the proposed
[image:31.612.77.527.234.527.2]method is more accurate than the existing design method.
Fig. 22 Comparison of TD reinforcement stress along A-A in Fig.21 from NNM and S4PWv1.0
31
Fig. 23 Comparison for the parametric study and UoS experiments between NNM and BS 8110
(Method (ii) with 2-D STM)
Method (iii) utilizes lower bound plastic theory based 3-D STM. For caps under concentrated
loading, the maximum load capacity solution - the pyramidal topology of the compressive struts,
nodal and tension zones can be easily visualized (e.g. Mathern et al., 2017). However, for caps
under wall loading, the load path topology will be fan-shaped spreading to the piles, which is
difficult to visualize. Engineers may search for the optimal topology or obtain the shear capacity
directly from elastic or NNM in various commercial software, where a recent development
involves employing evolutionary structural optimization to identify the critical load path (Leu et
al., 2006; Hardjasaputra, 2015). However, the accuracy from such models is not justifiable
because of the paucity of published data to enable rigorous verification, and the limited bank of
32
NNM procedure using research-oriented software and verified carefully against test data was
demonstrated in Cao (2009), it was resource intensive requiring 12 hours computational time per
cap case.S4PWv1.0 achieves the balance between accuracy and time efficiency by establishing a
fast design solution (in matter of seconds) of a model backed by test observation and verified by
NNM. In representing the true structural shear behaviour, naturally both reinforcement stress
and cap deformation can be obtained by the method, which is another advantage over existing
empirical design tools.
For versatility of the proposed method and software, a straightforward extension of the
application of the model and S4PWv1.0 (Fig. 14) is to solve the shear capacity for two-row
multi-pile foundations under a bridge pier wall subjected to uniform vertical traffic loading transferred
through guided pot bearings (Fig. 24). Along TD, the foundation can be divided into two end caps
and series of internal caps assigned with cap length lI and lII. The total shear capacity is the
summation of the shear capacity for each individual cap, which can be solved by S4PWv1.0
directly (e.g. see 𝐴𝐼
2𝑓(𝜌𝐼), 𝐴𝐼𝐼
2𝑓(𝜌𝐼𝐼) in Eq. (32)).
With minor adaptation, S4PWv1.0 can also be extended to the caps with different orthogonal
reinforcement ratio (i.e. ρI, ρII in LD and ρIII in TD, which are independent in the solution, refer
Figures 9 and 6) and to predict reinforcement stress and cap deformation at any loading stage P
33
Fig. 24 Two-row multi-pile foundation under pier wall for mining wagon train carrying bridges in
Western Australia
The proposed grillage model provides researchers with a pathway for developing solutions and
practical software for RC D-region structures in general under any geometry and loading
configurations, provided the following criteria are satisfied, as this study has demonstrated: (i)
The structure’s spatial deformation under external loading can be decomposed into 1-way RC
deep beams aligned with the direction of their main reinforcement; (ii). Boundary conditions
including external loading displacement are quantifiable so that geometry compatibility can be
established; (iii) Failure criterion for the decomposed 1-way RC deep beams related to their width
is quantifiable. Either tests or advanced NNM would be needed for the proposed configuration
to confirm these criteria and the final solution will be individual case based, but the pathway
34
An illustrative example, which meets the three criteria above, is the four-pile cap under wall
loading subject to an asymmetrically applied line load P along TD (lbx1>lbx2) and to the distributed biaxial moments Mx and My (Figs. 25-26). In LD (Fig. 25), δb and δst is calculated in similar way to
Eq. 13 but with the following extra consideration:
1. δbcalculated according to the asymmetric location for P.
2. δst shortened by compression force P1’ or P2’, both of which is derived on the assumption
that the cap is simply supported. Therefore, e.g. P’
2=P(lbx1+0.25hc+ 0.3hp)/lx+My/lx.
3. The deformed angle α1 and α2 (refer α in Fig. 8) is obtained separately for the left and
[image:35.612.85.494.342.647.2]right half cap.
Fig. 25. Grillage elements and externally applied force seen from cap front surface for
35
Fig. 26. Grillage elements and forces to TD elements seen from cap side surface for combined
biaxial moments and wall loading
In TD (Fig. 26), the level deformed cap along n2-n3 in Figs. 9-10 is now with a slope β due to the
introduction of Mx. Assuming linear deformation, cap deflection δ2 in the front and back cap
surface is δ and δ-Bβ, respectively, where B is the cap TD length. The failure criterion is then for
reinforcement tie at cap front surface to yield at fy, i.e. when 𝑝(𝑦)∗ = 𝑡𝑎𝑛𝜃x2𝜌𝐼𝑑𝑥𝑓𝑦 or
δ=𝑓(𝜌𝐼)𝑡𝑎𝑛𝜃x2𝜌𝐼𝑑𝑥𝑓𝑦 is reached (refer Eqs. 28-29). To obtain the solution, the additional unknown β can
be solved by the condition that δ4 equals for both front and back half caps, bounded at
36
For wall loading with intermediate length, the grillage model may apply allowing certain
neglection of non-orthogonal cap deformation. For a cap under wall loading in length of a(<B/2)
in Fig. 27, where the cap deformation radiating from node n3’ is not aligning with main
orthogonal reinforcement, the grillage model may be implemented by introducing an additional
discrete element n4”-n3” with width of (B/2-a) in LD only. The element deforms under a force Q
at midway transferred from node n3’. Solution can then be obtained in similar way, by
establishing force balance, geometric compatibility and constitutive relationship together with
the failure criterion observed from test and/or NNM.
37
Conclusions
Based on test observations of real shear behavior of pile caps, this paper develops an efficient
tool for general daily design application, through solving a two-way statically determinate grillage
model. A well verified linear load-deflection relationship for one-way RC deep beams is adopted
as the constitutive relationship for the grillage elements. A VBA Userform based design software
has been developed, enabling designers to obtain within seconds for each cap, the shear capacity,
full field distribution of reinforcement stress and cap deflection at any design loading including
the failure load. Therefore, the new method is more accurate and time efficient than the existing
design tools. The proposed method has been verified for four-pile caps under wall loading but
also innovates a pathway that is versatile for analyzing a wide range of two-way RC deep
structural elements under various loading conditions, for which no previous international study
has been performed.
Notation
The following symbols are used in this paper:
AII= area of δ(y) under length lII;
AI= area of δ(y) under length lI;
Ast=reinforcement area;
B=cap width or deep beam width;
bt=width of transverse grillage elements n1-n0-n0’ and n0’-n4;
d= pile cap or deep beam effective depth;
38
dy=effective pile cap depth in TD;
dy=infinitesimal width of LD elements;
Ec=short term nominal concrete Young’s modulus;
Es=reinforcement Young’s modulus;
fc’=concrete compressive cylinder strength;
fy=reinforcement yield strength;
g=distance of centroid of area AII from the inside face of piles;
g’= centroid distance of distributed wall loading p(y) acting on length lII from pile inside face;
h= total pile cap or deep beam depth;
hc=width of wall loading;
hp= Pile diameter or width of beam support steel plate;
hox=cap overhang in LD;
hoy=cap overhang in TD;
L=pile cap length;
lb=deep beam or pile cap effective span; lbx =cap effective span in LD;
lby=cap effective span in TD;
Icr= Second moment of area of cracked beam cross-section;
lI= transverse width between outside face of cap and inside face of piles;
lII =transverse width between inside face of piles and cap transverse centerline (when δ4<=δ);
lm=intermediate beam segment under uniform bending moment under 4PL;
39
ly=pile spacing in TD;
Ief= equivalent second moment of area of pile cap or deep beam cross-section;
n=lx/hplongitudinal pile spacing to pile diameter ratio;
p(y), p(y)* =general wall loading intensity and intensity at shear failure on ¼cap, respectively;
P, P*=total external wall load and load at shear failure on pile caps or deep beams, respectively;
PlAI, PlAII=resultant force acting on LD elements in ¼ cap over widths lI and lII respectively;
PtAI, PtAII=resultant force acting on TD elements in ¼ cap over widths lI and lII respectively;
f(ρI), f(ρII)=flexibility of longitudinal grillage elements per unit width under lI and lII respectively;
f(ρIII)=flexibility of transverse grillage elements;
α= deformed angle of the grillage/cap soffit along TD projected onto cap front surface;
Δδ=relative deflection between n4 and n3;
δ4=deflection of grillage element n0’-n4at n4;
δ=constant deflection of cap under wall loading along grillage element n2-n3;
δ(y)=midspan deflection of LD elements as a function of transverse distance y;
ε0’=concrete compressive strain at peak compressive stress;
θx=concrete strut angle in LD relative to horizontal;
θy=concrete strut angle in TD relative to horizontal;
μ=ly/hp transverse pile spacing to pile diameter ratio;
40
Appendix 1
The second term of Eq. (13) measures the flexibility by ST mechanism of a one-way RC deep beam
under 3PL. (CIRIA 1977) assumes that ST vertical deflection δst is a component of strut shortening
δs, i.e. δst,CIRIA= δssinθx (Fig.6). This paper takes a different approach that δst is a resultant of strut
shortening δs plus a displacement due rotation of the strut around its lower end (Fig.6), i.e
𝛿𝑠𝑡= 𝛿𝑠
𝑠𝑖𝑛 𝜃𝑥 (33)
The shortening of the concrete struts 𝛿𝑠 = 𝑙𝑠𝑡× 𝜀𝑐 (34)
Where 𝑙𝑠𝑡= ℎ
𝑠𝑖𝑛𝜃𝑥 , the length of the concrete strut and 𝜀𝑐 is the compressive strain in the strut.
Substitute Eq. (34) into Eq.(33), 𝛿𝑠𝑡 = ℎ𝜀𝑐
𝑠𝑖𝑛𝜃𝑥2 (35)
Now considering an internationally adopted nonlinear parabolic concrete compressive
stress-strain relationship (BSI 2010; ACI 2011; Standards Australia 2009; Hognested 1951; Waner,
Rangan, Hall and Faulkes 1998) , i.e.:𝑓𝑐 = 𝑓𝑐′[2 (𝜀𝑐
𝜀𝑜′) − (
𝜀𝑐 𝜀𝑜′)
2
] (36)
Where fc’ (<50MPa) is the concrete cylinder strength. εo’ is the strain (=0.002) when fc’ is reached.
Rearranging Eq. (36), 𝜀𝑐 = (1 − √1 −𝑓𝑐 𝑓𝑐′)𝜀𝑜
′ (37)
Substituting Eq.(37) into Eq. (35), 𝛿𝑠𝑡 =
ℎ(1−√1−𝑓𝑐 𝑓𝑐′)𝜀𝑜
′
𝑠𝑖𝑛𝜃𝑥2 (38)
From ST force equilibrium against yielding reinforcement, the force in the compressive strut
when strut-and-tie fails, 𝑃′= 𝐴𝑠𝑡𝑓𝑦
𝑐𝑜𝑠 𝜃𝑥 (39)
41
Now assume the concrete strut is in a prism with constant width of dst (Fig. 6) which stays
invariant in any loading stage. Denoting strut width as B, dst is derived from Eq. (39),
𝑑𝑠𝑡 = 𝑃′
𝑓𝑐′×𝐵=
𝐴𝑠𝑡𝑓𝑦
𝑓𝑐′×𝐵×𝑐𝑜𝑠 𝜃𝑥 (40)
On the other hand, load allocated to each concrete strut in any loading stage P (Fig.6) is 2𝑠𝑖𝑛 𝜃𝑃
𝑥.
The corresponding compressive stress in concrete strut 𝑓𝑐 = 𝑃
2 sin 𝜃𝑥×𝑑𝑠𝑡×𝐵 (41)
Substitute Eq.(40) into Eq.(41), 𝑓𝑐 = 𝑃
2 𝑠𝑖𝑛 𝜃𝑥× 𝐴𝑠𝑡𝑓𝑦 𝑓𝑐′ ×𝐵×𝑐𝑜𝑠 𝜃𝑥×𝐵
= 𝑃𝑓𝑐′
2 𝑡𝑎𝑛 𝜃𝑥×𝐴𝑠𝑡𝑓𝑦 (42)
Substitute Eq. (42) into Eq. (38), 𝛿𝑠𝑡 =
𝜀𝑜′ℎ(2−√4−𝐴𝑠𝑡𝑓𝑦 𝑡𝑎𝑛 𝜃𝑥2𝑃 )
2𝑠𝑖𝑛 𝜃𝑥2 (43)
Eq.(43) gives a constitutive P-δst load-deflection relationship, considering an ideal compressive
stress-strain curve given by Eq.(36). However, to solve the grillage model more efficiently, this
study showed practically that a linear P-δst relationship was deemed to be warranted.
Now downgrade parabolic Eq.(37) to a linear format, i.e. compressive strain εc in the concrete
strut in any loading stage is directly proportional to compressive stress fc, 𝜀𝑐 = 𝜀𝑜′
𝑓𝑐′𝑓𝑐 (44)
Substituting Eq.(44) into Eq.(35), 𝛿𝑠𝑡 =
ℎ𝜀𝑜′ 𝑓𝑐′𝑓𝑐
𝑠𝑖𝑛𝜃𝑥2 (45)
Further replace fc in Eq.(45) with Eq.(42), 𝛿𝑠𝑡 =
𝜀𝑜′ℎ
2𝑠𝑖𝑛𝜃𝑥2𝑡𝑎𝑛 𝜃𝑥×𝐴𝑠𝑡𝑓𝑦𝑃 (46)
42
References
AASHTO (American Association of State Highway and Transportation Officials) (2012). "AASHTO
LRFD Bridge Design Specifications. " AASHTO, Washington, DC, U.S.A.
ACI (American Concrete Institute) (2011). “Building Code Requirements for Structural Concrete
and Commentary, ACI 318-11.” ACI: Farmington Hills, U.S.A.
ACI (American Concrete Institute) (2014). "ACI 318-14 Building Code Requirements for Structural
Concrete." ACI: Farmington Hills, Michigan, U.S.A.
Bloodworth, A.G., Cao, J. and Xu, M. (2012). “Numerical modeling of shear behavior of reinforced
concrete pile caps.” J. Structural Eng., 10.1061/(ASCE)ST.1943-541X.0000499.
BSI (British Standards Institution) (1990). "BS 5400-4 Steel, Concrete and Composite Bridges-Part
4: Code of Practice for Design of Concrete Bridges." BSI: Milton Keynes, UK.
BSI (British Standards Institution) (1997). "BS 8110-1 Structural Use of Concrete-Part 1: Code of
Practice for Design and Construction." BSI: Milton Keynes, UK.
BSI (British Standards Institution) (2004). “BS EN 1992-1-1: 2004 - Design of concrete structures
– Part 1-1: General rules and rules for buildings.” BSI: London, UK.
BSI (British Standards Institution) (2005). “BS EN 1992-2: 2005 - Design of concrete structures –
Part 2: Concrete bridges – Design and detailing rules.” BSI: London, UK.
BSI (British Standards Institution) (2010). “BS EN 1992-1-1:2004 - Eurocode 2: Design of concrete
structures - Part 1-1: General rules and rules for buildings.” BSI: London, UK.
Cao, J. (2009). “The shear behavior of the reinforced concrete four-pile caps.” PhD thesis,
43
Cao, J., and Bloodworth, A. G. (2012). “Shear behaviour of reinforced concrete pile caps under
full-width wall loading.” Proc. ICE Structures and Buildings, 165(4), 165–177.
CIRIA (Construction Industry Research and Information Association) (1977). CIRIA Guide 2 - The
design of deep beams in reinforced concrete beams. London, UK.
Clarke, J. L. (1973). “Behaviour and Design of Pile Caps with Four Piles, Technical Report.”
Wexham Springs: Cement and Concrete Association, 124-136.
De Paiva, H.A.R. and Austin, W.J. (1960). “Behaviour and design of deep structural members Part
3: Test of Reinforced concrete deep beams.” University of Illinois, Urbana, IL.
Hardjasaputra, H. (2015) “Evolutionary structural optimization as tool in finding strut-and-tie
models for designing reinforced concrete deep beam. The 5th International Conference of Euro
Asia Civil Engineering Forum (EACEF-5), Procedia Engineering 125 (2015) 995-1000.
Hognestad, E. (1951). “A study of combined bending and axial load in reinforced concrete
members.” University of Illinois, Eng. Expt. Station Bulletin, No. 399.
Kani, G. (1964). “The riddle of shear failure and its solution.” ACI Journal, 61(4), 441-467.
Kotsovos, M.D. (1987). “Shear failure of reinforced concrete beams.” Engineering Structures,
9(1), 32-38.
Leu, L.J., Huang, C. W., Chen, C.S., Liao, Y.P. (2006). “Strut-and-tie design methodology for
three-dimensional reinforced concrete structures.” J. of Structural Eng., ASCE, June, 929-938.
Mathern, A., Chantelot, G., Per Kettil, P.S., Bjorn Engstrom, R.R. (2017). “Enhanced strut-and-tie
model for reinforced concrete pile caps.” 39th IABSE Symposium – Engineering the future,
44
Mihaylov, B.I. (2015). “Five-spring model for complete shear behaviour of deep beams”
Structural Concrete, 16(1), 71-83.
Mihaylov, B.I., Bentz, E.C., Collins, M.P. (2013). “Two-Parameter Kinematic Theory for Shear
Behavior of Deep Beams” ACI Structural Journal, 110(3), May-June 2013.
Mihaylov, B.I., Hunt, B, Bentz, E.C., Collins, M.P. (2015). “Three-Parameter Kinematic Theory for
Shear Behavior of Continuous Deep Beams” ACI Structural Journal, 112(1), Jan.-Feb. 2015.
Rao, G.A., Kunal, K. and Eligehausen, R. (2007). “Shear Strength of Reinforced Concrete Deep
Beams.” Proc. 6th Int. Conf. Fracture Mechanics of Concrete and Concrete Structures
(FraMCoS-6), 693-699. Taylor and Francis.
Standards Australia. (2004). “AS 5100.5: 2004 - Bridge Design Part 5: Concrete.” Sydney:
Standards Australia.
Standards Australia. (2009). “AS 3600: 2009 Concrete structures.” Sydney: Standards Australia.
Waner, R.F., Rangan, B.V., Hall, A.S. and Faulkes, K.A. (1998). “Concrete Structures.” Longman.
Yang, C.-J. and Jun D.-H. (2003). “A study on the shear behaviour of deep beams under point