International Research Journal of Engineering and Technology
(IRJET)
e-ISSN: 2395-0056 Volume: 06 Issue: 04 | Apr 2019 www.irjet.net p-ISSN: 2395-0072© 2019, IRJET | Impact Factor value: 7.211 | ISO 9001:2008 Certified Journal | Page 1531
Optimization of Injection Molding Process Control Variables using
Taguchi Approach for a Thermoplastic Polymer Material
Vishnuprasad Pattali
1, Dr. Govindan P
2, Vipindas M P
31
M.Tech Student, Department of Mechanical Engineering, Government College of Engineering Kannur,
Kerala, India – 670563
2
Assistant Professor, Department of Mechanical Engineering, Government College of Engineering Kannur,
Kerala, India – 670563
3
Adhoc Faculty, Department of Mechanical Engineering, Government College of Engineering Kannur,
Kerala, India – 670563
---***---
Abstract: Polymer injection molding is a mass production technology for economic generation of components of varying geometry. One of the main challenges associated with the process is to minimize residual stress which directly affects quality and geometric accuracy of injection molded components. Therefore, it is important to select injection molding control variable settings for obtaining the minimum residual stress. Taguchi approach was used to investigate the effect of control variables on residual stresses and to optimize the process. Optimum injection molding variables for machining the polymer were obtained as time for filling 1.5 s, temperature of melt 180°C, temperature of mold 50°C, volume filled 100%, holding time at pressure 15 s, pressure for holding 60 MPa and coolant in temperature 20°C. Analyses of variances and analyses of means methods were used to see which variable has significant effect on the residual stress. The results indicate that pressure for holding, melt temperature and time for filling are the most significant injection molding variables affecting the enticement of residual stress. Regression equation was developed to model the residual stress as a function of the molding process control variables.
Keywords: Plastic injection molding, Residual stress analysis, Taguchi methods, Analysis of means, Analysis of variance, Process optimization
1. Introduction
The last two decades has seen a speedy growth in the novel applications of injection molding of thermoplastic materials. In the process, polymer in the molten phase is injected into a mold cavity and further shaped under high pressure. Injection molding has several advantages such as quick processing times, simplicity of operation, excellent flexibility, corrosion resistance and capability to produce parts of complex geometric configurations [1]. The injection molding process however has limitations including occurrence of defects such as shrinkage, sink marks and warpage. These defects are caused by variations in temperature and pressure that causes inducement of residual stresses on the part surfaces.
International Research Journal of Engineering and Technology
(IRJET)
e-ISSN: 2395-0056 Volume: 06 Issue: 04 | Apr 2019 www.irjet.net p-ISSN: 2395-0072© 2019, IRJET | Impact Factor value: 7.211 | ISO 9001:2008 Certified Journal | Page 1532
dimensional shrinkage effect. However, the method failed in predicting the residual stress levels at different conditions and instances of injection molding. A similar approach was followed in [10] using global optimization genetic algorithm and back propagation neural network to correlate the responses and the process control variables. Five variables were observed to be dominant in controlling the injection molding process. The variables were packing pressure, packing time, mold temperature, melt temperature and cooling time.
2. Injection molding process control variables
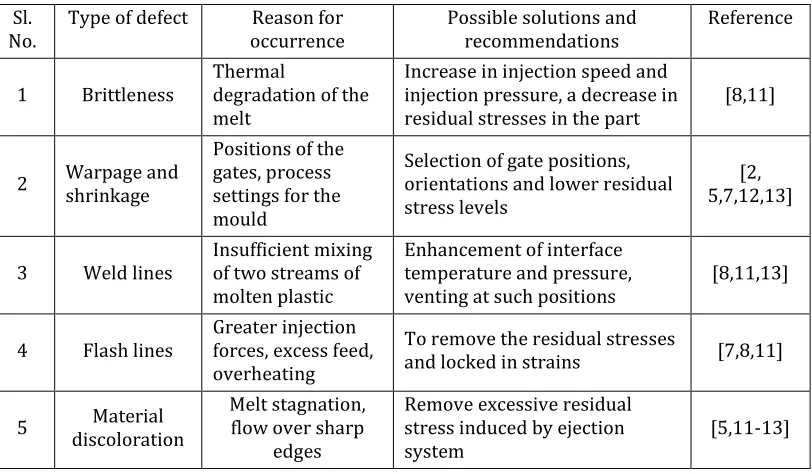
[image:2.612.106.512.239.476.2]In injection molding process, the properties of the thermoplastic material, design of the feeding system and the process control variables determine the inducement of residual stresses in the products. Table 1 shows a summary indicating various defects in the injection molded products.
Table 1. A summary of common defects in injection molded products
Sl.
No. Type of defect occurrence Reason for Possible solutions and recommendations Reference
1 Brittleness Thermal degradation of the melt
Increase in injection speed and injection pressure, a decrease in
residual stresses in the part [8,11]
2 Warpage and shrinkage
Positions of the gates, process settings for the mould
Selection of gate positions, orientations and lower residual stress levels
[2, 5,7,12,13]
3 Weld lines Insufficient mixing of two streams of molten plastic
Enhancement of interface temperature and pressure,
venting at such positions [8,11,13]
4 Flash lines Greater injection forces, excess feed, overheating
To remove the residual stresses
and locked in strains [7,8,11]
5 discoloration Material Melt stagnation, flow over sharp edges
Remove excessive residual stress induced by ejection
system [5,11-13]
The occurrence of defects in injection molding process is primarily due to residual stresses accumulated during the period after the filling. The residual stresses induced in the part are controlled by the injection molding variables, material of the mold and the geometry of the mold [14].
International Research Journal of Engineering and Technology
(IRJET)
e-ISSN: 2395-0056 Volume: 06 Issue: 04 | Apr 2019 www.irjet.net p-ISSN: 2395-0072© 2019, IRJET | Impact Factor value: 7.211 | ISO 9001:2008 Certified Journal | Page 1533
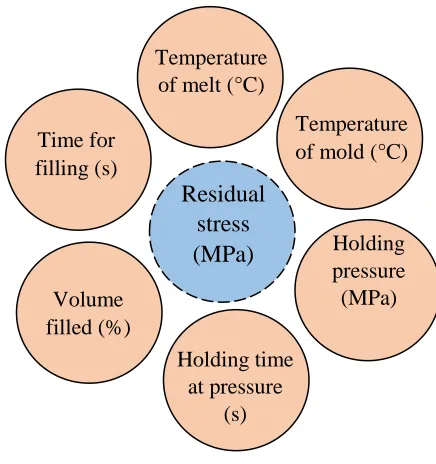
Fig. 1 Identification of the factors influencing residual stress in injection molding
3. Research methodology
For the present investigation, annealed stainless steel is used as the mold, and PVC is used as the material. The properties of the mold and material are shown in Table 2.
Table 2. Governing properties of material and mold
Sl. No Material: PVC Mold: Annealed SS grade 420 1 Allowable shear stress
(MPa) 0.19 Specific heat (J/g°C) 0.46 2 Allowable shear rate (s
-1)
20,000 Thermal conductivity
(W/cm°C) 0.25 3 Poisson’s ratio 0.38
4 Thermal expansion coefficient (°C)-1
0.00007
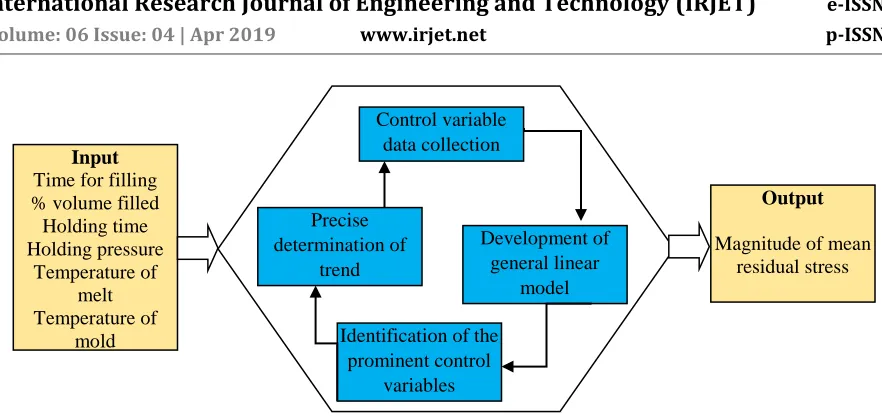
Fig. 2 shows a schematic of the methodology of this research. The data ranges for the control variables are selected and provided as the input for the analysis. Furthermore, the absolute values of the residual stresses (raw data) are collected and are chosen as the process output. The analysis of means and analysis of variance techniques are employed to generate a relationship between residual stress and control variables.
Residual
stress
(MPa)
Time for
filling (s)
Temperature
of melt (°C)
Temperature
of mold (°C)
Volume
filled (%)
Holding time
at pressure
(s)
[image:3.612.185.403.77.309.2]International Research Journal of Engineering and Technology
(IRJET)
e-ISSN: 2395-0056 Volume: 06 Issue: 04 | Apr 2019 www.irjet.net p-ISSN: 2395-0072 [image:4.612.77.518.42.250.2]© 2019, IRJET | Impact Factor value: 7.211 | ISO 9001:2008 Certified Journal | Page 1534
Fig. 2 Schematic of methodology of injection molding investigation
4. Results and discussion
[image:4.612.57.549.353.731.2]Table 3 shows the results of the general linear model fitting the control variables and the mean residual stress.
Table 3. Results of general linear model – analysis of variance for residual stress
Factor Type Levels Values Time for filling (s) fixed 3 1.0, 1.5, 2.0
Melt temperature (deg celsius) fixed 3 180, 195, 210 Mold temperature (deg celsius) fixed 3 30, 40, 50 Volume filled (%) fixed 3 92, 96, 100 Holding time at pressure (s) fixed 3 5, 10, 15 Pressure for holding (MPa) fixed 3 60, 80, 100 Coolant in temp.. (deg celsius) fixed 3 15, 20, 25
Analysis of Variance for Residual stress (MPa), using Adjusted SS for Tests
Source DF Seq SS Adj SS Adj MS F P
Time for filling (s) 2 39.799 39.799 19.900 27.06 0.000
Melt temperature (deg celsius) 2 111.116 111.116 55.558 75.56 0.000 Mold temperature (deg celsius) 2 11.350 11.350 5.675 7.72 0.001 Volume filled (%) 2 32.825 32.825 16.413 22.32 0.000 Holding time at pressure (s) 2 29.471 29.471 14.735 20.04 0.000 Pressure for holding (MPa) 2 918.537 918.537 459.269 624.59 0.000 Coolant in temp.. (deg celsius) 2 29.229 29.229 14.615 19.88 0.000 Error 120 88.238 88.238 0.735
Total 134 1260.565
S = 0.857506 R-Sq = 93.00% R-Sq(adj) = 92.18%
Control variable data collection
Development of general linear
model
Identification of the prominent control
variables Precise
determination of trend
Input
Time for filling % volume filled Holding time Holding pressure
Temperature of melt Temperature of
mold
Output
International Research Journal of Engineering and Technology
(IRJET)
e-ISSN: 2395-0056 Volume: 06 Issue: 04 | Apr 2019 www.irjet.net p-ISSN: 2395-0072© 2019, IRJET | Impact Factor value: 7.211 | ISO 9001:2008 Certified Journal | Page 1535
[image:5.612.155.454.167.309.2]As evident from Table 1, all the control variables significantly influence residual stress at a confidence level of 95%. The R-sq value of the data is 93%. The p-values in the table show that all the control variables are significant at 95% confidence level. Furthermore, F-value in the table indicates the relative significance of all the control variables. The highest F-value of 624.59 corresponds to the pressure for holding. The next highest F-value of 75.56 corresponds to melt temperature. As seen from Fig. 3, pressure for holding is the most significant variable.
Fig. 3. F-value representing the relative significance of control variables
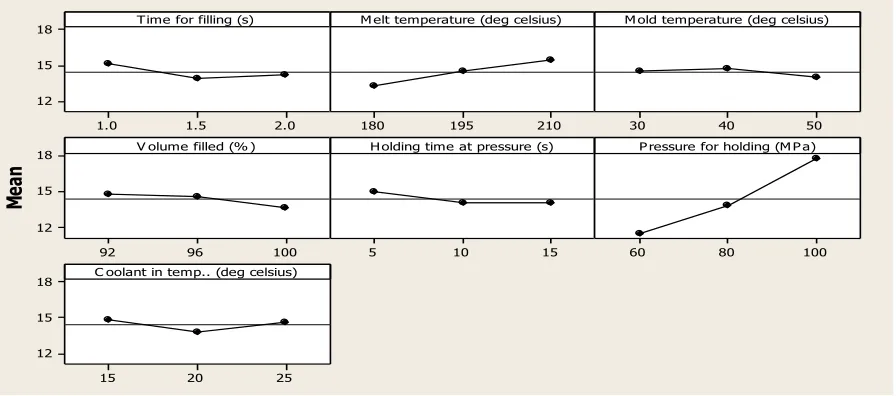
The analysis of means plots for residual stresses is presented in Fig. 4. The pressure for holding and melt temperature causes an increase in residual stress. The trend of both variables is a linear increase. As the pressure for holding increases from 60 to 100 MPa, the increase in residual stress is by 55%. Similarly, with an increase in melt temperature, the increase in residual stress is only by 17%. The residual stress has shown a decreasing trend with an increase in time for filling from 1.0 to 1.5 s. While the time for filling is increased further to 2 s, increase in residual stress is not observed. This indicates that for polymers, an adequate amount of filling time is necessary to achieve a uniform flow of the material in order to get the lowest residual stress. As the mold temperature increases from 30 to 50°C, a slight decrease in residual stress is observed. This is also evident from Table 3, with the lowest value of F as 7.72. The residual stress decreases by 7% with an increase in the percentage of volume filled from 92% to 100%. A similar trend and effect on residual stress is observed for the holding time at pressure. The lowest value of 13.76 MPa is obtained corresponding to a coolant in temperature of 20°C.
Fig. 4 Analysis of means plots for residual stress against control variables 0
100 200 300 400 500 600
2.0 1.5
1.0 18
15
12
210 195
180 30 40 50
100 96
92 18
15
12
15 10
5 60 80 100
25 20
15 18
15
12
Time for filling (s)
M
ea
n
M elt temperature (deg celsius) M old temperature (deg celsius)
V olume filled (% ) H olding time at pressure (s) P ressure for holding (M P a)
C oolant in temp.. (deg celsius)
Main Effects Plot for Residual stress (MPa)
[image:5.612.84.532.480.678.2]International Research Journal of Engineering and Technology
(IRJET)
e-ISSN: 2395-0056 Volume: 06 Issue: 04 | Apr 2019 www.irjet.net p-ISSN: 2395-0072© 2019, IRJET | Impact Factor value: 7.211 | ISO 9001:2008 Certified Journal | Page 1536
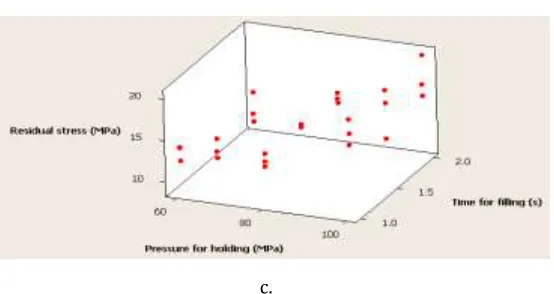
The three dimensional scatter plots of all the control variables with residual stresses are presented in Fig. 5 a-c. Among the seven variables considered in this investigation, only three variables are included in representing relationship using the scatter plots. The variables with the highest values of F values are pressure for holding (F=624.59), melt temperature (F=75.56) and time for filling (F =27.06). According to the analysis of variance, test for lack of fit, comparison of R-squared values and analysis of means, representation of the correlation between residual stress (σr) and the control variables is obtained as a general linear regression equation. The equation (1) can be used to predict average residual stress within the area of statistical investigation.
σr = 5.14593 - 0.974444 tf (s) + 0.0735926 Tme (°C) - 0.0236111 Tmo (°C) - 0.144444 Vf(%) -
0.0995556 thp (s) + 0.158361 Ph (MPa) - 0.0245556 Tin (°C) (1)
where, tf is the time for filling in s, Tme is the temperature of the melt in °C , Tmois thetemperature of the mold °C, Vf is the volume filled in %, thp is the holding time at pressure in s, Ph is the pressure for holding in MPa and Tin is the temperature at the inlet of coolant in °C.
a.
International Research Journal of Engineering and Technology
(IRJET)
e-ISSN: 2395-0056 Volume: 06 Issue: 04 | Apr 2019 www.irjet.net p-ISSN: 2395-0072© 2019, IRJET | Impact Factor value: 7.211 | ISO 9001:2008 Certified Journal | Page 1537
c.
Fig. 5 a-c Three-dimensional scatter plots for combinations of the most significant control variables with residual stress, a. melt temperature × time for filling, b. melt temperature × pressure for holding, c. pressure for holding × time for filling
[image:7.612.173.450.77.224.2]The optimum injection molding parameters for the minimum residual stress were identified as a result of the performed analysis shown in Table 4.
Table 4 Optimum injection molding control variables
Time for
filling (s) Temperature of melt (°C) Temperature of mold (°C) Volume filled (%)
Holding time at pressure
(s)
Pressure for
holding (MPa) temperature Coolant in (°C)
1.5 180 50 100 15 60 20
5. Conclusions and Future work
The paper presents a distinct approach for optimization of injection molding process control variables. The objective function was minimization of residual stress in the process. Based on the investigation and analysis, the following conclusions have been arrived at:
Residual stress is considered to be a major factor influencing the development of defects on injection molded components. Injections molding input settings influence the distribution of residual stresses.
Due to the complex nature of localized distribution of residual stresses, all the control variables including temperatures, pressures, and time of filling indicate a significant influence. The results of statistical treatment obtained using the general linear model also indicates this effect.
The control variables, namely, pressure for holding, melt temperature and time for filling are found to be significant. In order to obtain the optimum operating condition, pressure for holding shows the highest significance with the highest ‘F’ value of 624.59.
The pressure for holding and melt temperature causes a linear increase in the mean residual stress of the injection molded component. As the pressure for holding increases from 60 to 100 MPa, the increase in residual stress is by 55%. Similarly, with an increase in melt temperature, the increase in residual stress is only by 17%.
A general expression for linear regression between residual stress and the control variables was established for the range of values selected in this investigation. Three dimensional scatter plots for the prevailing three control variables, viz. pressure for holding, melt temperature and time for filling was developed against residual stress.
The optimum control variables for the minimum residual stress were obtained for minimum average residual stress: time for filling = 1.5 s, temperature of melt = 180°C, temperature of mold = 50°C, volume filled = 100%, holding time at pressure = 15 s, pressure for holding = 60 MPa and coolant in temperature = 20°C.
International Research Journal of Engineering and Technology
(IRJET)
e-ISSN: 2395-0056 Volume: 06 Issue: 04 | Apr 2019 www.irjet.net p-ISSN: 2395-0072© 2019, IRJET | Impact Factor value: 7.211 | ISO 9001:2008 Certified Journal | Page 1538
Kerala, India, for the successful completion of the work. The authors would also like to acknowledge the support received from TEQIP II scheme, Government College of Engineering Kannur.
References
[1] Schafer, H., Pretschuh, C., Bruggemann, O. (2019), Reduction of cycle times in injection molding of PLA through bio-based nucleating agents, European Polymer Journal, v115, n1, pp. 6-11.
[2] Gu, Y. X., Shen, C. Y. (2001), Numerical simulation of thermally induced stress and warpage in injection-molded thermoplastics, Advanced Polymer Technology, v20, n1, pp. 14-21.
[3] Attia, U. M., Alcock, J. R. (2010), Optimizing process conditions for multiple quality criteria in micro-injection molding,
International Journal of Advanced Manufacturing Technology, v50, n5-8, pp. 533-542.
[4] Nagahanumaiah, Ravi, B. (2009), Effects of injection molding parameters on shrinkage and weight of plastic part produced by DMLS mold, Rapid Prototyping Journal, v15, n3, pp. 179-186.
[5] Erzurumlu, T., Ozcelik, B. (2006), Minimization of warpage and sink index in injection-molded thermoplastic parts using Taguchi optimization method, Materials and Design, v27, n10, pp. 853-861.
[6] Bensingh, R. J., Machavaram, R., Boopathy, S. R., Jebaraj, C. (2019), Injection molding process optimization of a bi-aspheric lens using hybrid artificial neural networks (ANNs) and particle swarm optimization (PSO), Measurement, v1354, n1, pp. 359-374.
[7] Lee, B. H., Kim, B. H. (1995), Optimization of part wall thickness to reduce warpage of injection-molded parts based on the modified complex method, Polymer Plastics Technology Engineering, v34, n1, pp. 793-811.
[8] Tang, S. H., Kong, Y. M., Sapuan, S. M., Samin, R., Sulaiman, S. (2006), Design and thermal analysis of plastic injection mould,
Journal of Materials Processing Technology, v171, n2, pp. 259-267.
[9] Shen, C. Y., Wang, L. X., Li, Q. (2007), Optimization of injection molding process parameters using combination of artificial
neural network and genetic algorithm method, Journal of Materials Processing Technology, v183, n2-3, pp. 412-418.
[10] Yin, F., Mao, H., Hua, L. (2011), A hybrid of back propagation neural network and genetic algorithm for optimization of injection molding process parameters, Materials and Design, v32, n6, pp. 3457-3464.
[11] Tran, N. T., Gehde, M. (2019), Creating material data for thermoset injection molding simulation process, Polymer Testing, v73, n1, pp. 284-292.
[12] Lakkanna, M., Kumar, G. C. M., Kadoli, R. (2016), Computational design of mold sprue for injection molding thermoplastics,
Journal of Computational Design and Engineering, v3, n1, pp. 37-52.
[13] Huang, C. T., Hsu, Y. H., Chen, B. S. (2019), Investigation on the internal mechanism of the deviation between numerical simulation and experiments in injection molding product development, Polymer Testing, v75, n1, pp. 327-336.
[14] Zhou, H., Li, D. (2005), Residual stress analysis of the post-filling stage in injection molding, International Journal of Advanced Manufacturing Technology, v25, n7-8, pp. 700-704.
[15] Sorgato, M., Babenko, M., Lucchetta, G. and Whiteside, B. (2017), Investigation of the influence of vacuum venting on mould surface temperature in micro injection moulding, International Journal of Advanced Manufacturing Technology, v88, n1-4, pp. 547-555.
[16] Alkaabneh, F. A., Barghash, M., Mishael, I. (2013), A combined analytical hierarchical process (AHP) and Taguchi
experimental design (TED) for plastic injection molding process settings, International Journal of Advanced Manufacturing