1
Freeze drying of polyelectrolyte complex nanoparticles: effect of nanoparticle
1composition and cryoprotectant selection
23
Anita Umerska a, b), Krzysztof J. Paluch a), c), Maria-Jose Santos Martinez d), e), Owen I. Corrigan
4
a), Carlos Medina d), Lidia Tajber a) *
5
6
a) School of Pharmacy and Pharmaceutical Sciences, Trinity College Dublin, Dublin 2, Ireland.
7
b) Université de Lorraine, CITHEFOR, F-54000 Nancy, France.
8
c) School of Pharmacy and Medical Sciences, Centre for Pharmaceutical Engineering Science,
9
Faculty of Life Sciences, University of Bradford, Richmond Rd., BD71DP, UK.
10
d) School of Pharmacy and Pharmaceutical Sciences & Trinity Biomedical Sciences Institute,
11
Trinity College Dublin, Dublin 2, Ireland.
12
e) School of Medicine, Trinity College Dublin, Dublin 2, Ireland.
13
14
*To whom correspondence should be addressed: [email protected]
15
Phone: 00353 1 896 2787 Fax: 00353 1 896 2810
16
2 Abstract
18
This work investigates the impact of nanoparticle (NP) composition and effectiveness of
19
cryo-/lyo-protectants in a freeze drying process, which was employed to convert liquid
20
dispersions of polyelectrolyte complex (PEC) NPs into completely redispersible powders. PEC
21
NPs, with and without peptide, were produced by complex coacervation. The
cryo-/lyo-22
protectants investigated were mannitol, trehalose (TRE) and poly(ethylene glycol) (PEG).
23
The solid state of lyophilised powders was studied by thermal analysis and X-ray diffraction.
24
Cytotoxicity studies were done by MTS assay and flow cytometry. The presence of a
25
cryoprotectant was essential to achieve a successful powder reconstitution. The
26
concentration of TRE was optimised for each type of PEC NPs. Protamine- and
hyaluronate-27
based NPs reconstituted better than chitosan- and chondroitin sulphate-based NPs,
28
respectively. PEG polymers were found to be more effective cryoprotectants than TRE and
29
best results were achieved using co-freeze drying of NPs with TRE and PEG. These ternary
30
NPs/TRE/PEG samples were crystalline, with expected better storage stability. PEG polymers
31
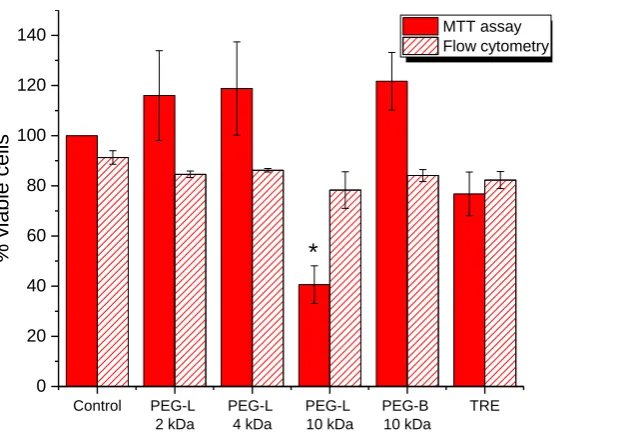
were well tolerated by Caco-2 cells, with the exception of linear PEG 10 kDa. This work
32
shows that, as regards the formulation design and maximising NP loading in the dried
33
product, optimisation of the cryoprotectant type and content is needed as it is highly
34
dependent not only on the type of polyelectrolyte pair in the PEC, but also the polyions
35
ratio.
36
37
38
KEYWORDS: polyelectrolyte complex nanoparticle, freeze drying, hyaluronate, chitosan,
39
chondroitin, protamine
40
3 1. Introduction
42
Nanoparticles (NPs) have been widely investigated for medical applications such as
43
drug delivery systems and tissue engineering (Shi et al., 2010). A considerable effort is
44
currently being directed towards developing NPs composed of naturally occurring polymers
45
such as polysaccharides, in view of their advantages such as biodegradability, safety, low
46
toxicity, satisfactory stability, abundant resources in nature and low processing costs (Liu et
47
al., 2008). Natural polysaccharides are mainly polyelectrolytes, which present an ionic form
48
in aqueous solutions. These polyelectrolytes can spontaneously associate in complexes and
49
form NPs with substances that bear opposite charge via electrostatic interactions.
50
Polyelectrolyte complex (PEC) NPs can be obtained using complex coacervation, a simple
51
method carried out under mild conditions involving mixing of diluted aqueous solutions of
52
polyelectrolytes at room temperature. This approach at making PEC NPs can prevent
53
destruction of the structure and property of biochemical drugs, if incorporated into NPs,
54
including nucleic acids, peptides and proteins (Cegnar et al., 2011; Yang et al., 2015).
55
Furthermore, complex coacervation does not involve the use of organic solvents and/or
56
surfactants and thus is a very attractive approach at making a wide range of NPs for drug
57
delivery applications.
58
However, NPs, as colloidal systems, are thermodynamically unstable and are
59
susceptible to aggregation after periods of storage as a dispersion. Long term stability is an
60
important challenge in the development of NP formulations, especially systems made of
61
polyelectrolytes (Katas et al., 2013). Freeze drying is an attractive approach to achieve the
62
long term stability of NPs formulations as it requires small sample volumes and is relatively
63
easy to scale up (Boge et al., 2018). Lyophilised formulations provide easy handling including
64
shipping and storage (Lu and Pikal, 2004). Moreover, as solid state dosage forms, such as
65
tablets or capsules, remain the formulations of choice for oral drug delivery, the NPs that
66
are prepared as aqueous dispersions must be transformed into dry powders to be further
67
processed into solid state dosage forms (Wong et al., 2018). It is recognised that stress
68
generated during freeze drying (freezing and water removal) may adversely impact the
69
properties of NPs (Abdelwahed et al., 2006; Fang et al., 2009). Additionally, inadequate
70
reconstitution of freeze dried NPs in the aqueous media represents a major obstacle
71
because it can lead to the formation of large particle aggregates and the loss of beneficial
72
colloidal properties of the nanosystem (Cegnar et al., 2011). Many studies published to date
4
presented that, to effectively stabilise NPs during freeze drying as well as to ensure their
74
adequate reconstitution, suitable excipients are required (de la Fuente et al., 2008; Fang et
75
al., 2009). They typically include using a cryo- and/or lyo-protectant that protects the NPs
76
during the freezing and/or drying stage of the process, respectively.
77
Although lyophilisation of various types of NPs have been studied (Abdelwahed et
78
al., 2006), optimal conditions depend mainly on the nature of particle systems, thus have to
79
be customised for each formulation (Cegnar et al., 2011). Freeze drying of polyelectrolyte
80
complex NPs presents a particular challenge, as they are mainly stabilised by charge, thus
81
susceptible to changes in the medium parameters (pH and ionic strength) (Cegnar et al.,
82
2011), their shape/structure is less defined (Umerska et al., 2014b) as opposed to e.g.
83
poly(lactic-co-glycolic) acid-based NPs and are surfactant-free formulations and surfactants
84
such as polyvinyl alcohol can act as cryo-/lyo-protectants and facilitate redispersibility of the
85
NPs (Umerska et al., 2018). For PEC NPs, freeze drying of chitosan-based NPs has been
86
studied (Rampino et al., 2013), including alginate/chitosan (Cegnar et al., 2011) and
87
hyaluronate-coated chitosan NPs (Veilleux et al., 2018), but not other types of PEC NPs.
88
Thus, there is a literature gap as the main focus of research is often formulate NPs with a
89
specific delivery target but not on subsequent transformation into the solid state for
long-90
term stability. For instance, de la Fuente et al. (2008) freeze dried only one type of
91
polyelectrolyte hyaluronate-chitosan-tripolyphosphate NPs (concentration range between
92
0.075 and 0.5 mg/ml) in the presence of either glucose or trehalose at a relatively high
93
concentration of 5% w/v, but freeze drying was not the main subject of the study and no
94
deep investigation into this subject was performed such as effective minimising of
95
cryoprotectant concentration or influence of the NP composition.
96
The addition of a suitable lyo-/cryo-protective agent before freezing prevents NPs
97
from aggregating. It is well established that sugars can be employed for this purpose (Boge
98
et al., 2018; Cegnar et al., 2011; Rampino et al., 2013). Non-reducing compounds such as
99
trehalose, mannitol and sucrose are preferred to avoid potential Maillard reaction of the
100
excipient with protein, especially for protein-based nano-formulations (Anhorn et al., 2008).
101
Those compounds have been shown to be effective in maintaining the properties of NPs
102
after the lyophilisation process (Anhorn et al., 2008; Holzer et al., 2009).The advantages of
103
trehalose over other sugars include lower hygroscopicity, the absence of internal hydrogen
104
bonds and consequently more flexible formation of hydrogen bonds with NPs, a very low
5
chemical reactivity and, finally, a high glass transition temperature (Abdelwahed et al.,
106
2006; Crowe et al., 1996; Hafner et al., 2011). Apart from trehalose, poly(ethylene glycol)
107
(PEG) polymers have also been used as stabilisers in freeze drying of NPs including chitosan
108
NPs (Rampino et al., 2013), however no systematic study on the influence of molecular
109
weight or branching has been published thus far.
110
In this work, two polycations, chitosan (CHIT) and protamine (PROT), and two
111
polyanions, hyaluronic acid (HA) and chondroitin sulphate (CHON), were examined as
112
candidate components of PEC NPs. These polyelectrolytes possess numerous advantages as
113
they are reasonably cheap, biocompatible, biodegradable, of natural origin, already well
114
characterised and have history of use in pharmaceutical products. They have received a
115
particular attention as carrier materials because they present interesting biological and/or
116
pharmacological properties. CHON exhibits anti-inflammatory activity (Iovu et al., 2008) and
117
is currently used as a chondroprotective drug together with glucosamine. HA also exhibits
118
anti-inflammatory effects (Ryan et al., 2013) and binds to the CD44 receptor, which is
119
overexpressed in a wide variety of cancer cells and therefore has been extensively studied
120
as a therapeutic target (Platt and Szoka, 2008). Moreover, HA coating considerably reduces
121
hemolysis and hemagglutination of chitosan polyplexes and thereby facilitates intravenous
122
administration (Veilleux et al., 2018). CHIT has antibacterial activities (Raafat et al., 2008),
123
while PROT is used as an antagonist for heparin (Jaques, 1973) and due to the presence of
124
arginine it provides membrane translocation activities (Reynolds et al., 2005).
125
Considering the above, the goal of this work is to identify if and how the type of a
126
lyo-/cryo- protective agent, its concentration and composition of NPs (type, starting
127
concentration and content of polyions as well as the presence of a peptide) affect the ability
128
of liquid NP dispersions to be freeze dried into powders that completely redisperse upon
129
reconstitution. The solid state of lyophilised products was examined as the
130
amorphous/crystalline character of the powder may determine the storage shelf-life, while
131
the cytotoxic properties may limit the use of some of the excipients from wider applications.
132
2. Materials and methods 133
2.1. Materials 134
Hyaluronic acid sodium salt (HA) from Streptococcus equi sp. (sodium content 3.6%
135
w/w, molecular weight app. 2900 kDa), chondroitin 4-sulfate sodium salt (CHON, sodium
136
content 5.6% w/w, molecular weight 59 kDa), protamine sulphate (PROT, molecular weight
6
5.1 kDa), trehalose dihydrate and poly(ethylene glycol) (PEG) linear polymers with different
138
molecular weights were purchased from Sigma-Aldrich (Ireland). Chitosan chloride high
139
molecular weight (CHH, chloride content 15.5% w/w, degree of deacetylation 83%,
140
molecular weight 110 kDa) was obtained from Novamatrix (Norway), while chitosan chloride
141
low molecular weight (CHL, chloride content 13.6% w/w, degree of deacetylation 82%,
142
molecular weight 42kDa) was acquired from Chitoceuticals (Germany). Four-arm branched
143
PEG with a molecular weight of 10 kDa was sourced from JenKem Technology USA Inc.
144
(Allen, USA). Salmon calcitonin (sCT) was obtained from PolyPeptide Laboratories (Sweden).
145
APC annexin V and propidium iodide were purchased from BD Biosciences (USA) and
146
CellTiter 96® Non-Radioactive Cell Proliferation Assay from Promega Corporation (USA).
147
Other cell culture reagents were provided by Sigma Aldrich (Ireland). All other reagents,
148
chemicals and solvents were of analytical grade.
149
2.2. Methods 150
2.2.1 Preparation of polyelectrolyte NPs 151
All NPs were synthesised using a surfactant- and solvent-free polyelectrolyte complexation
152
in an aqueous media as previously described (Umerska et al., 2017, 2015, 2014b, 2012).
153
Briefly, all solutions of polyions were made in deionised water. HA solutions were sonicated
154
before mixing with a polycation solution for 2 hours at an amplitude of 80% (13 W) with the
155
aid of a 130 Watt ultrasonic processor (SONICS VC130PB, Sonics and Materials Inc., USA) to
156
obtain HA fragments with a molecular weight of app. 260 kDa.
157
Chitosan-based NPs (CCH or CHL) were made using either 1 or 2 mg/ml solutions of the
158
polycation. A volume of the chitosan solution was added to a predefined volume of the
159
polyanion solution, HA or CHON at 1 or 2 mg/ml, using a one shot addition at room
160
temperature under magnetic stirring. The stirring was maintained for 10 minutes to allow
161
stabilisation of the system. Details of composition, including the total polyion concentration
162
(TPC) and the polyanion to polycation mass mixing ratio (MMR) of the various systems made
163
are summarised in Table 1.
164
PROT-based systems were made as follows. An aliquot of 4 ml of PROT aqueous solution
165
with various concentrations, as outlined in Table 2, was added to 10 ml of a HA or CHON
166
solution at room temperature under magnetic stirring. The stirring was maintained for 10
167
minutes to allow stabilisation of the system, as for the chitosan-based NPs.
7
To make salmon calcitonin-containing NPs, the peptide was dissolved at a concentration of
169
0.5 mg/ml in the HA or CHON solution and mixed with a solution of the polycation as
170
described above.
171
172
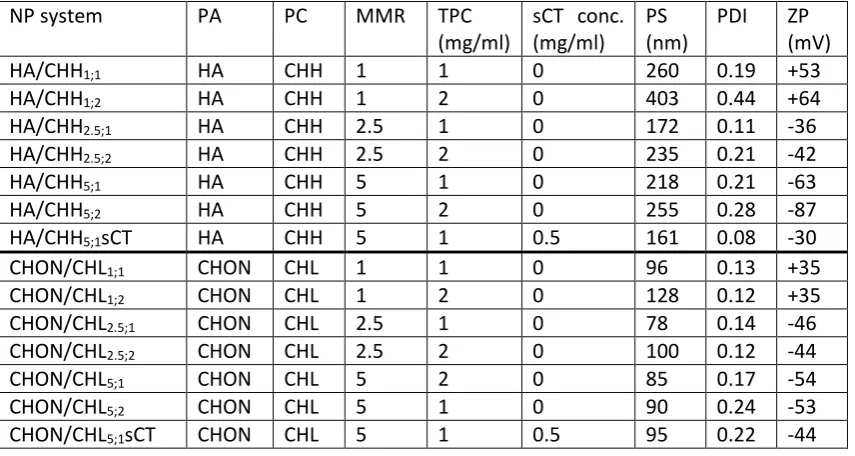
Table 1 Composition and characteristics of chitosan-based NPs. The PS, PDI and ZP values 173
were measured directly after manufacturing the NP systems, before cryoprotectant addition
174
and freeze drying. HA – hyaluronic acid, CHON – chondroitin sulphate, CHH – chitosan high
175
molecular weight, CHL - chitosan low molecular weight, PA – polyanion, PC- polycation,
176
MMR - PA/PC mass mixing ratio, TPC – total polyelectrolyte concentration, sCT – salmon
177
calcitonin, PS - hydrodynamic particle size, PDI – polydispersity index and ZP – zeta
178
potential.
179
NP system PA PC MMR TPC
(mg/ml)
sCT conc. (mg/ml)
PS (nm)
PDI ZP (mV)
HA/CHH1;1 HA CHH 1 1 0 260 0.19 +53
HA/CHH1;2 HA CHH 1 2 0 403 0.44 +64
HA/CHH2.5;1 HA CHH 2.5 1 0 172 0.11 -36
HA/CHH2.5;2 HA CHH 2.5 2 0 235 0.21 -42
HA/CHH5;1 HA CHH 5 1 0 218 0.21 -63
HA/CHH5;2 HA CHH 5 2 0 255 0.28 -87
HA/CHH5;1sCT HA CHH 5 1 0.5 161 0.08 -30
CHON/CHL1;1 CHON CHL 1 1 0 96 0.13 +35
CHON/CHL1;2 CHON CHL 1 2 0 128 0.12 +35
CHON/CHL2.5;1 CHON CHL 2.5 1 0 78 0.14 -46
CHON/CHL2.5;2 CHON CHL 2.5 2 0 100 0.12 -44
CHON/CHL5;1 CHON CHL 5 2 0 85 0.17 -54
CHON/CHL5;2 CHON CHL 5 1 0 90 0.24 -53
CHON/CHL5;1sCT CHON CHL 5 1 0.5 95 0.22 -44
[image:7.595.86.514.262.490.2]180
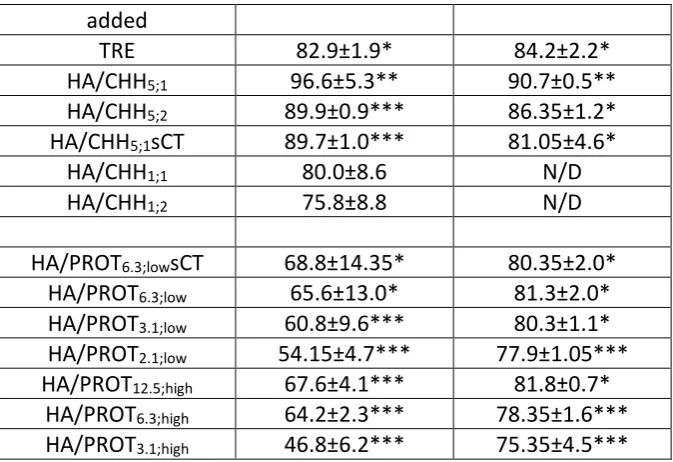
Table 2 Composition and characteristics of PROT-based NPs. The PS, PDI and ZP values were 181
measured directly after manufacturing the NP systems, before cryoprotectant addition and
182
freeze drying. HA – hyaluronic acid, CHON – chondroitin sulphate, PROT – protamine, PA –
183
polyanion, PC- polycation, MMR - PA/PC mass mixing ratio, TPC – total polyelectrolyte
184
concentration, sCT – salmon calcitonin, PS - hydrodynamic particle size, PDI – polydispersity
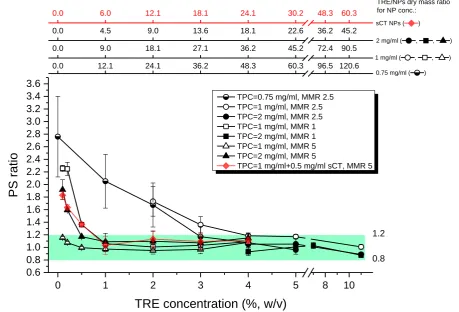
185
index and ZP – zeta potential.
186
NP system PA PA
conc. (mg/ml)
PC PC conc. (mg/ml)
MMR TPC (mg/ml)
sCT conc. (mg/ml)
PS (nm)
PDI ZP (mV)
HA/PROT2.1;low HA 0.714 PROT 0.343 2.1 1.06 0 159 0.11 -39
HA/PROT3.1;low HA 0.714 PROT 0.229 3.1 0.94 0 119 0.14 -51
HA/PROT6.3;low HA 0.714 PROT 0.114 6.3 0.83 0 87 0.20 -69
HA/PROT6.3;lowsCT HA 0.714 PROT 0.114 6.3 0.83 0.5 140 0.20 -39
HA/PROT3.1;high HA 1.429 PROT 0.457 3.1 1.89 0 159 0.14 -57
HA/PROT6.3;high HA 1.429 PROT 0.229 6.3 1.66 0 127 0.17 -94
HA/PROT12.5;high HA 1.429 PROT 0.114 12.5 1.54 0 107 0.20 -125
CHON/PROT2.1;low CHON 0.714 PROT 0.343 2.1 1.06 0 93 0.12 -49
[image:7.595.51.548.587.759.2]8 CHON/PROT6.3;low CHON 0.714 PROT 0.114 6.3 0.83 0 88 0.40 -57
CHON/PROT6.3;lowsCT CHON 0.714 PROT 0.114 6.3 0.83 0.5 61 0.42 -43
CHON/PROT3.1;high CHON 1.429 PROT 0.457 3.1 1.89 0 78 0.16 -50
CHON/PROT6.3;high CHON 1.429 PROT 0.229 6.3 1.66 0 84 0.26 -54
CHON/PROT12.5;high CHON 1.429 PROT 0.114 12.5 1.54 0 88 0.40 -59
187
2.2.2 Freeze drying and redispersibility of NPs 188
An appropriate amount of trehalose dihydrate (TRE), poly(ethylene glycol) (PEG, with
189
molecular weight of 2,000 or 4,000 or 10,000 linear or 10,000 branched) or a mixture of TRE
190
and PEG was added to NP dispersion and dissolved. The concentrations of TRE presented in
191
this work refer to trehalose dihydrate. The ratios of anhydrous trehalose to NP in
192
weight/weight ratios are presented in Figure 1.
193
Aliquots of the formulation (4 ml) were dispensed into 15 ml Greiner plastic
194
centrifuge tubes and immediately shock-frozen in liquid nitrogen (Abdelwahed et al., 2006;
195
Molpeceres et al., 1997). Tubes with the frozen samples were placed in VirTis wide mouth
196
filter seal glass flasks and attached to one of the ports of manifold of a benchtop VirTis 6K
197
freeze dryer model EL (SP Scientific, USA). Vacuum of 29-31 mtorr was obtained by the use
198
of an Edwards 5 RV5 rotary vane dual stage mechanical vacuum pump (Edwards, England).
199
After 48 hours of freeze drying the tubes were removed, capped and stored at 4 °C if
200
storage was required. Freeze drying was performed on at least three independent samples
201
of each formulation.
202
Sample reconstitution was performed by adding 4 ml of water (or serum-free
203
medium for cell culture experiments) to the whole content of powder in the 15 ml tube and
204
manual, moderate shaking. No sonication or mechanically-assisted mixing was employed.
205
Samples after reconstitution were analysed in triplicate.
206
2.2.3 Particle size and zeta potential analysis 207
The intensity-averaged mean particle size (particle size diameter) and the
208
polydispersity index of the nanoparticles were determined by Dynamic Light Scattering (DLS)
209
with the use of 173° backscatter detection and the electrophoretic mobility values
210
measured by Laser Doppler Velocimetry (LDV) were converted to zeta potential by the
211
Smoluchowski equation, as described before (Umerska et al., 2012). DLS and LDV
212
measurements were done using a Zetasizer Nano series Nano-ZS ZEN3600 fitted with a 633
213
nm laser (Malvern Instruments Ltd., UK). Samples were placed directly into the folded
9
capillary cells (DTS1061) without dilutions. Each analysis was carried out at 25 °C with the
215
equilibration time set to 5 minutes. The readings were carried out at least three times for
216
each batch and the average values of at least three batches are presented. The results were
217
adjusted taking into account viscosity of the continuous medium.
218
For the clarity of data presentation and discussion, hydrodynamic particle size (PS)
219
ratios were calculated for all NP systems, defined as the ratio of the size after and before
220
freeze drying. The redispersibility was considered as very good, when the particle size did
221
not change more than 20% (i.e. the PS ratio was between 0.8-1.2). For comparison, Fang et
222
al. (2009) considered the ratio of 0.7-1.3 (±30%) appropriate, indicating satisfactory
223
reconstitution.
224
2.2.4 Separation of non-associated sCT and quantification of the peptide 225
Non-associated sCT was separated from nanoparticles by a combined
ultrafiltration-226
centrifugation technique (Centriplus YM-50, MWCO of 50 kDa for HA-based NPs or Amicon
227
Ultra-15, MWCO of 30 kDa for CHON-based NPs; Millipore, USA) using a validated technique
228
as described before (Umerska et al., 2015, 2014b, 2014a). The quantity of total and
non-229
associated sCT was measured by an isocratic HPLC method presented previously (Umerska
230
et al., 2014b). Association efficiency (AE) and sCT loading (PL) were calculated with the use
231
of the following equations:
232
AE=[(A-B)/A]*100% (Eqn. 1)
233
where A is the total amount of sCT and B is the mass of non-associated sCT;
234
PL=[(A-B)/C]*100% (Eqn. 2)
235
where C is the total weight of all the components of NPs.
236
2.2.5 Differential Scanning Calorimetry (DSC) 237
DSC experiments were conducted using a Mettler Toledo DSC 821e with a
238
refrigerated cooling system (LabPlant RP-100, UK), according to the method presented by
239
Umerska et al. (2015). Nitrogen was used as the purge gas. Hermetically sealed aluminium
240
pans with three vent holes were used throughout the study and sample weights varied
241
between 2 and 7 mg, depending on bulk density of the sample. DSC measurements were
242
carried out at a heating/cooling rate of 10 °C/min.
243
2.2.6 Powder X-ray diffraction (PXRD) 244
Powder ray diffraction analysis was conducted using a Rigaku Miniflex II desktop
X-245
ray diffractometer (Rigaku, Japan) operating at 30 kV and 15 mA and fitted with a Haskris
10
cooling unit. Ni-filtered Cu Kα radiation (λ=1.5408 Å) was used. Room temperature
247
measurements were recorded for the range 5-40 2theta degrees at a step size of 0.05° per
248
second. A low background silicon mount (Rigaku, Japan) was used to support the sample
249
during measurements.
250
2.2.7 Cell culture studies 251
Human epithelial colorectal adenocarcinoma cells (Caco-2) were obtained from
252
European Collection of Cell Cultures (Sigma-Aldrich, UK). Cells were cultured in 75 cm2 cell
253
culture flasks in Eagle’s Minimal Essential Medium (MEM), supplemented with 20% foetal
254
bovine serum, penicillin (0.006 mg/ml), streptomycin (0.01 mg/ml), gentamicin (0.005
255
mg/ml), sodium bicarbonate (2.2 g/l), sodium pyruvate (0.11 g/l), pH 7.4 at 5% CO2 and 37
256
°C humidified atmosphere (CO2 incubator series 8000DH, ThermoScientific). Cells were
257
supplied with fresh medium every second day and split after detaching with
258
ethylenediaminetetraacetic acid (EDTA)-trypsin twice a week. For experimental purposes
259
the passage number range was maintained between 20 and 30.
260
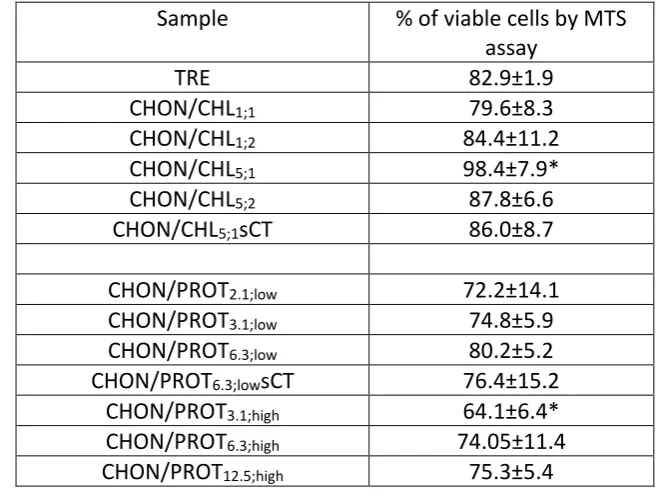
2.2.8 MTS assay 261
MTS assay was carried out according to the method presented previously (Umerska
262
et al., 2015). Briefly, Caco-2 cells were seeded into flat-bottom 96-well plates in 100 µl of
263
whole media (MEM supplemented with 20% FBS) at a density of 25,000 cells per well (cells
264
were previously counted with the aid of Z1 Coulter Particle Counter, Beckman Coulter) and
265
incubated at 37 °C for 24h. The medium was then replaced with 100 µl of the sample
266
dispersed or dissolved in free media. After 72 h of incubation, or 24 h when a
serum-267
free medium at pH-5 was used, the supernatant was removed from the wells and replaced
268
with serum-free media. A quantity of 20 µl of the MTS reagent prepared according to the
269
manufacturer protocol was then added into each well; in case of positive control (0%
270
viability) the media was replaced by 10% SDS solution in serum-free media 30 min before
271
the addition of MTS reagent. After 4 hours the UV absorbance of the formazan product was
272
measured spectrophotometrically (FLUOstar Optima microplate reader, BMG Labtech) at
273
492 nm. Positive control was treated as a blank and its absorbance was subtracted from
274
each reading. The cells viability was expressed as the ratio of the absorbance reading of the
275
cells treated with different samples and for negative control (cells treated with serum-free
276
MEM), which was assumed to have 100% of the cells viability. IC50 values (concentrations
277
required to reduce the viability of cells by 50% as compared with the control cells) were
11
calculated by fitting the experimental points to the Hill equation (Goutelle et al., 2008). At
279
least three different batches of samples were tested in cells with at least three different
280
passage numbers.
281
2.2.9 Flow cytometry 282
The content of one 75 cm2 flask of confluent Caco-2 cells was seeded into eight 25
283
cm2 flasks, each containing Caco-2 cells suspended in 4 ml of MEM supplemented with 20%
284
FBS. Cells were allowed to attach for 24-48 hours. The medium was then replaced with 3 ml
285
of sample (sonicated HA). After 72 hours of incubation the supernatant was removed and
286
cells were harvested with trypsin/EDTA. After neutralisation, the cells were combined with
287
the previously removed supernatant and centrifuged (300 g, 5 minutes); the supernatant
288
from centrifugation was discarded, and cells were washed with binding buffer (0.14M NaCl,
289
0.0025M CaCl2 and 0.01M 4-(2-hydroxyethyl)-1-piperazineethanesulfonic acid (HEPES), pH
290
7.4 adjusted with NaOH solution). 20 μl of the cells suspension were stained with 5μl of
291
APC-Annexin V, 5 μl of propidium iodide and diluted with 70 μl of binding buffer and
292
incubated in dark at room temperature for 15 minutes. Then the cell suspension was further
293
diluted with binding buffer, transferred to a flat bottom 96-wells plate and applied to flow
294
cytometric analysis. All analyses were performed by a BD FACSArrayTM bioanalyser (Becton
295
Dickinson, UK). The instrument was set up to measure the size (forward scatter), granularity
296
(side scatter) and cell fluorescence. Antibody binding was measured by analysing individual
297
cells for fluorescence. The mean fluorescence intensity was determined after correction for
298
cell autofluorescence. Fluorescence histograms were obtained for 10000 individual events.
299
Data were analysed using BD FACSArrayTM system software and expressed as a percentage
300
of control fluorescence in arbitrary units. At least three different batches of samples were
301
tested in cells with at least three different passage numbers.
302
2.2.10 Statistical analysis 303
The data were analysed using one-way analysis of variance (Minitab software). The results
304
are expressed as mean ± S.E.M. of at least three independent experiments. Tukey-Kramer
305
multiple comparisons test was performed where appropriate. Statistical significance was
306
considered when p<0.05.
307
3. Results and Discussion 308
12
Polyelectrolyte complex nanoparticles (PEC NPs) were prepared by a complex
310
coacervation method based on previous reports (Umerska et al., 2017, 2015, 2014a, 2014b,
311
2012). Considering that a very wide range of particles were synthesised and presented in
312
those reports, only formulations that yielded colloidally stable NPs as well as characterised
313
by small size and large absolute value of zeta potential were selected for the current study
314
and the PEC formation was conducted in diluted solutions to prevent aggregation caused by
315
viscosity of the polyion solutions (Quiñones et al., 2018). Both, positively and negatively
316
charged CHIT NPs were successfully obtained (Table 1). The main factor that determined the
317
zeta potential was the polyanion to polycation mass mixing ratio (MMR) for both, HA/CHIT
318
and CHON/CHIT NPs. The MMR also affected the size and size distribution of these PEC NPs.
319
As it was impossible to obtain physically stable for at least 24 hours PROT NPs, only
320
negatively charged PROT NPs were selected for the lyophilisation studies. The instability of
321
positively charged PROT NPs was attributed to a large difference in molecular weight
322
between PROT and polyanions (either HA or CHON) (Umerska et al., 2014b). Other
323
parameters that affected the properties of obtained PEC NPs were the type of polymer used
324
(HA versus CHON), polymer concentration and incorporation of the peptide.
325
3.2. Freeze drying and NP reconstitution 326
3.2.1. Freeze drying of NPs without a cryoprotectant 327
Given the fact that HA has been described as an efficient cryoprotectant for freeze
328
drying of liposome formulations (Peer et al., 2003), first attempts at processing were made
329
using native HA/CHH NPs (HA/CHH2.5;1 and HA/CHH5;1) dispersions without addition of any
330
protective agents. NPs processed in this way did not redisperse and in the reconstituted
331
suspension aggregates as well as NPs with the average size of a 3-fold greater (HA/CHH2.5;1)
332
than the non-processed NPs were present. Similar to this outcome, unsuccessful trials to
333
freeze dry HA-CHIT-tripolyphosphate NPs were made by de la Fuente et al. (2008), who
334
attributed this failure to the presence of only a small amount of HA in the suspending
335
medium after the formation of NPs.
336
The stability of PEC NPs in aqueous dispersions is mainly governed by electrostatic
337
(charge) but also steric (due to the polymeric corona) stabilisation effects. Electrostatic
338
stabilisation is the result of the presence of electrical double layers, which cause particle
339
repulsion, and is determined by the magnitude of the surface or zeta potential, electrolyte
340
concentration and valence (Tadros, 2010). As mentioned earlier, the formation of PEC NPs
13
must be conducted in diluted dispersions to prevent their aggregation. During the freezing
342
step, as a result of ice formation, the liquid phase becomes more concentrated and the
343
distance between the particles decrease, thus increasing interparticulate attraction leading
344
to aggregation. Moreover, the polyelectrolytes are present as salts and the dispersions
345
contain either chloride or sulphate anions from CHIT and PROT, respectively, and sodium
346
cations from either CHON or HA. Although in the initial dispersion the concentration of
347
inorganic counterions is low, the formation of concentrated cryo-solution during the
348
freezing step can markedly increase their concentration, thereby reducing electrostatic
349
repulsion forces (through charge screening).
350
3.2.2. Freeze drying of polyelectrolyte NPs with mannitol 351
Although Anhorn et al. (2008) demonstrated that mannitol can be an effective
352
cryoprotectant for human serum albumin-based NPs, attempts to use mannitol (at 1, 2, 3
353
and 5% w/v) as a cryoprotectant for HA/CHH NPs (HA/CHH2.5;1) were unsuccessful. When
354
HA/CHH NPs were lyophilised with mannitol, a substantial NP coagulation and/or
355
aggregation into microparticles upon reconstitution was seen in all samples tested.
356
Mannitol is a low molecular weight sugar alcohol, which forms a crystalline phase upon
357
lyophilisation (Kim et al., 1998). It is probable that the growing crystals of mannitol induced
358
mechanical stress and resulted in the reduction of space available for NPs. NPs in this
359
nanoparticle-rich and poorly hydrated phase may more readily interact and form aggregates
360
(Abdelwahed et al., 2006; Cegnar et al., 2011; Cesàro et al., 2008; Rampino et al., 2013).
361
Therefore, to achieve an effective preservation of NP properties and successful
362
reconstitution, it appears important that at least a fraction of the cryo-protectant remains
363
molecularly disordered to stabilise the PEC NPs.
364
3.2.3. Freeze drying of polyelectrolyte NPs with trehalose 365
3.2.3.1. HA/chitosan NPs 366
As it was impossible to successfully redisperse the NPs when freeze dried on their
367
own or with addition of mannitol, preliminary experiments were first conducted to test if
368
trehalose (TRE) could be a viable cryoprotectant for HA/CHH NPs. HA/CHH2.5;0.75 and
369
HA/CHH2.5;1 were freeze dried in the presence of different concentrations of TRE and the PS
370
ratios are presented in Figure 1. When NPs (HA/CHH2.5;0.75)were lyophilised with 1% w/v
371
TRE, the PS ratio did not change significantly in comparison to HA/CHH2.5;1 processed with
372
no cryoprotectant and moderate particle aggregation was observed (Figure 1). An increase
14
in TRE concentration to 2% w/v resulted in a decrease in the PS ratio to 1.67±0.35 and
374
1.73±0.23 (for HA/CHH2.5;0.75 and HA/CHH2.5;1, respectively) and, more importantly, only in a
375
slight NP aggregation. A very good redispersibility was achieved when HA/CHH NPs were
376
freeze dried at the TPC of 0.75 mg/ml with 3, 4 or 5% w/v of TRE, as the PS ratio was
377
between 1.17±0.16 (3% w/v TRE) and 0.96±0.07 (5% w/v TRE) and aggregation was not
378
seen. However, when the TPC was increased to 1 mg/ml, 3% w/v of TRE produced an
379
acceptable redispersion and no aggregation was observed, but the particle size increased by
380
36% after freeze drying in comparison to the starting value.
381
0 1 2 3 4 5 8 10
0.6 0.8 1.0 1.2 1.4 1.6 1.8 2.0 2.2 2.4 2.6 2.8 3.0 3.2 3.4 3.6
sCT NPs ( )
2 mg/ml ( , , )
0.75 mg/ml ( )
PS ratio
TRE concentration (%, w/v)
TPC=0.75 mg/ml, MMR 2.5 TPC=1 mg/ml, MMR 2.5 TPC=2 mg/ml, MMR 2.5 TPC=1 mg/ml, MMR 1 TPC=2 mg/ml, MMR 1 TPC=1 mg/ml, MMR 5 TPC=2 mg/ml, MMR 5
TPC=1 mg/ml+0.5 mg/ml sCT, MMR 5
0.8 1.2
1 mg/ml ( , , )
0.0 12.1 24.1 36.2 48.3 60.3 96.5 120.6
0.0 9.0 18.1 27.1 36.2 45.2 72.4 90.5
TRE/NPs dry mass ratio for NP conc.:
0.0 6.0 12.1 18.1 24.1 30.2 48.3 60.3
0.0 4.5 9.0 13.6 18.1 22.6 36.2 45.2
382
Figure 1. The particle size (PS) ratio (i.e. the ratio of PS after and before freeze drying) of 383
HA/CHH NPs freeze dried with trehalose (TRE) at different concentrations. The NP TPC of
384
0.75 mg/ml was obtained by dilution of 1 mg/ml TPC nanodispersions with TRE solution.
385
Upper axes present the equivalent TRE (as anhydrous sugar)/NPs dry mass ratio depending
386
on the concentration of NP components. The green band indicates the PS ratio between 0.8
387
and 1.2, considered as very good redispersibility of processed NPs. TPC - total
388
polyelectrolyte concertation, MMR - polyanion/polycation mass mixing ratio, sCT- salmon
389
calcitonin.
390 391
The redispersibility of HA/CHH2.5;1 was considered to be very good when at least 4%
392
w/v of TRE was used as the cryoprotectant. When the TPC was further increased to 2 mg/ml
393
(HA/CHH2.5;2), a significant aggregation was observed and the particles did not fully
[image:14.595.67.527.250.562.2]15
redisperse even though the size of the particles remaining in non-aggregated fraction did
395
not change when compared to the PS before lyophilisation (the PS ratio was 1.07±0.05).
396
When 5% w/v TRE was employed, neither the change of the particle size, nor aggregation
397
could be observed, therefore at 5% w/v TRE act as an effective cryoprotectant for
398
HA/CHH2.5;2. Interestingly, when 11% w/v TRE was used in freeze drying, the particle size of
399
HA/CHH2.5;2 became smaller than before lyophilisation (the PS ratio was 0.89±0.02).
400
However, this decrease in the particle size did not occur when the same sugar concentration
401
was used to freeze dry HA/CHH2.5;1. The decrease in PS could be attributed to the
402
compaction of the NP structure (de la Fuente et al., 2008).
403
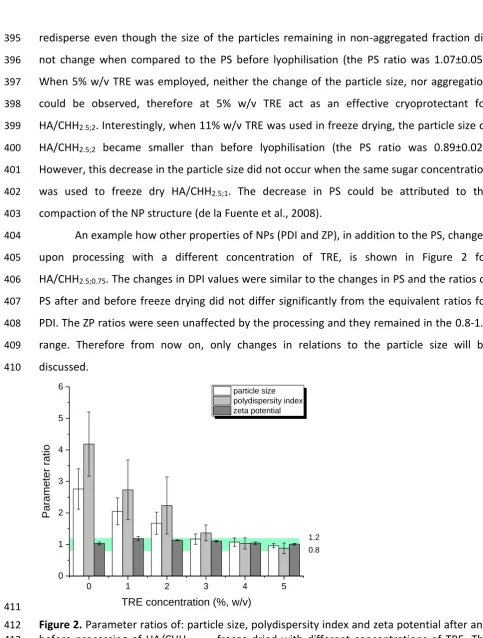
An example how other properties of NPs (PDI and ZP), in addition to the PS, changed
404
upon processing with a different concentration of TRE, is shown in Figure 2 for
405
HA/CHH2.5;0.75. The changes in DPI values were similar to the changes in PS and the ratios of
406
PS after and before freeze drying did not differ significantly from the equivalent ratios for
407
PDI. The ZP ratios were seen unaffected by the processing and they remained in the 0.8-1.2
408
range. Therefore from now on, only changes in relations to the particle size will be
409
discussed.
410
0 1 2 3 4 5
0 1 2 3 4 5 6
Pa
ramet
er
rat
io
TRE concentration (%, w/v)
particle size polydispersity index zeta potential
0.8 1.2
[image:15.595.33.517.42.681.2]411
Figure 2. Parameter ratios of: particle size, polydispersity index and zeta potential after and 412
before processing of HA/CHH2.5;0.75 freeze dried with different concentrations of TRE. The
413
green band indicates the PS ratio between 0.8 and 1.2, considered as very good
414
redispersibility of processed NPs.
16
As shown previously (Umerska et al., 2012), the composition of NPs, especially the
417
MMR of the polymers has a significant influence on their physical (i.e. PS, PDI and ZP) and
418
biological properties. Therefore the next step in this study was to assess how the NP
419
composition affected their redispersibility after freeze drying.
420
HA/CHH NPs with MMRs of 1 (containing more chitosan, positively charged) and 5
421
(containing more HA, negatively charged) were initially freeze dried at TPCs of 1 or 2 mg/ml
422
with 4% w/v TRE and depending on if the powder redispersed, the concentration of TRE was
423
further increased or decreased to determine the lowest concentration at which good
424
redispersibility could be obtained.
425
Figure 1 illustrates the PS ratios before and after freeze drying of positively charged
426
NPs (MMR = 1). When the TPC was 2 mg/ml (HA/CHH1;2), a significant aggregation was
427
observed with 4% w/v TRE, but the PS ratio was satisfactory (0.93±0.06). Therefore the
428
concentration of sugar was further increased and a successful reconstitution without
429
aggregation could be seen at 5, 7 or 11% w/v of this cryoprotectant, with the PS ratios close
430
to 1 for 5 and 7% w/v of TRE and a significant decrease in the particle size after freeze drying
431
when 11% w/v of TRE was employed. On the other hand, the system with a TPC of 1 mg/ml
432
(HA/CHH1;1) successfully reconstituted after freeze drying with 4% w/v TRE, with a low size
433
ratio (1.09±0.06) and no aggregation observed. The redispersibility remained very good
434
even when 1% w/v TRE was used for this system and when the concentration of TRE was
435
further decreased to 0.5% w/v, a moderate aggregation occurred accompanied by an
436
increase in the particle size by 36%. When the concentration of TRE was again decreased to
437
0.2 or 0.1% w/v, a significant aggregation and a 2.3-fold increase in the PS were observed.
438
HA/CHH NPs with the MMR of 5 were satisfactory redispersible at both TPCs (1 and 2
439
mg/ml, systems HA/CHH5;1 and HA/CHH5;2) when 4% w/v TRE was used. No aggregation was
440
observed apart from HA/CHH5;2 freeze dried with 0.1% w/v TRE (Figure 1). HA/CHH5;1 had a
441
very good redispersibility even after lyophilisation with only 0.1% w/v TRE. The properties of
442
HA/CHH5;2 were satisfactorily preserved at TRE concentration down to 0.5% w/v and at TRE
443
0.2% w/v a significant increase in the particle size after the process was observed (the PS
444
ratio was 1.59±0.01). It can therefore be concluded that HA/CHH NPs with the MMR of 5 are
445
characterised by better redispersiblity than NPs with MMRs of 2.5 and 1. This may be
446
explained by a markedly higher content of HA in these systems, supporting the finding of
447
Peer et al. (2003) that HA can assist in efficient lyophilisation. Also, the corona in HA/CHH5
17
NPs is relatively larger than in the HA/CHH2.5 system, the latter being composed
449
predominantly of a dense core (Umerska et al., 2012). As the corona is characterised by a
450
smaller density than the core, it is possible that the molecules of a cryoprotectant penetrate
451
inside the corona in spaces between HA chains, therefore enabling better preservation of
452
particle properties during exposure to stress associated with the freeze drying process.
453
The results of freeze drying of HA/CHH NPs with TRE presented here are in
454
agreement with data obtained by de la Fuente et al. (2008), who did not observe significant
455
changes in the particle size after lyophilisation of HA/CHIT/tripolyphosphate NPs with either
456
5% w/v TRE or 5% w/v glucose. However, it needs to be highlighted that the concentrations
457
of NPs tested by de la Fuente et al. (2008) where lower (0.075-0.5 mg/ml) than those used
458
in this work. Also, no optimisation study on the concentration of cryoprotectant, nor tests
459
on the influence of NP composition on redispersibility were performed. As it is
460
demonstrated here, optimisation of the concentration of cryoprotectant is of vital
461
importance and the NP composition may have a significant influence on redispersibility,
462
with NPs containing higher amount of HA content requiring less TRE for stabilisation. Some
463
NP systems can be successfully redispersed even at the NP to cryoprotectant weight ratio of
464
1:1 (HA/CHH5;1 with 0.1% w/v TRE).
465
It is generally accepted that TRE is a more effective cryo-/lyo-protectant than
466
mannitol (Cegnar et al., 2011; Katas et al., 2013; Rampino et al., 2013). In contrast to
467
mannitol, TRE was an amorphous excipient after the process and yielded the most suitable
468
protective properties (Cegnar et al., 2011). Briefly, stabilisation of materials in sugar glasses
469
has been explained by the formation of a glassy sugar matrix, which acts as a physical
470
barrier between the particles and inhibits the diffusion on a relevant time scale (Allison et
471
al., 2000; Hafner et al., 2011; Molina et al., 2004). Sugar molecules isolate individual
472
particles in the unfrozen fraction, thereby preventing aggregation during freezing (Allison et
473
al., 2000; Rampino et al., 2013). The sugar molecule interact with NPs via hydrogen bonding,
474
maintaining them in the ‘pseudo-hydrated state’ during the dehydration step and replace
475
water, thus providing protection from damage during dehydration and subsequent
476
rehydration (Cegnar et al., 2011; Hirsjärvi et al., 2009; Rampino et al., 2013). Summarising
477
the outcomes of studies on HA/CHH NPs, lower TRE concentrations were needed for
478
formulations with lower NP concentrations in the native dispersions and higher HA/CHH
479
MMRs (more negative ZP) to successfully preserve NP properties post-processing.
18 3.2.3.2. CHON- and PROT-based NPs
481
All HA/PROT NPs tested were successfully redispersed when freeze dried with 4%
482
w/v TRE. The PS ratios after and before freeze drying were not significantly higher than 1.2
483
(Figure 3a) and no aggregation was observed in any of the samples tested. When TRE
484
concentration was decreased to 1% w/v, no aggregation was observed, but a slight increase
485
in the particle size by 27, 34 and 27% was seen for the following samples: HA/PROT2.1;low,
486
HA/PROT6.3;high and HA/PROT3.1;high, respectively. Therefore, even at 1% w/v TRE, acceptable
487
or very good redispersion was observed depending on the composition of the sample for all
488
HA/PROT NPs tested. However, the results show that HA/PROT NPs redisperse better than
489
HA/CHH NPs with an MMR of 2.5 and 1.
490
HA/PROT 6.3;low
sCT
HA/PROT 6.3;low
HA/PROT 3.1;low
HA/PROT 2.1;low
HA/PROT 12.5;high
HA/PROT 6.3;high
HA/PROT 3.1;high
0.0 0.2 0.4 0.6 0.8 1.0 1.2 1.4 1.6
PS
r
atio
1% w/v TRE 4% w/v TRE
0.8 1.2
a) 491
CHON/CHL 5;1 sCT
CHON/CHL 5;1
CHON/CHL 5;2
CHON/CHL 2.5;1
CHON/CHL 2.5;2
CHON/CHL 1;1
CHON/CHL 1;2
0 1 2 3 4 5 6 7 8
PS
r
atio
1% w/v TRE 4% w/v TRE
0.8 1.2
19
CHON/PROT 6.3;low
sCT
CHON/PROT 6.3;low
CHON/PROT 3.1;low
CHON/PROT 2.1;low
CHON/PROT 12.5;high
CHON/PROT 6.3;high
CHON/PROT 3.1;high
0.0 0.2 0.4 0.6 0.8 1.0 1.2 1.4 1.6 1.8
PS
r
atio
1% w/v TRE 4% w/v TRE
0.8 1.2
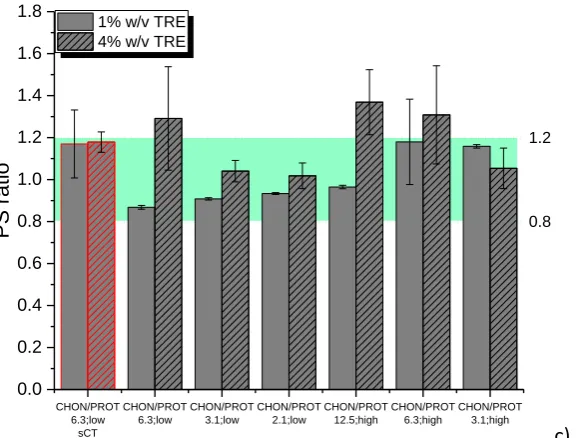
c) 493
Figure 3. The particle size (PS) ratio of: a) HA/PROT NPs, b) CHON/CHL NPs and c) 494
CHON/PROT freeze dried with 1 and 4% w/v of TRE. The green bands indicate the PS ratio
495
between 0.8 and 1.2, considered as very good redispersibility of processed NPs.
496 497 498
The redispersibility of CHON-based NPs was also examined in order to verify, if the
499
polyanion (CHON versus HA) has any influence on reconstitution of NPs. As shown in Figure
500
3b, none of the formulations tested were successfully redispersed after lyophilisation with
501
1% w/v TRE. When the concentration of TRE was increased to 4% w/v, all formulations with
502
the CHON/CHL MMR of 5 as well as CHON/CHL1;1 redispersed with a very good preservation
503
of the particle size. In two formulations with a TPC of 2 mg/ml: CHON/CHL1;2 and
504
CHON/CHL2.5;2, aggregation was observed and the particle size was significantly increased
505
after the process. Freeze dried CHON/CHL2.5;1 satisfactorily redispersed after processing with
506
4% w/v TRE, but an increase in the particle size by 27% was observed.
507
The results obtained for CHON/CHL NPs confirm that the composition of the
508
particles, especially the MMR of the polymers, and their concentration plays an important
509
role affecting the ability of such NPs to be redispersed. Similarly to HA/CHH NPs, CHON/CHL
510
NPs with a MMR of 2.5 were the most problematic in reconstitution studies and CHON/CHL
511
NPs with a MMR of 5 were the easiest to fully reconstitute. Therefore, CHON/CHL NPs were
512
characterised by worse redispersibility compared to HA-based NPs.
513
Finally, CHON/PROT NPs were freeze dried with 1 or 4% w/v TRE, and the results are
514
shown in Figure 3c. Similarly to HA/PROT NPs, no aggregation was observed in any of the
515
samples tested, and all samples satisfactorily redispersed even after processing with 1% w/v
[image:19.595.78.372.72.291.2]20
TRE. In some samples an increase in the particle size by 30% could be observed, but they did
517
not differ significantly (p>0.05) from the PS ratio of 1.2. Interestingly, some of the NPs
518
freeze dried with 4% w/v TRE were significantly (p<0.05) larger than those lyophilised with
519
1% w/v TRE. The CHON /PROT12.5;high system as well as all NPs made using 0.7 mg/ml CHON
520
decreased their size during freeze drying with 1% w/v TRE and the size ratios were smaller
521
than 1. In conclusion, both HA/PROT and CHON/PROT NPs are characterised by very good
522
redispersibility, which is considerably better than most of the chitosan-based formulations.
523
Differences in redispersibility of the NPs can possibly be explained by different
524
properties of the polyelectrolytes used (molecular weight, charge sign, charge strength and
525
charge density) and different NP structures. PROT has the highest charge density, CHON and
526
CHIT have low charge density, while the charge density of HA is very low. Strong
527
polyelectrolyte complexes are generally formed between polymers including anions and
528
cations of strong acids or bases in their structure (Denuziere et al., 1996). In contrast, weak
529
polyelectrolyte complexes are formed between weak acids and bases. CHIT contains
530
primary amine groups that are weak bases and PROT contains guanidinium groups that are
531
strong bases. HA has carboxylic groups (a weak acid), while CHON has both, sulphate (a
532
strong acid) and carboxylic groups. Therefore it is expected that, considering the pairs of
533
polyelectrolytes tested, CHIT forms with HA a weaker PEC than it does with CHON. Weaker
534
binding between HA and CHIT compared with that between CHON and CHIT can influence
535
the pore size and network complexity of particles and facilitate the penetration and
536
interactions with TRE, thereby improving redispersibility of the HA/CHIT PEC NPs. It has
537
been suggested that the PROT-based NPs do not show the core-corona structure (Umerska
538
et al., 2015, 2014b), in contrast to the CHIT-based NPs. If the dense, tightly packed core is
539
not formed in PROT-based NPs, it may facilitate the penetration of TRE into the NP structure
540
and interactions between TRE and NPs. In summary, it can be concluded that the NPs can be
541
ranked in terms of easiness of redispersibility as follows: HA/PROT > CHON/PROT >
542
CHON/CHL and that HA/CHH NPs reconstitute better in comparison to PROT- and
CHON-543
based NPs.
544
3.2.4 Freeze drying of sCT-containing NPs with trehalose 545
Having investigated freeze drying properties of HA/CHH carriers, sCT-loaded NPs
546
were freeze dried in the presence of TRE to study the impact of the peptide presence on
547
reconstitution and also the effect of processing on the peptide. The PS ratios are presented
21
in Figure 1 for HA/CHH5;1sCT and in Figure 3 for PROT- and CHON-based systems. In relation
549
to HA/CHH5;1sCT, although no aggregation was observed when the TRE concentration used
550
was in the range of 0.1-4%, a significant increase in the particle size after lyophilisation was
551
seen when lower concentrations of TRE were used. The particle size increased by 36, 63 and
552
83% when 0.5, 0.2 and 0.1% w/v of the sugar was used in the process, respectively.
553
Therefore the preservation of particle properties was not as good as for the equivalent
554
system with no sCT. Thus, incorporation of sCT decreases the ability of HA/CHH NPs to be
555
successfully redispersed. Nevertheless, it is noteworthy that even after increasing by 83% in
556
size the, particles still remained small with sizes well below 400 nm. No impact of sCT
557
loading was seen for the HA/PROT NPs. In contrast to HA-based NPs, incorporation of sCT
558
into CHON-based NPs (system CHON/CHL5;1sCT) improved their redispersibility compared to
559
the equivalent carrier systems with no peptide loaded (CHON/CHL5;1) (Figure 3). Despite the
560
fact that the sCT presence worsened redispersibility of HA-based NPs and enhanced
561
redispersibility of CHON-based NPs, HA/CHH/sCT NPs can be considered as easier to
562
redisperse than CHON/CHL/sCT NPs, because after freeze drying with 1% w/v TRE their
563
particle size was better maintained.
564
To confirm that no degradation of sCT occurred during the process, separation of
565
non-associated sCT in the reconstituted sample (HA/CHH5;1sCT) by the previously described
566
ultrafiltration-centrifugation technique (Umerska et al., 2014a) was conducted. The amount
567
of peptide extracted from HA/CHH5;1sCT after lyophilisation was 98.90±1.57%, compared to
568
96.80±2.19% for the sample before freeze drying used here as control. The association
569
efficiency (AE) was 98.92±0.28% and 98.94±0.27% before after processing, respectively,
570
indicating no impact of lyophilisation on the integrity of sCT. Also, when trying to maximise
571
the drug loading in the particles, the concentration of a cryoprotectant must be kept as low
572
as possible. The sCT loading in samples (HA/CHH) lyophilised with 0.1, 0.2, 0.5 and 1% w/v
573
TRE would be approximately 20, 14, 7.7 and 4.3% w/w, respectively, which can be
574
considered as high. However, a compromise must be made between the preservation of
575
properties of the particles and the drug loading.
576
In conclusion, the presence of sCT in the studied PEC NPs, with exception of the
577
HA/PROT system, affected the properties of NPs post-processing, but in an inconsistent
578
manner thus, if a cargo molecule is incorporated into PEC NPs it is likely that the optimum
579
cryoprotectant concentration will be different to that used for empty NP carriers.
22 3.2.5. Freeze drying of HA/CHH NPs with PEG polymers
581
Apart from sugars, water soluble polymers could also be used as cryoprotectants.
582
Lee et al. (2009) have shown that 2000 g/mol PEG successfully performed as a
583
cryoprotectant for naproxen nano-suspensions. PEG chains in the crystal lattice are
584
organised as lamellae and the proportion of the crystal form is dictated by the molecular
585
weight of the polymer (Craig, 1995). As a consequence, PEG materials are semicrystalline
586
and may exhibit a significant degree of disorder (Craig, 1995). Therefore, in this part of the
587
study, HA/CHH2.5;1 with variable concentrations of different PEG polymers (2, 4 and 10 kDa
588
linear PEG as well as 10 kDa four-arm branched PEG). HA/CHH2.5;1 was poorly redispersible
589
when lyophilised with TRE (Figure 1).
590
Figure 4a shows the PS ratios after and before freeze drying of the systems with PEG
591
polymers. When 0.5% w/v PEG was used, aggregation was observed during reconstitution,
592
regardless of the type of PEG used. An increase in the polymer concentration to 1% w/v
593
resulted in an acceptable redispersibility of NPs with no aggregation observed and PS ratios
594
between 1.25±0.09 and 1.37±0.08 (for PEG 2 kDa and branched PEG 10 kDa, respectively). A
595
further increase in PEG concentration from 2 to 5% w/v led to very good redispersibility of
596
the systems with an increase in particle size after freeze drying smaller than 20%. Neither
597
the molecular weight nor the structure of PEG molecules (linear versus branched) were
598
found to have an impact on redispersibility of HA/CHH NPs. Also, PEG was found to be a
599
more effective cryoprotectant than TRE, as only 1% w/v PEG was needed to obtain
600
acceptable redispersibility of HA/CHH2.5;1 compared to 3% w/v TRE, where only marginal
601
redispersion was seen. Very good preservation of the size of NPs was achieved at 2% w/v
602
PEG compared to 4% w/v TRE.
23
PEG-L 2 kDa
PEG-L 4 kDa
PEG-L 10 kDa
PEG-B 10 kDa 0.0
0.4 0.8 1.2 1.6 2.0 2.4 2.8 3.2 3.6
PS
r
atio
0.5% w/v polymer 1% w/v polymer 2% w/v polymer 3% w/v polymer 4% w/v polymer 5% w/v polymer
0.8 1.2
a)
604
3:1 w/w PEG/TRE
1:1 w/w PEG/TRE
1:3 w/w PEG/TRE
0.0 0.2 0.4 0.6 0.8 1.0 1.2 1.4
PS
r
atio 0.8
1.2
b)
605
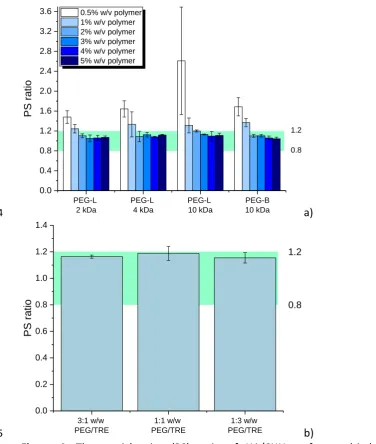
Figure 4. The particle size (PS) ratio of HA/CHH2.5;1 freeze dried with: a) different
606
concentrations of PEG polymers and b) 2% w/v solutions containing different proportions of
607
PEG-L 2 kDa and TRE. The green bands indicate the PS ratio between 0.8 and 1.2, considered
608
as very good redispersibility of processed NPs.
609 610
3.2.6 Freeze drying of HA/CHH NPs with a mixture of trehalose and PEG 611
As PEG was shown to be a more effective cryoprotectant than TRE, attempts were
612
made to decrease the concentration of the sugar required for the successful redispersion of
613
HA/CHH2.5;1 after freeze drying with a mixture of cryoprotectants: TRE and PEG. Also, it was
614
of interest if a combination of these two excipients may have a synergistic effect. As it has
615
been shown that viscosity of aqueous PEG solutions increases proportionally to an
616
increasing molecular weight (Gonzalez-Tello et al., 1994), therefore PEG with the lowest
617
molecular weight (i.e. 2 kDa) was selected for further co-lyophilisation studies with TRE. The
[image:23.595.51.428.66.511.2]24
total concentration of cryoprotectants was kept at 2% w/v, and three combinations were
619
tested: 3:1, 1:1 and 1:3 w/w of PEG/TRE.
620
As shown in Figure 4b, the PS ratio was below 1.2 for all three combinations. More
621
importantly, aggregation was not observed. In relation to the synergistic effect of both
622
cryoprotectans when used in a combination, this was clearly seen for the 1:1 and 1:3 w/w
623
PEG/TRE mixtures, where the measured PS ratios were 1.19±0.05 and 1.155±0.04, while
624
those calculated (theoretical) PS ratio values are 1.42 and 1.57, respectively. Therefore it
625
can be concluded, that addition of PEG enabled to decrease the concentration of TRE
626
required to successfully reconstitute freeze dried HA/CHH2.5;1 and that a synergistic effect of
627
the excipient combination was observed.
628
3.3. Solid state analysis of the freeze dried products 629
3.3.1. Trehalose/NPs systems 630
The NPs (HA/CHH2.5;1) freeze dried without any cryoprotectant were PXRD
631
amorphous (Figure 5) and no clear thermal events, with exception of a shallow peak of
632
thermal decomposition after 200 °C, were observed in the DSC scans (Figure 6a).
633
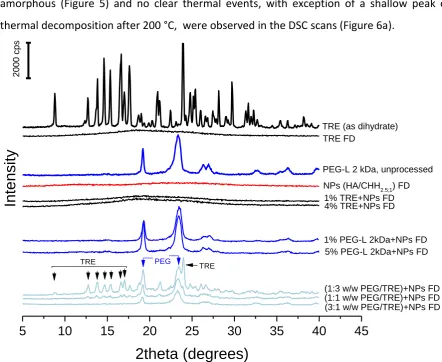
5 10 15 20 25 30 35 40 45
TRE
PEG
(3:1 w/w PEG/TRE)+NPs FD (1:1 w/w PEG/TRE)+NPs FD (1:3 w/w PEG/TRE)+NPs FD 5% PEG-L 2kDa+NPs FD 1% PEG-L 2kDa+NPs FD 4% TRE+NPs FD 1% TRE+NPs FD NPs (HA/CHH2.5;1) FD PEG-L 2 kDa, unprocessed TRE FD
2theta (degrees)
TRE (as dihydrate)
TRE
2000 c
ps
Intensity
634
Figure 5. Powder X-ray diffractograms of (from top to bottom): unprocessed TRE as 635
trehalose dihydrate, freeze dried TRE (TRE FD), unprocessed PEG-L 2 kDa, freeze dried
[image:24.595.72.515.362.724.2]25
HA/CHH2.5;1 (referred to as NPs), NPs freeze dried in 1% w/v TRE (1% TRE+NPs FD), NPs
637
freeze dried in 4% w/v TRE (4% TRE+NPs FD), NPs freeze dried in 1% w/v PEG-L 2 kDa (1%
638
PEG-L 2kDa+NPs FD), NPs freeze dried in 5% w/v PEG-L 2 kDa (5% PEG-L 2kDa+NPs FD), NPs
639
freeze dried in 2% w/v solution of 1:3 w/w PEG-L 2 kDa/TRE mixture ((1:3 w/w PEG/TRE)
640
+NPs FD), NPs freeze dried in 2% w/v solution of 1:1 w/w PEG-L 2 kDa/TRE mixture ((1:1
641
w/w PEG/TRE) +NPs FD), NPs freeze dried in 2% w/v solution of 3:1 w/w PEG-L 2 kDa/TRE
642
mixture ((3:1 w/w PEG/TRE) +NPs FD). Arrows indicate characteristic diffraction peaks of
643
trehalose dihydrate and PEG-L 2 kDa.
644 645
50 100 150 200 250 300
50 100 150 200 250 300
(FD TRE+ FD NPs) PM 4% w/w TRE+NPs FD
Temperature (oC)
^ exo
Tg
dehydration melting
TRE FD
TRE (as dihydrate)
NPs (HA/CHH2.5;1) FD
10
mW
decomposition
1
m
W
a) 646
50 100 150 200 250 300
PEG-L 2 kDa FD
^ exo
Temperature (oC)
decomposition
2 mW
(FD PEG-L 2kDa+ FD NPs) PM 2% w/w PEG-L 2kDa+NPs FD PEG-L 2 kDa, unprocessed
26
50 100 150 200 250 300
Temperature (oC)
(FD PEG FD TRE+FD NPs) PM
^ exo
melting crystallisation
Tg
decomposition
2 mW
(3:1 w/w PEG/TRE)+NPs FD
(1:1 w/w PEG/TRE)+NPs FD (1:3 w/w PEG/TRE)+NPs FD
c) 648
Figure 6. Differential calorimetry thermograms of: a) unprocessed TRE as trehalose 649
dihydrate, freeze dried TRE (TRE FD), freeze dried HA/CHH2.5;1 (referred to as NPs), NPs
650
freeze dried in 4% w/v TRE (4% w/w TRE+NPs FD) and a physical mixture of TRE and NPs
651
freeze dried separately ((FD TRE+ FD NPs) PM); b) unprocessed PEG-L 2 kDa, freeze dried
652
PEG-L 2 kDa (PEG-L 2 kDa FD), NPs freeze dried in 2% w/v PEG-L 2 kDa (2% w/w PEG-L
653
2kDa+NPs FD) and a physical mixture of PEG-L 2 kDa and NPs freeze dried separately ((FD
654
PEG-L 2kDa+ FD NPs) PM); c) NPs freeze dried in 2% w/v solution of 3:1 w/w PEG-L 2
655
kDa/TRE mixture ((3:1 w/w PEG/TRE)+NPs FD), NPs freeze dried in 2% w/v solution of 1:1
656
w/w PEG-L 2 kDa/TRE mixture ((1:1 w/w PEG/TRE)+NPs FD), NPs freeze dried in 2% w/v
657
solution of 1:3 w/w PEG-L 2 kDa/TRE mixture and a physical mixture of TRE ((1:3 w/w
658
PEG/TRE)+NPs FD), PEG-L 2 kDa and NPs freeze dried separately ((FD PEG FD TRE+FD NPs)
659
PM).
660 661
PXRD studies showed that initially crystalline, unprocessed trehalose dihydrate
662
became amorphous after lyophilisation of its aqueous solution (Figure 5). It can be seen that
663
the presence of NPs did not affect the solid state properties of freeze dried TRE. As shown in
664
Figure 6a dehydration of trehalose dihydrate starting material powder occurs at 97.7 °C and
665
the anhydrous crystals melt at 211.5 °C, consistent with temperatures of 97 and 210 °C,
666
respectively, reported by Ohtake et al. (2011). The thermogram of lyophilised TRE (Figure
667
6a) had a glass transition (Tg) of 119.3 °C, in agreement with the Tgof 110-120 °C recorded
668
by Ohtake et al. (2011). After freeze drying HA/CHH2.5;1 with TRE, the Tg with a similar
669
midpoint (120.5 °C) was observed, confirming that the sugar was amorphous (Figure 6a). No
670
crystallisation exotherm was recorded, showing that the presence of NPs did not destabilise
[image:26.595.89.411.78.334.2]