64
Comparison of Representations of Named Entities for Multi-label
Document Classification with Convolutional Neural Networks
Lidia Pivovarova and Roman Yangarber
University of Helsinki, Finland Department of Computer Science
Abstract
We explore representations for multi-token names in the context of the Reuters topic and sector classification tasks (RCV1). We find that: the best way to treat names is to split them into tokens and use each token as a separate feature; NEs have more impact on sector classifica-tion than on topic classificaclassifica-tion; replacing all NEs with special entity-type tokens is not an effective strategy; representing to-kens by different embeddings for proper names vs. common nouns does not im-prove results. We highlight the imim-prove- improve-ments over state-of-the-art results that our CNN models yield.
1 Introduction
This paper addresses large-scale multi-class text classification tasks: categorizing articles in the Reuters news corpus (RCV1) according to topic and to industry sectors. A topic is a broad news category, e.g., “Economics,” “Sport,” “Health.” A sector defines a narrower business area, e.g., “Banking,” “Telecommunications,” “Insurance.”
We use convolutional neural networks (CNNs), which take word embeddings as input. Typically word embeddings are built by treating a corpus as a sequence of tokens, where named entities (NEs) receive no special treatment. Yet NEs may be im-portant features in some classification tasks: com-panies, e.g., are often linked to particular industry sectors, and certain industries are linked to loca-tions. Thus company and location names may be important features for sector classification.
RCV1 is much smaller than corpora typically used to build word embeddings. Thus we utilize external resources—a corpus of approximately 10 million business news articles, collected using the
PULS news monitoring system (Pivovarova et al., 2013). While nominally RCV1 contains gen-eralnews, it is skewed toward business; many of the topic labels are business-related (“Markets”, “Commodities”, “Share Capital,” etc.). Thus, we expect our business corpus to help in learning fea-tures for the Reuters classification tasks.
We compare several NE representation to find the most suitable name features for each task. We use the PULS NER system (Grishman et al.,2003; Huttunen et al., 2002a,b) to find NEs and their types—company, location, person, etc. We com-pare various representations of NEs, by building embeddings, and training CNNs to find the best representation. We also compare building embed-dings on the RCV1 corpus vs. using much larger external corpora.
2 Data and Prior Work
RCV1 (Lewis et al., 2004) is a corpus of about 800K Reuters articles from 1996–1997 with man-ually assignedsectorandtopiclabels. Both clas-sifications are multi-label—each document may have zero or more labels. While all documents have topic labels, only 350K have sector labels.
While RCV1 appears frequently in published research, few authors tackle the full-scale classi-fication problem. Typically they use subsets of the data: (Daniely et al.,2017;Duchi et al.,2011) use only the four most general topic labels; (Dredze et al.,2008) use 6 sector categories to explore bi-nary classification, (Daniels and Metaxas,2017) use a subset of 6K articles. Even when the entire dataset is used, the training-text split varies across papers, because the “original” split (Lewis et al., 2004) is impractical for most purposes: 23K in-stances for training, and 780K for testing.
A US appeals Court revived a civil suit accusing Apple of creating a monopoly
text representation
[image:2.595.76.527.64.228.2]with word embeddings with multiple filter widthsfirst convolutional layer feature maps second convolutional layerwith multiple filter widths feature maps max-pooling with dropout and sigmoid fully-connected layer output
Figure 1: Architecture of the convolutional neural networks
used to evaluate classifier performance. The most common measures for multi-class classification are macro- and micro-averaged F-measure, which we use in this paper. However, others use other metrics. For example, (Liu et al.,2017) use pre-cision and cumulative gain at top K—measures adopted from information retrieval. This is not comparable with other work, because these met-rics are used not only to report results, but also to optimize the algorithms during training. The notion of the best classifier differs depending on which evaluation measure is used. Thus, although RCV1 is frequently used, we find few papers di-rectly comparable to our research, in the sense that they use theentireRCV1 dataset and report micro-and macro-averaged F-measure.
To the best of our knowledge, our previous work (Du et al., 2015) was the only study of the utility of NEs for RCV1 classification. We demon-strated that using a combination of keyword-based and NE-based classifiers works better than either classifier alone. In that paper we applied a rule-based approach for NEs, and did not use NEs as features for machine learning.
3 Model
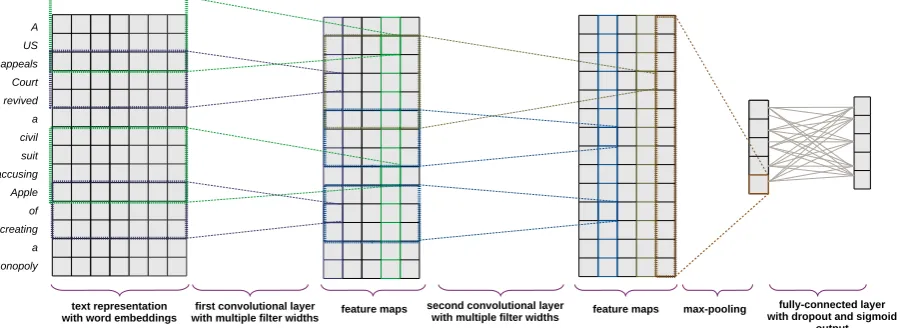
The architecture of our CNN is shown in Figure1. The inputs are fed into the network as zero-padded text fragments of fixed size, with each word repre-sented by a fixed-dimensional embedding vector. The inputs are fed into a layer of convolutional fil-ters with multiple widths, optionally followed by deeper convolutional layers. The results of the last convolutional layer are max-pooled, producing a
vector with one scalar per filter. This is fed into a fully-connected layer with dropout regularization, with one sigmoid node in the output layer for each of the class labels. For each class label, a cross-entropy loss is computed. Losses are averaged across labels, and the gradient of the loss is back-propagated to update the weights. This is similar to the model (Kim,2014) used for sentiment anal-ysis. The key differences are that our model uses an arbitrary number of convolutions, and that we use sigmoid rather than softmax on output, since the labels are not mutually exclusive.
To train the model we used a random split: 80% of the data used for training, 10% development set, and 10% test set. The development set is used to determine when to stop training, and to tune a set of optimal thresholds{θi}for each labeli—if the output probabilitypi is higher thanθi, the la-bel is assigned to the instance, otherwise it is not. To find the optimal threshold, we optimize the F-measure for each label. The test set is used to ob-tain the final, reported performance scores.
Our focus is this paper is data representation, thus we defer the tuning of hyper-parameters for future work. All experiments use the same net-work structure: 3 convolution layers with filter sizes {3,7,11}, {3,7,11}, and {3,11}, with 512, 256 and 256 filters of each size, respectively. The runs differ only in theinput embeddingsthey use.
4 Data Representation
corpora are relatively small, so the data are sparse and not sufficient to build embeddings from sur-face forms. We tune the embeddings while train-ing the CNN, updattrain-ing them at each iteration.
We explore severalname representations, using our NER system:
• type: each entity is represented by a spe-cial token denoting its type—company, C-person, C-location, etc, and C-name if the type is not determined. The model learns one embedding for each of these tokens.
• name: each name gets its own embedding; multi-word names treated asa single token.
• split-name: multi-word names are split into tokens, and each token has its own embed-ding; the motivation is that some company names may contain informative parts—e.g., Air Baltic, Delta Airlines—which may indi-cate that these companies operate in the same field; these name parts may be more useful than the name as a whole.
• split-name+common: similar to the above, but tokens inside names and in common con-text are distinguished; the motivation is that some words may be used in names with-out any relation to the company’s line of business—e.g.,Apple, Blackberry—and their usage inside names should not be mixed with their usage as common nouns.
In the experiments, we build GloVe embeddings from two corpora: RCV1 only, and RCV1 plus our external corpus. For comparison, we also use 200-dimensional embeddings trained on a 6 bil-lion general corpus (glove-6B), provided by the GloVe project.0 This corresponds to our split-namerepresentation mode.
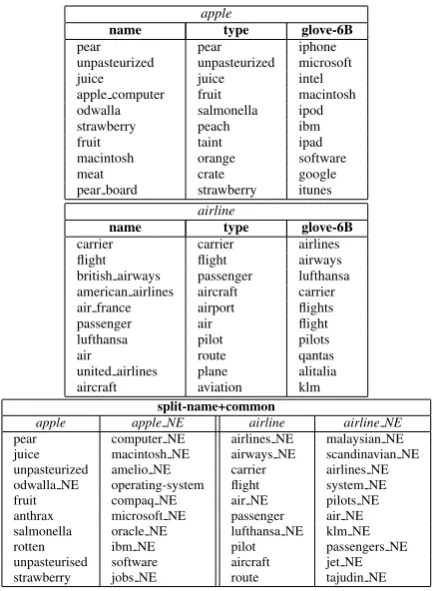
To illustrate the effect of the different token representations, Table 1 shows ten words near-est to the sample lemmas: apple and airline. When name representation is used, the token
apple is ambiguous, its nearest neighbors are both fruit words (pear) and computer words ( ap-ple computer). Intyperepresentation, the “com-puter” meaning disappears, since all mentions of
Apple as company are represented by the special tokenC-company. When usingglove-6B, the fruit meaning is absent, and all neighbors are computer-related words. The tokenairlinedoes not exhibit such ambiguity, and all representations produce similar nearest neighbors.
0https://nlp.stanford.edu/projects/glove/
apple
name type glove-6B pear pear iphone unpasteurized unpasteurized microsoft juice juice intel apple computer fruit macintosh odwalla salmonella ipod strawberry peach ibm fruit taint ipad macintosh orange software meat crate google pear board strawberry itunes
airline
name type glove-6B carrier carrier airlines flight flight airways british airways passenger lufthansa american airlines aircraft carrier air france airport flights passenger air flight lufthansa pilot pilots air route qantas united airlines plane alitalia aircraft aviation klm
split-name+common
apple apple NE airline airline NE
[image:3.595.308.526.60.356.2]pear computer NE airlines NE malaysian NE juice macintosh NE airways NE scandinavian NE unpasteurized amelio NE carrier airlines NE odwalla NE operating-system flight system NE fruit compaq NE air NE pilots NE anthrax microsoft NE passenger air NE salmonella oracle NE lufthansa NE klm NE rotten ibm NE pilot passengers NE unpasteurised software aircraft jet NE strawberry jobs NE route tajudin NE
Table 1: Nearest neighbors for sample words using various word representations.
In the split-name+common representation mode, each lemma may produce two vectors, one for a common noun and one for a proper noun (inside a name). As the table shows, apple as a common noun has a clear “fruit” meaning; the one company appearing among the neighbors is a juice producer,Odwalla. The nearest neighbors for ap-ple NE, in name context, include IT companies. The tokens airline and airline NE have no clear semantic distinction, with similar nearest neigh-bors. In such cases there is no clear advantage in using two embeddings rather than one.
We test all of the above name representations experimentally, to determine which is more useful in the document classification tasks.
5 Results and Discussion
Algorithm (prior) M-F1 µ-F1
SVM (Lewis et al.,2004) 29.7 51.3 SVM (Zhuang et al.,2005) 30.1 52.0 Naive Bayes (Puurula,2012) — 70.5 Bloom Filters (Cisse et al.,2013) 47.8 72.4
SVM + NEs (Du et al.,2015) 57.7 63.8 RCV1 embeddings
CNN type 32.2 58.4
CNN name 61.0 80.2
CNN split-name 63.6 82.0
CNN split-name+common 44.3 68.3
RCV1 + external corpus
CNN type 47.7 72.6
CNN name 55.2 78.4
CNN split-name 60.7 80.3
CNN split-name+common 38.0 66.0
[image:4.595.74.290.61.254.2]CNN split-name (Glove-6B) 55.7 78.4
Table 2: Sector classification results on RCV1.
training instances, which is not sufficient for learn-ing word embeddlearn-ings.
Compared to the reported state-of-the-art results on Sector Classification (Table2), our best model yields a 10% gain inµ-F1, (Cisse et al.,2013), and a 6% gain in M-F1 (Du et al.,2015). The bestµ-F1 and M-F1 results are obtained by the same model.1
On Topic Classification (Table 3), our µ-F1 re-sults show a modest improvement of 0.5% in F-measure—or a 3.5% (averaged) error reduction— over state of the art (Johnson and Zhang,2015).2
As seen in Table 2, the best data representa-tion for Sector Classificarepresenta-tion, issplit-name, where each token has the same embedding regardless whether it is used in a proper-name or a common-noun context. The worst performing name repre-sentation istype, where names are mapped to spe-cial “concepts” (C-company, C-person etc.), and each concept has its own embedding. This in-dicates the importance of the tokens inside the named entities for Sector Classification, and sup-ports the notion that company names mentioned in text correlate with sector labels.
Results for Topic Classification are in Table 3. The best data representation is again split-name, though the difference between representations is less pronounced than in the case of Sector Classi-fication, and usingtypedoes not lead to a signif-icant drop in model performance. This suggests that proper names are less important for Topic
1In prior work, state of the art was achieved by different
models.
2Interestingly, the best result for M-F1 on Topics is still
in prior work: i.e., these prior models perform better onvery infrequenttopics. This is to be explored in future work.
Algorithm (prior) M-F1 µ-F1
SVM (Lewis et al.,2004) 61.9 81.6
ANN (Nam et al.,2014) 69.2 85.3
CNN (Johnson and Zhang,2015) 67.1 85.7
RCV1 embeddings
CNN type 65.5 85.5
CNN name 66.7 86.2
CNN split-name 66.5 86.2
CNN split-name+common 66.6 86.2
RCV1 + external corpus
CNN type 64.9 85.6
CNN name 66.4 86.2
CNN split-name 65.7 85.9
CNN split-name+common 65.6 85.8
CNN split-name (Glove-6B) 65.8 85.8
Table 3: Topic classification results on RCV1.
(event) classification, and supports the intuition that entity names (e.g., companies) are less corre-lated with the types of events in which the entities participate in business news. However, there may be correlations between industry sectors and top-ics/events: e.g., mining or petroleum companies rarely launch new products. This may explain why thesplit-namerepresentation appears to be better for Topic Classification. One possible next step is to build CNNs that jointly model Topics and Sec-tors; we plan to explore this in future work.
Surprisingly, using external corpora did not im-prove the models’ performance, as indicated by both Sector and Topic results (Tables2and3, re-spectively). This may mean that the genre and the time period of the news corpus are more relevant for building embeddings than the size of the cor-pora. However, other factors may contribute as well, e.g., our hyper-parameter combination may not be optimal for these embeddings. Neverthe-less, the results follow the same pattern: the best name representation issplit-nameand the differ-ence between representations is more pronounced for Sector than for Topic classification.
[image:4.595.308.525.61.233.2]References
Moustapha M. Cisse, Nicolas Usunier, Thierry Arti, and Patrick Gallinari. 2013. Robust Bloom filters for large multilabel classification tasks. InAdvances
in Neural Information Processing Systems, pages
1851–1859.
Zachary Alan Daniels and Dimitris N Metaxas. 2017. Addressing imbalance in multi-label classification using structured hellinger forests. In AAAI, pages 1826–1832.
Amit Daniely, Nevena Lazic, Yoram Singer, and Kunal Talwar. 2017. Short and deep: Sketching and neural networks.
Mark Dredze, Koby Crammer, and Fernando Pereira. 2008. Confidence-weighted linear classification. In Proceedings of the 25th International Conference on
Machine Learning, ICML ’08, pages 264–271, New
York, NY, USA. ACM.
Mian Du, Matthew Pierce, Lidia Pivovarova, and Ro-man Yangarber. 2015. Improving supervised clas-sification using information extraction. In Interna-tional Conference on Applications of Natural Lan-guage to Information Systems, pages 3–18. Springer.
John Duchi, Elad Hazan, and Yoram Singer. 2011. Adaptive subgradient methods for online learning and stochastic optimization. J. Mach. Learn. Res., 12:2121–2159.
Ralph Grishman, Silja Huttunen, and Roman Yangar-ber. 2003. Information extraction for enhanced ac-cess to disease outbreak reports.Journal of Biomed-ical Informatics,35(4):236–246.
Silja Huttunen, Roman Yangarber, and Ralph Grish-man. 2002a. Complexity of event structure in IE scenarios. InProceedings of the19thInternational Conference on Computational Linguistics (COLING 2002), Taipei.
Silja Huttunen, Roman Yangarber, and Ralph Grish-man. 2002b. Diversity of scenarios in information extraction. InProceedings of the Third International Conference on Language Resources and Evaluation
(LREC 2002), Las Palmas de Gran Canaria, Spain.
Rie Johnson and Tong Zhang. 2015. Semi-supervised convolutional neural networks for text categoriza-tion via region embedding. InAdvances in neural information processing systems, pages 919–927.
Yoon Kim. 2014. Convolutional neural networks for sentence classification. InProceedings of the Con-ference on Empirical Methods in Natural Language
Processing (EMNLP).
David D. Lewis, Yiming Yang, Tony G. Rose, and Fan Li. 2004. RCV1: A new benchmark collection for text categorization research. The Journal of
Ma-chine Learning Research, 5:361–397.
Jingzhou Liu, Wei-Cheng Chang, Yuexin Wu, and Yiming Yang. 2017. Deep learning for extreme multi-label text classification. InProceedings of the 40th International ACM SIGIR Conference on
Re-search and Development in Information Retrieval,
pages 115–124. ACM.
Jinseok Nam, Jungi Kim, Eneldo Loza Menc´ıa, Iryna Gurevych, and Johannes F¨urnkranz. 2014. Large-scale multi-label text classification—revisiting neu-ral networks. In Joint european conference on machine learning and knowledge discovery in databases, pages 437–452. Springer.
Jeffrey Pennington, Richard Socher, and Christo-pher D. Manning. 2014. GloVe: Global vectors for word representation. InEmpirical Methods in
Nat-ural Language Processing (EMNLP), pages 1532–
1543.
Lidia Pivovarova, Silja Huttunen, and Roman Yangar-ber. 2013. Event representation across genre. In
Proceedins of the 1st Workshop on Events:
Defi-nition, Detection, Coreference, and Representation, NAACL HLT.
Antti Puurula. 2012. Scalable text classification with sparse generative modeling. In Patricia Anthony, Mitsuru Ishizuka, and Dickson Lukose, editors, PRI-CAI 2012: Trends in Artificial Intelligence, volume 7458 ofLecture Notes in Computer Science, pages 458–469. Springer Berlin Heidelberg.
Dong Zhuang, Benyu Zhang, Qiang Yang, Jun Yan, Zheng Chen, and Ying Chen. 2005. Efficient text classification by weighted proximal SVM. InFifth