ISSN Online: 2160-5920 ISSN Print: 2160-5912
DOI: 10.4236/iim.2017.96012 Nov. 1, 2017 229 Intelligent Information Management
Predicting Optimal Trading Actions Using a
Genetic Algorithm and Ensemble Method
Kazuma Kuroda
Data Marketing Laboratory, Tokyo, Japan
Abstract
Machine learning has been applied to the foreign exchange market for algo-rithmic trading. However, the selection of trading algorithms is a difficult problem. In this work, an approach that combines trading agents is designed. In the proposed approach, an artificial neural network is used to predict the optimum actions of each agent for USD/JPY currency pairs. The agents are trained using a genetic algorithm and are then combined using an ensemble method. We compare the performance of the combined agent to the average performance of many agents. Simulation results show that the total return is better when the combined agent is used.
Keywords
Artificial Intelligence, Ensemble Learning, Genetic Algorithms, Neural Networks, FOREX
1. Introduction
The Foreign Exchange Market (FOREX) has become complex due to the intro-duction of floating exchange rates and the expansion of global trading markets. Due to this complexity, predicting future prices and designing trading algo-rithms have been considered as challenging problems. Recently, researchers have started to design trading algorithms.
Artificial neural networks (ANN) are often used in prediction tasks and sys-tem modeling. ANNs use nonlinear functions; thus, they are robust in complex and dynamic environments such as the FOREX [1] [2]. Generally, ANNs are trained using the back-propagation algorithm. However, the back-propagation algorithm may become stuck in a local minimum. Therefore, previous studies
[3] [4] have used genetic algorithms (GA) to avoid this problem because such
How to cite this paper: Kuroda, K. (2017) Predicting Optimal Trading Actions Using a Genetic Algorithm and Ensemble Me-thod. Intelligent Information Management, 9, 229-235.
https://doi.org/10.4236/iim.2017.96012 Received: September 23, 2017
Accepted: October 29, 2017 Published: November 1, 2017 Copyright © 2017 by author and Scientific Research Publishing Inc. This work is licensed under the Creative Commons Attribution International License (CC BY 4.0).
DOI: 10.4236/iim.2017.96012 230 Intelligent Information Management algorithms can search global optimum solutions.
GAs are heuristic algorithms based on Darwinian evolution and are frequently used to find optimum solutions. In the case of a trading algorithm, GAs have been used to determine the optimum trading model parameters, such as the connection weights of the ANN, feature selection, and the settlement width (dif-ference between the closing price of the position and the price at the time of set-tlement) [5][6]. In this context, a GA can provide a variety of agents with dif-ferent trading strategies.
Here, the problem lies with the selection of the agent. Although the best agent with training data is obtained, the results are often incorrect with test data. A previous study [3] demonstrated that the average performance of different agents outperformed the best agent in the training data. However, from an asset efficiency perspective, this approach is impractical because it must hold many trading positions.
Ensemble methods combine the outputs of base models using a majority vote mechanism to create a single output [7]. Many studies have demonstrated that ensemble methods show superior performance for a variety of problems, such as image classification [8] and facial recognition [9].
In this study, we employed an ensemble method to combine trading agents. In the proposed method, we begin by constructing multiple agents. Here, an ANN and conditional equations are used in the agents’ decision mechanisms. A GA is used to train the connection weights of the networks, the period used to calcu-late technical indicators, and the settlement width. Next, we combine the output of the trained agents using a majority vote mechanism. We performed tests to determine whether the combined agent outperforms the average performance of many agents.
The remainder of this paper is organized as follows. A detailed description of the algorithm used to predict optimum trading actions is given in Section 2, and Section 3 discusses the performance of the proposed approach. Conclusions are given in Section 4.
2. Algorithm to Predict Optimum Actions
The procedure to obtain the combined agent is divided into two steps. The first step is construction of the base models, and the second step is combining the outputs of the base models. In this section, we describe these processes in detail.
2.1. Construction of Base Models
DOI: 10.4236/iim.2017.96012 231 Intelligent Information Management
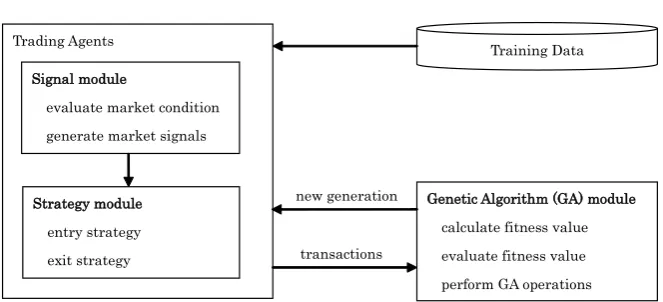
Figure 1.Architecture to train trading agents.
according to the trading action of the agent and evolves the agents using this fit-ness value.
1) Signal Module
The ANN is used to evaluate market conditions and generate the market sig-nal, and the network comprises four input neurons. The inputs to these neurons are three technical indicators and bias. The networks contain six hidden units, where the activation function of all hidden units is a sigmoid function. The out-put neurons of the networks consist of three, each neurons corresponding to the market signal. The GA optimizes the connection weights from the input layer to the output layer.
The following three technical indicators, which are calculated from the price data, are used as input to the networks. In addition, the GA optimizes the period used to calculate the technical indicators. The relative strength indicator (RSI) is used to determine when the market is over-bought or over-sold [10] and is given by the following equation:
(
)
RSI=100− 100 1+RS ,
where RS is the average gain over n hours divided by the average loss over n hours. The average directional index (ADX) describes when a market is trending without considering trend direction [11]. Note that an increasing ADX value represents the trend strength. To quantify the trend strength, we use diffADX, which is given by the following equation:
1 diffADXt =ADXt−ADXt− ,
where diffADXt is the trend strength for time step t and ADXt is the ADX for time step t. The directional movement index comprises two lines, i.e., plus direc-tional movement (DM+) and minus direcdirec-tional movement (DM−), and defines the trend direction [11]. DM+ represents an upward trend direction, and DM− represents a downward trend direction. For simplicity, we use uniDMI, which is given as follows:
uniDMIt=DM+ −t DM−t,
where uniDMIt is the trend direction for time step t, DM+t is the DM+ for time
Training Data Trading Agents
Signal module
evaluate market condition generate market signals
Strategy module entry strategy exit strategy
Genetic Algorithm (GA) module calculate fitness value evaluate fitness value perform GA operations transactions
DOI: 10.4236/iim.2017.96012 232 Intelligent Information Management step t, and DM−t is the DM− for time step t.
2) Strategy Module
The strategy module determines the trading action according to the following rules. Note that the trading action of time step t is determined by the data point of time step t − 1. If an agent does not hold a trading position, then the agent takes a position according to the market signal. If an agent holds a long position, then the trading action is determined using the following rules:
1
Close-Out=currentHigh>positionClose+ω ×Volatility;
2
currentLow<positionClose−ω ×Volatility;
The market signal is Short
Do-Nothing=otherwise
where current High and current Low are the high and low prices among the data points, respectively, position Close is the closing price of the position, and Vola-tility is the standard deviation of the closing price over the last seven hours. ω1 and ω2 are parameters used to optimize the settlement width. If an agent holds a short position, then the trading action is determined using the following rules:
3
Close-Out=currentLow<positionClose−ω ×Volatility;
4
currentHigh>positionClose+ω ×Volatility;
The market signal is Long
Do-Nothing=otherwise
where ω3 and ω4 are parameters used to optimize the settlement width. 3) Genetic Algorithm
The GA evaluates the fitness and evolves the trading agents according to the fitness value. Here, the fitness is the total return calculated using raw prices. As mentioned previously, the GA evolves the connection weights of the ANN, the period used to calculate technical indicators, and the settlement width. The evo-lutionary process is as follows.
1) Randomly initialize a population of agents.
2) Provide training data to each agent and obtain the trading action for each time step.
3) Trade according to the trading action and observe the returns of each time step.
4) Calculate the fitness from the returns of each time step at the end of the training data.
5) Evaluate each agent in the population according to their fitness and select parents for new agents.
6) Create new agents based on the selected parents using crossover and muta-tion operators.
DOI: 10.4236/iim.2017.96012 233 Intelligent Information Management
2.2. Combined Base Models
The outputs of the trained agents are combined by majority vote to create a sin-gle output. For each time step, the trained agents generate trading actions on the new data point and the closing price of the position as input. Then, the most frequently output trading actions are taken as the output of the combined agent.
3. Experiment and Results
In this section, we apply the proposed ensemble approach to USD/JPY currency pairs to test whether the combined agent outperforms the average performance of many agents. Here, the return is JPY-based. The training algorithm was run 500 times on the training data, and the resulting best agents for each generation were added to the agent pool. We used a population with 500 individuals over 500 generations. Then, to address the overtraining problem, the result obtained by applying validation data to the agent in the agent pool was used to select the generation to be tested. We obtained 500 agents as a result. Those agents were then used to compare the performance of the combined agent and the average of the agents on the test data.
3.1. Data Collection
The agents were trained, validated, and tested using USD/JPY hourly data. Each data point included the opening and closing price and the high and low price for each hour interval. The original training data consisted of 30115 samples for the period 03/01/2010 9:00 pm to 31/12/2014 9:00 pm. Training was performed with the training data, which was the original training data inverted and added [12]. The validation data comprised 6097 samples for the period 01/01/2015 9:00 pm to 31/12/2015 10:00 pm. The test data comprised 9263 samples for the period 04/01/2016 12:00 am to 01/07/2017 1:00 am.
3.2. Results
The results of training and validation for each generation are shown in Figure 2. As can be seen, a peak was reached near 200 generations for both the training and validation data. In addition, the results were stable after 200 generations. After 200 generations, the best generation was generation 437 on the validation data, and this generation was chosen for testing.
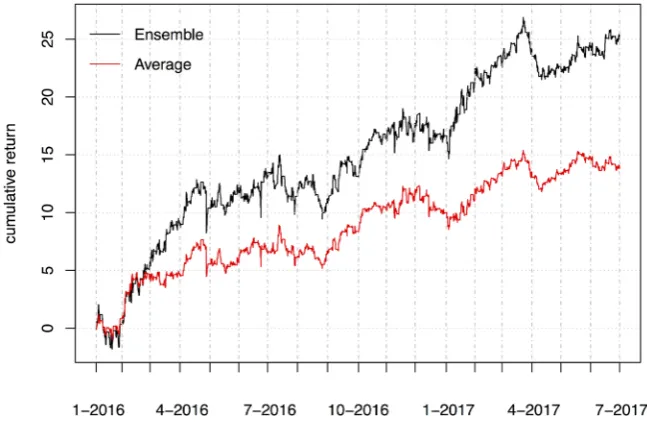
The statistics of the tested agents are summarized in Table 1, and the cumula-tive returns are shown in Figure 3. In Table 1, the Total Return column is the sum of all returns of agents, the Win rate column is the percentage of transac-tions with positive returns, and the Trades column is the number of closed posi-tions. The results show that the performance of the ensemble approach is supe-rior to the approach using the average performance of many agents.
4. Conclusion
DOI: 10.4236/iim.2017.96012 234 Intelligent Information Management
Figure 2.Mean value of the best models in the population on the training and validation
[image:6.595.210.534.315.527.2]data per year.
Figure 3.Comparison of cumulative return between the combined agent (Ensemble) and
the average of agents (Average).
Table 1.Statistics of tested agents (Ensemble: results of combined agents; Average: mean
value of tested agents).
Total return Win rate Trades Ensemble 25.0 54.7% 2331
Average 13.8 54.1% 1880
[image:6.595.206.539.606.657.2]DOI: 10.4236/iim.2017.96012 235 Intelligent Information Management whether the combined agent outperforms the average performance of many agents. The results show that the total return is better when the ensemble me-thod is used. In addition, the ensemble approach takes only a single position; thus, it is more asset efficient than approaches that use the average performance of many agents. In conclusion, the proposed ensemble approach works as an al-ternative to using the average performance of many agents.
References
[1] Kamruzzaman, J. and Sarker, R. (2004) ANN-Based Forecasting of Foreign Cur-rency Exchange Rates. Neural Information Processing, 3, 49-58.
[2] Vincenzo, P., Vitoantonio, B. and Michele, A. (2011) An Artificial Neural Network Model to Forecast Exchange Rates. Journal of Intelligent Learning Systems and Ap-plications, 3, 57-69. https://doi.org/10.4236/jilsa.2011.32008
[3] Yaman, A., Stephen, L. and Izidor, G. (2014) Evolutionary Algorithm Based Ap-proach for Modeling Autonomously Trading Agents. Intelligent Information Man-agement, 6, 45-54. https://doi.org/10.4236/iim.2014.62007
[4] Kenneth, O.S. and Risto, M. (2004) Competitive Coevolution through Evolutionary Complexification. Journal of Artificial Intelligence Research, 21, 63-100.
[5] Hirabayashi, A., Claus, A. and Iba, H. (2009) Optimization of the Trading Rule in Foreign Exchange Using Genetic Algorithm. GECCO ‘09 Proceedings of the 11th Annual Conference on Genetic and Evolutionary Computation, Montreal, 8-12 July 2009, 1529-1536. https://doi.org/10.1145/1569901.1570106
[6] Ibrahim, A.E.M. (2014) Evolutionary Approach to Forex Expert Advisor Genera-tion. Intelligent Information Management, 6, 129-141.
https://doi.org/10.4236/iim.2014.63014
[7] Witten, I. and Frank, E. (2005) Data Mining: Practical Machine Learning Tools and Techniques. 2nd Edition, Morgan Kaufmann, San Francisco.
[8] Silwattananusarn, T., Kanarkard, W. and Tuamsuk, K. (2016) Enhanced Classifica-tion Accuracy for Cardiotocogram Data with Ensemble Feature SelecClassifica-tion and Clas-sifier Ensemble. Journal of Computer and Communications, 4, 20-35.
https://doi.org/10.4236/jcc.2016.44003
[9] El Khiyari, H. and Wechsler, H. (2016) Face Recognition across Time Lapse Using Convolutional Neural Networks. Journal of Information Security, 7, 141-151.
https://doi.org/10.4236/jis.2016.73010
[10] Murphy, Jr. J.E. (1994) Stock Market Probability: Using Statistics to Predict and Optimize Investment Outcomes. Revised Edition, Irwin.
[11] Sheimo, M.D. (1998) Cashing in on the Dow: Using Dow Theory to Trade and De-termine Trends in Today’s Markets. CRC Press, Boca Raton.