www.wjpr.net Vol 7, Issue 13, 2018. 896
DEVELOPMENT AND VALIDATION OF LC-MS/MS METHOD FOR
THE SIMULTANEOUS DETERMINATION OF ΒETA-SITOSTEROL,
THYMOL AND OLEANOLIC ACID IN
LEUCAS ASPERA
LINN
Prashant Hande1*, Ajitkumarbs1, Shailendra Rane2, Manish Hate2 and Jalil K. Shaikh3
1
Department of Gnird, Gurunanak Khalsa College, Matunga, Mumbai-400019, India.
2
Department of Chemistry, Ruia College, Matunga, Mumbai-400019, India.
3
Department of Ard, United State Pharmacopia, Hydrabad-500101, India.
ABSTRACT
A simple, precise and accurate LC-MS/MS method has been developed
for simultaneous determination of beta-sitosterol, thymol and oleanolic
acid in whole plant powder of Leucas aspera linn. MRM (Multiple
Reaction Monitoring) transitions 397.20>161.20, 151.10>109.10 and
455.40>455.55 were optimized on Shimadzu triple quadrupole mass
spectrometer instrument (Model: LCMS-8040) for quantification of
beta-sitosterol, thymol and oleanolic acid respectively.
Chromatographic method was developed on a Shimadzu shimpack-XR
C8 column (100mm x 2.0mm x 2µ) using gradient program. The
proposed method was validated for linearity, accuracy, precision, and
recovery, limit of detection (LOD) and limit of quantitation (LOQ). The validated
LC-MS/MS method can be used for a routine quality control analysis and simultaneous
quantitation of beta-sitosterol, thymol and oleanolic acid in Leucas aspera linn.
KEYWORDS: LC-MS/MS, Beta-sitosterol, Thymol, Oleanolic acid, Leucas aspera linn.,
Validation.
INTRODUCTION
Drugs used in medicine today are either obtained from nature or are of synthetic origin.
Natural drugs, obtained from plants and animals are called drugs of „biological origin‟ and
are produced in the living calls of plants or animals (Agrawal, and Paridhavi, 2007). Herbal
medicines are used for primary health care of humans with negligible side effects. Hence,
Volume 7, Issue 13, 896-904. Research Article ISSN 2277–7105
Article Received on 16 May 2018,
Revised on 05 June 2018, Accepted on 26 June 2018
DOI: 10.20959/wjpr201813-12813
*Corresponding Author Prashant Hande
Department of Gnird,
Gurunanak Khalsa College,
Matunga, Mumbai-400019,
www.wjpr.net Vol 7, Issue 13, 2018. 897
more usage and interest is due to promising activity and efficacy shown by many herbal
preparations in numerous clinical situations (Schuppan et.al., 1955). Although the traditional
remedies are advantageous, they have some limitations which include the lack of
standardization of raw materials and final products with non existence of criterion for quality
control. Now a day‟s new approaches for quality assessment cannot fulfill the requirements
of safety and efficacy of herbal medicines.(Chopra et.al., 1956; Ghosal et.al.,1973; Guha
et.al., 1996). Standardization of herbal preparations is based on phytochemical investigation
of one or more constituents as either active or marker compounds. Hence with the aid of
modern scientific methodology and techniques, the standardization of herbal constituents can
be carried out systematically and specifically which is the aim of this research work
(Agrawal, and Paridhavi, 2007). Recently the hyphenation of HPLC with tandem mass
spectrometry LC-MS/MS is widely used because of its better selectivity and sensitivity
(Montoro et.al., 2004; Sun et.al., 2005). Identification, separation and quantification of
bio-markers in complex samples can be performed in less time as well as reduced sample
preparation as compared to other analytical techniques. In this context, electrospray
ionizations (ESI) is soft ionization method and ESI-MS/MS has been shown to be a powerful
method for identification of variety of plants compounds(Rabaneda et.al,. 2003; Tolonen
et.al,. 2003).
Leucas aspera (wild) linn.(family-lamiceae) commonly called as „thumbai‟(Schuppan et.al,.
1955).It is found almost throughout India but majority in south part. In south, herbs are
available in the garden as well as near temples (Shome and Mehrotra, 1990). In leucas aspera
Linn., all parts of the plant possess useful therapeutic applications viz. anti-inflammatory,
antifungal, antioxidant, anti-insecticidal, and cytotoxic activities (Prajapati et.al,. 2010) and is
prescribed for the treatment of cobra venom poisoning(Mangathayaru et.al,. 2006). Many
reference reveal that the presence of triterpenoids in entire plants and nicotine contains arial
parts of leucas aspera Linn. (Kamat et.al,. 1994). whole plant reported to contain
beta-sitosterol(Jian et.al,. 1968; Mitra et.al,. 1992; Rai et.al, 2005), eugenol, citral, citronell,
linalool, thymol(Jian et.al,. 1968), oleanolic acid ursolic acid (Chaudhury et.al,. 1969).
Presence of alkaloids in leucas aspera linn. are more significant from the chemotaxonomic
point of view. Beta sitosterol, thymol and oleanolic acid are all belongs to the secondary
metabolites which are bio active phyto compounds(Ali et.al,. 2007). Beta-sitosterol, thymol
and oleanolic acid are reported to help in curing the cholesterol absorption,
www.wjpr.net Vol 7, Issue 13, 2018. 898
1992; Best et.al,. 1956), antimutagenic effect (Mezzoug et.al,. 2007), antitumor(Andersen,.
2006).
According to the literature survey no method has been developed for simultaneous estimation
of these three bio-markers by LC-MS/MS. Hence, the principle of the study was to develop a
simple, economic, rapid, precise standardized and validated method for simultaneous
quantitative estimation of beta-sitosterol, thymol and oleanolic acid from the herbs and herbal
formulation.
MATERIALS AND METHODS
Plant material and sample preparation
Whole plant material was collected from Kerala district and herbarium of leucas aspera linn.
was prepared and authenticated from MS university (Vadodara). The plants collected were
washed under running tap water. The plant kept for drying in oven at temperature 40±2⁰C.
The dried plant material was used for further studies. 250 mg of whole plant material of
leucas aspera linn. was extracted with 10 mL of methanol. The mixture was vortexed for 5
min and put for overnight extraction. Extract was filtered through 0.2micron syringe filter
and then subjected to LC-MS/MS analysis.
Chemicals and standard solutions Preparation
All the chemicals used in the experiments were of LCMS grade. Standard beta-sitosterol
(98.0% purity), standard thymol (98.0% purity) and standard oleanolic acid (98.0% purity)
were procured from sigma Aldrich chemie (steinheim Germany). The stock solutions of beta-
sitosterol, thymol and oleanolic acid (1mg/mL) were prepared separately in methanol. From
this individual stocks, mix working stock solution containing 10ug/mL of each standards
were prepared in methanol. This working stock solution was used for preparation of different
calibration standards.
Instrumentation and Chromatographic Conditions
Chromatographic development was performed on Shimadzu Nexera, UHPLC (Ultra High
Performance Liquid Chromatograph) system with LC-30AD pumps, SIL-30A autosampler
and CTO-20AC as column oven. LABsolutions software (version 5.80) was used for
operating the instrument. Shimadzu LCMS-8040 model (Triple Quadrupole Mass
Spectrometer) was used for optimization of MRM transitions for beta-sitosterol, thymol and
www.wjpr.net Vol 7, Issue 13, 2018. 899
Analysis was performed on shimadzu, shimapack-XR, C8 column (100mm x2.0mm, 2.2 μm).
The mobile phase comprising of A: 0.1% formic acid and B: methanol was filtered through a
0.2 μm membrane filter (Millipore) and degassed by sonication. Gradient method was
[image:4.595.151.442.313.455.2]developed for chromatographic separation which is given in table1.
Table 1.
Time % Mobile phase A % Mobile phase B
0.00 55 65
2.00 20. 95
6.00 20 95
6.00 55 65
8.00 STOP STOP
RESULTS AND DISCUSSION
0.0 1.0 2.0 3.0 4.0 5.0 6.0 7.0 min
0.0 1.0 2.0 3.0 4.0 5.0 6.0 (x10,000)
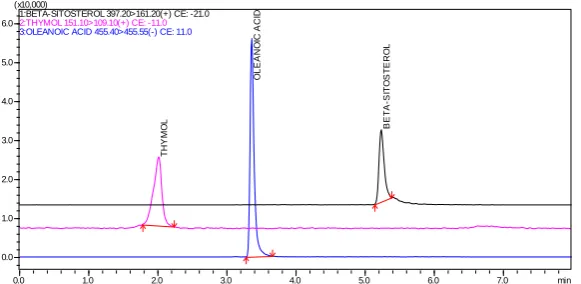
3:OLEANOIC ACID 455.40>455.55(-) CE: 11.0 2:THYMOL 151.10>109.10(+) CE: -11.0 1:BETA-SITOSTEROL 397.20>161.20(+) CE: -21.0
O L E A NO IC A CI D T HY M O
L BET
A -S IT O S T E RO L
Figure1. Overlay mass chromatograms of beta-sitosterol, thymol and oleanolic acid
standard mixture.
1.0 2.0 3.0 4.0 5.0 6.0 7.0
0.00 0.25 0.50 0.75 1.00 1.25 1.50 (x1,000) 3:455.40>455.55(-)
0.0 1.0 2.0 3.0 4.0 5.0 6.0 7.0
-0.25 0.00 0.25 0.50 0.75 1.00 1.25
1.50(x1,000)1:397.20>161.20(+)
B E T A -S IT O S T E RO L
www.wjpr.net Vol 7, Issue 13, 2018. 900
0.0 1.0 2.0 3.0 4.0 5.0 6.0 7.0
0.0 0.5 1.0 1.5 2.0 2.5 3.0(x100,000)1:397.20>161.20(+)
B E T A -S IT O S T E RO L
0 250 500 750 Conc.
0.0 0.5 1.0 1.5 2.0 2.5 Area(x1,000,000)
1 2 3 4 5 6
7
8
9
[image:5.595.84.511.76.234.2]Beta-sitosterol_1000 ng mL-1 Linearity_ (1-1000 ng mL-1)
Figure 2: Beta-sitosterol mass chromatograms and linearity graph.
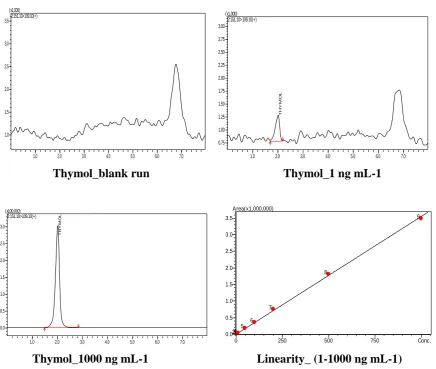
1.0 2.0 3.0 4.0 5.0 6.0 7.0
1.0 1.5 2.0 2.5 3.0 3.5 (x1,000) 2:151.10>109.10(+)
1.0 2.0 3.0 4.0 5.0 6.0 7.0
0.75 1.00 1.25 1.50 1.75 2.00 2.25 2.50 2.75 3.00 (x1,000) 2:151.10>109.10(+) T HY M O L
Thymol_blank run Thymol_1 ng mL-1
1.0 2.0 3.0 4.0 5.0 6.0 7.0
0.0 0.5 1.0 1.5 2.0 2.5 3.0 (x100,000) 2:151.10>109.10(+) T HY M O L
0 250 500 750 Conc.
0.0 0.5 1.0 1.5 2.0 2.5 3.0 3.5 Area(x1,000,000)
2 3 4 5 6
7
8
9
Thymol_1000 ng mL-1 Linearity_ (1-1000 ng mL-1)
[image:5.595.80.517.270.639.2]www.wjpr.net Vol 7, Issue 13, 2018. 901
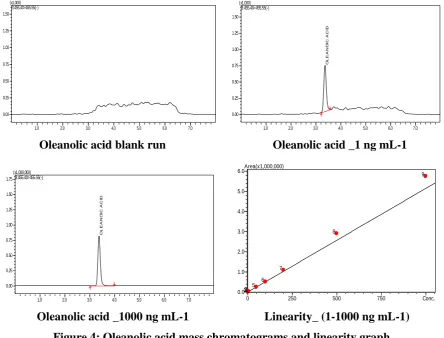
1.0 2.0 3.0 4.0 5.0 6.0 7.0
0.00 0.25 0.50 0.75 1.00 1.25 1.50 (x1,000) 3:455.40>455.55(-)
1.0 2.0 3.0 4.0 5.0 6.0 7.0
0.00 0.25 0.50 0.75 1.00 1.25 1.50 (x1,000) 3:455.40>455.55(-) O L E A NO IC A CI D
Oleanolic acid blank run Oleanolic acid _1 ng mL-1
1.0 2.0 3.0 4.0 5.0 6.0 7.0
0.00 0.25 0.50 0.75 1.00 1.25 1.50 1.75 (x1,000,000) 3:455.40>455.55(-) O L E A NO IC A CI D
0 250 500 750 Conc.
0.0 1.0 2.0 3.0 4.0 5.0 6.0Area(x1,000,000)
1 2 3 5 6
7
8
9
[image:6.595.74.519.75.413.2]Oleanolic acid _1000 ng mL-1 Linearity_ (1-1000 ng mL-1)
Figure 4: Oleanolic acid mass chromatograms and linearity graph.
0.0 1.0 2.0 3.0 4.0 5.0 6.0 7.0 min
0.00 0.25 0.50 0.75 1.00 1.25(x100,000)
3:OLEANOIC ACID 455.40>455.55(-) CE: 11.0 2:THYMOL 151.10>109.10(+) CE: -11.0
1:BETA-SITOSTEROL 397.20>161.20(+) CE: -21.0
O L E A NO IC A CI D B E T A -S IT O S T E RO L
Figure 5: Plant extracts chromatograms.
Method validation summary
Limit of Detection (LOD) and Limits of Quantitation (LOQ)
The signal-to-noise ratio of 3:1 and 10:1 was used to establish LOD and LOQ, respectively.
The LOD and LOQ of beta-sitosterol was 0.3 ng mL-1 and 1.0 ng mL-1, thymol was 1.0 ng
[image:6.595.135.453.446.610.2]www.wjpr.net Vol 7, Issue 13, 2018. 902 Linearity
A good linearity was achieved in the concentration ranges of 1 ng mL-1 to 1000 ng mL-1 for
beta-sitosterol, thymol and oleanolic acid. The regression equations and correlation
coefficient for the reference were y= 2672.97x-336.406, R2 = 0.9952 for beta-sitosterol and y
= 3497.87x+835.334, R2 = 0.9985 for thymol and y = 5146.21x+230.593, R2 = 0.9914 for
oleanolic acid.
The experiment was performed three times and the mean was used for the calculations. The
data was analyzed by linear regression least squares fitting. The statistical data obtained is
given in Table 2.
Table 2.
Parameters Beta-sitosterol Thymol Oleanolic acid
Linearity range[ng mL-1] 1ng mL-1-1000 ng mL-1
Slope [m]1 2672.97 3497.87 5146.21
Intercept [c]1 -336.406 835.334 230.593
Correlation Coefficient [R2] 0.995 0.998 0.991
LOD [ng mL-1] 0.3 1 0.1
LOQ [ng mL-1] 1 3 0.3
Intraday precision(n=5 COV) 0.81 0.77 0.63
Interday precision (n=5 COV) 0.48 0.59 0.75
1
of the equation y = mx + c, where y is peak area, m is the slope, x is the concentration, and c
is the intercept.
Recovery
Three replicates at 50 ng mL-1, 100 ng mL-1, and 200 ng mL-1 concentration for the
beta-sitosterol, thymol and oleanolic acid were prepared for recovery determination. The mean
recovery for beta-sitosterol, thymol and oleanolic acid were 70%, 101% and 89%
respectively.
Assay
The developed HPLC method was used for simultaneous determination of beta-sitosterol,
thymol and oleanolic acid from whole plant powder of leucas aspera linn. The sample
working solution (10 μL) was injected and the area of both beta-sitosterol, thymol and
oleanolic acid peak was measured. From the calibration curve, the amount of beta-sitosterol,
www.wjpr.net Vol 7, Issue 13, 2018. 903
time of beta- sitosterol, thymol and oleanolic acid in sample solution was 5.28, 2.02 and
3.383 respectively.
The mean assay value of beta- sitosterol was found to be 1.580 ug per 250 mg of plant
powder with % RSD as 1.136 and mean assay value of oleanolic acid was found to be 0.427
ug per 250 mg of plant powder with % RSD as 1.458. Thymol was found to be below
detection level in plant extract.
Precision and Accuracy
The intra-day and inter-day precision was used to study the variability of the method. The %
RSD for intra-day and inter-day precision for beta-sitosterol were 0.81 and 0.48%,
respectively, Thymol were 0.77 and 0.59% respectively and oleanolic acid were 0.63 and
0.75% respectively.
CONCLUSION
The application of a simple, rapid and accurate LC-MS/MS method for the simultaneous
quantitation of beta- sitosterol, thymol and oleanolic acid in whole plant powder of Leucas
aspera linn. The method was validated to track the active principles in the complex mixture
of herbal ingredients. The method could be extended for the marker-based standardization of
other herbal product containing beta- sitosterol, thymol and oleanolic acid.
The method was found to be simple, precise, accurate, specific and sensitive and can be used
for routine quality control of herbal raw materials and for the quantification of these
compounds in plant materials.
ACHKNOWLEGMENT: Special thanks to Shimadzu Analytical (India) Pvt. Ltd. for
providing their facility to complete the work.
REFERENCES
1. Agrawal S.s., Paridhavi M., 2007, Herbal drug technology ISBN: 8173715793.
2. Ali M.S., Shameel S., Ahmad V.U., Usmanghani K., 2007. chemical constituents of
caesalpinnia bonduc. Pakistan journal of scientific and industrial Reasearch, 40: 20-22.
3. Andersen, A 2006. Final report on the safety assessment of sodium chloro-m-cresol,
p-chloro-m-cresol, chlorothymol, mixed cresols, m-cresol, o-cresol, p-cresol, isopropyl
cresols, thymol, o-cymen-5-ol, and carvacrol". International journal of toxicology, 25
www.wjpr.net Vol 7, Issue 13, 2018. 904
4. Becker M, Staab D, Von Bergmann K, 1992. Long-term treatment of severe familial
hypercholesterolemia in children. Effect of sitosterol and bezatibrate. Pediatrics, 89:
138-142.
5. Best MM, Duncan CH,1956.Modification of abnormal serum lipid patterns in
atherosclerosis by adminitrstion of sitosterol. Ann international Med, 45: 614-622.
6. Chaudhury NA, ghosh D. 1969 insecticidal plants; chemical examination of leucas
aspera. JIndian chem. Soc.
7. Chopra RN, Nayar SL, Chopra IC.1956 Glossary of Indian medicinar plants, CSIR, New
Delhi, India, 237.
8. Ghosal S, Sharma PV, Chaudhary RK, Bhattacharya SK. 1973. J. Pharma. Sci, 62: 926.
9. Guha S, Sharma PV, Chattopadhyay U. 1996.chemotherapy, 42: 443.
10.JianM.P., NathB. 1968. “Examination of the component fatty acids of the oil from the
seeds of Leucas aspera Spreng.”Labdev J Sci Technol; 6A: 34-36
11.Kamat M, Singh TP. 1994. preliminary chemical examination of some compounds in
different parts of genus leucas Geobios.
12.Mangathayaru K, Thurumurugam D Patel, Pratap PS, David DV and Karthikeyan DJ,
2006. Isolation and Identification of nicotine from Leucas aspera, Indian J. Pharmaceu.
Sci, 68(1): 88-90.
13.Mitra T.N, Singh R.S, Pandey H.S, Singh S.1992. “Long – chain compounds from Leucas
aspera.”Phytochemistry, 31: 1809-1810.
14.Montoro P, Piacente S, Oleszek W, Pizza C.J, 2004. Mass. Spectrom, 39: 1131.
15.Prajapati MS, Patel JB, Modi K, and Shah MB, 2010. Leucas aspera: A review
Pharmacogn. Rev, 4(7): 85-87.
16.Rabaneda FS, Jauegui O, Casals I, Lacueva CA, Pulido ML, Raventos RLM. 2003.
J.Mass Specrom, 38: 35.
17.RaiV, AgrawalM, AgnihotriAK, KhatoonS, Rawat AKS, Mehrotra S, 2005.
“Pharmacognostical evaluation of Leucas aspera Link.” Nat Prod Sci, 11: 109-115.
18.Schuppan D, Jia, Brinkhaus J.D., Hahn E.G 1955., Hepatology, 30: 1099.
19.Shome U, MehrotraS 1990.Pharmacognostic studies on Dronapushpi Ethnobotany, 2:
105-115.
20.Sun Y, Li W, Fitzliff JF, Breeman RB, 2005; j.Mass Specrom, 40: 373.