[417]
417
©IJRASET: All Rights are ReservedOptimization of Wire-EDM Process Parameters on
Machining Die Steel DC53 using Taguchi – GRA
Methodology
Saurabh1, Suresh Kumar2, Deepak Sharma3
1
M.Tech. Scholar, (Machine Design), Mech. Engg. Deptt., CBS Group of Institutions, Jhajjar, Haryana, India
2
Asstt. Professor, Mech. and Auto. Deptt., Northern India Engineering College, Shastri Park, New Delhi, India
3
HOD, Mech. Engg. Deptt., CBS Group of Institutions, Jhajjar, Haryana, India
Abstract: This research paper represents the parametric optimization of Wire Electrical Discharge Machining (WEDM) on machining die steel DC53. For problem formulation of this research work, literature survey has been carried out. The objective of the present work was to investigate the effects of the various WEDM process parameters using Taguchi and Grey Relation Analysis (GRA) on the machining quality and to obtain the optimal sets of process parameters so that the quality of machined parts can be optimized. The machining parameters selected for optimization in present research are Pulse On time, Pulse Off time and Wire Feed. A series of nine experiments were conducted using Wire EDM. The Analysis of Variance (ANOVA) was employed to analyze the influence of these parameters on Material Removal Rate (MRR) and Surface Roughness during machining process. The influences of different process parameters on die steel DC53 were compared. Confirmation experiments were performed for finding the validation of results and a good agreement is found between the predicted and experimental results. The results showed that the input parameters setting of Pulse on time at 100 µs, pulse off time at 40 µs and wire feed at 6 mm/min have given the best results for simultaneous optimization of Material Removal Rate and Surface Roughness.
Keywords: WEDM, Optimization, Die Steel DC53, Taguchi, GRA, ANOVA, Pulse On time, Pulse Off time, Wire Feed, MRR, Surface Roughness
I. INTRODUCTION
[image:1.612.211.404.585.718.2]Wire Electric Discharge Machining (WEDM) is an unconventional process of material removal from electrically conductive materials to produce parts with intricate shapes and profiles (Fig. 1). This process is done by using a series of spark erosion. These sparks are produced between the work piece and a wire electrode (usually less than 0.30 mm diameter) separated by a dielectric fluid and erodes the work piece to produce complex shapes according to a numerically controlled pre-programmed path. The sparks produce heating and melt work piece surface to form debris which is then flushed away by dielectric pressure. During the cutting process there is no direct contact between the work piece and the wire electrode. Wire Electrical Discharge Machining (WEDM) has become an important non-traditional machining process because it can be used on materials like titanium alloys and zirconium which cannot be machined by conventional machining processes. The development of new advanced engineering materials, need to meet demand for precise and flexible prototype and low-volume production of components have made wire electrical discharge machining an important manufacturing process.
[418]
418
©IJRASET: All Rights are ReservedThe basic mechanism of metal removal in WEDM is identical to conventional EDM. Instead of moving electrode (as in EDM), the electrode in this process is a moving wire of copper or brass. A vertically oriented wire is fed into the work piece which is continuously travelling from a supply spool to a take up spool. For this purpose a hole is pre-drilled in the work piece, through which the wire electrode will pass. A constant gap between tool and work piece is maintained with the help of computer controlled positioning system. This process gives a high degree of accuracy and a good surface finish. In addition, the WEDM process is able to machine exotic and high strength and temperature resistant materials and eliminates the geometrical changes occurring in the machining of heat-treated steels.
II. LITERATURE REVIEW
Over the years researchers have used various approaches to improve the performance characteristics of WEDM process. Lee and Li
[2] presented a study on the surface integrity of tungsten carbide composite machined on sinking EDM. They reported that, the surface roughness is a function of two main parameters namely peak current and pulse duration. Tosun [3] studied cutting performance parameters like surface roughness and cutting speed using brass wire of 0.25 mm diameter and AISI 4140 steel as the tool and work material respectively. The variation of performance parameters was modeled using regression analysis method. Chiang and Chang [4] employed grey relational analysis to optimize the WEDM parameters for Al2O3 particle reinforced material
with two performance characteristics namely material removal rate and surface roughness.
Kanlayasiri and Boonmung [5] investigated machining of DC53 die steel by varying the process parameters to investigate their effects on surface roughness. Esme et.al [6] Presented factorial design and neural network (NN) techniques for modeling and predicting the surface roughness of AISI 4340 steel. Mathematical relation between the surface roughness and WEDM cutting parameters were established by regression analysis method. Kumar et.al [7] demonstrated optimization of WEDM process
parameters of Incoloy800 super alloy with multiple performance characteristics such as Material Removal Rate (MRR), surface
roughness and kerf based on the Grey-Taguchi Method. Pasam [8] studied WEDM of Ti6Al4V. The behavior of input parameters on surface finish was studied using Taguchi parameter design. To establish relationship between control parameters and surface finish as a process response, regression analysis was used. Rao et.al [9] considered WEDM of Al-24345 for their study.
Taguchi’s L18 orthogonal array was used in experimentation. Multiple linear regression models have been developed for relating the process and machining performances. The response of MRR and surface roughness was considered for improving the machining efficiency. Kumar et.al [10] reported an investigation on WEDM of pure titanium (grade-2). An attempt has been made to model the response variable i.e. surface roughness in WEDM process using response surface methodology.
Kumar and Singh [11] studied WEDM of Skd 61 alloy. Experimentation was completed using Taguchi’s L18 orthogonal array under different parametric conditions. The results obtained were analyzed for selection of an optimal combination of WEDM parameters to achieve better surface finish. Dharmender et.al [12] studied the effect of different process parameters on surface roughness using Brass wire and En31Tool Steel as the tool and work material respectively. Taguchi’s L9 orthogonal array was chosen for experimentation in their study.
Rajyalakshmi and Ramaiah [13] carried out an experimental investigation on the influence of cutting parameters of WEDM during the machining of Inconel825. The response of surface roughness is considered for improving the machining efficiency. Yadav et.al
[14] studied the effect of WEDM parameters on AISI D3 steel. They reported that, there is decrease in surface roughness with increase in wire feed rate and for a fixed value of pulse on time, gap voltage should be higher for better surface finish. Singh et.al
[15] performed experiments on die steel DC53 using two different wires, namely cryogenically treated zinc coated diffused brass wire and the other a plain brass wire. Input parameters such as pulse duration, pulse interval and wire feed rate were chosen.
III. EXPERIMENTAL PROCESS
The objective of this research is to optimize the different process parameters by using Taguchi and Grey relation analysis. This optimization will result to maximization of metal removal rate and minimization of surface roughness. Taguchi technique was used to obtain single response optimization and Grey Relational Analysis was used for multi response optimization.
A. Machine Tool
[419]
419
©IJRASET: All Rights are ReservedTable 1. Specification of WEDM Machine
1.
Design Fixed Column, Moving Table2.
Table size 440 x 650 mm3.
Max. work piece height 200 mm4.
Max. work piece weight 500 kg5.
Main table traverse (X, Y) 300, 400 mm6.
Auxiliary table traverse (u, v) 80, 80 mm7.
Max. taper cutting angle ±20°/50 mm8.
Max. wire spool capacity 6 kg9.
Wire electrode diameter 0.15, 0.20,0.25 mm10.
Control Mode Open-loop, Step motor drive11.
Interpolation Linear & Circular12.
Least command input (X, Y, u, v) 0.0005mm13.
Input Power supply 3 phase, AC 380 V, 50 Hz14.
Average power consumption 6 to 7 KVA15.
Dielectric Deionised waterFig. 2. Pictorial View of WEDM Machine
B. Work Piece Material
[420]
420
©IJRASET: All Rights are ReservedTable 2. Chemical Composition of Die Steel DC53 Constituent
C Si Mn Cr P S Mo V %age Composition
0.90-1.10 0.80-1.20 ≤0.40 7.50-8.50 ≤0.03 ≤0.03 1.80-2.20 0.20-0.50
Fig. 3. Picture of Work Piece
[image:4.612.34.583.65.423.2]C. Parameters Considered
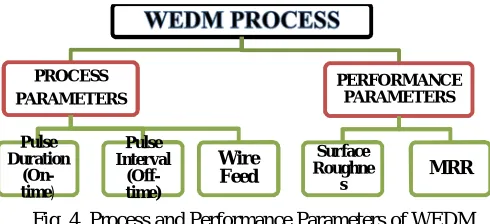
[image:4.612.184.429.320.432.2]Figure 4 shows the process and performance parameters considered for the present study.
Fig. 4. Process and Performance Parameters of WEDM
The range of input process parameters are indicated in Table 3. The fixed process parameters are presented in Table 4. Table 3. Range of Input Process Parameters
Sr. No. Process Parameters Symbols Used Units Range Used 1. Pulse On Time Ton s 100-120
2. Pulse Off Time Toff s 40-60
[image:4.612.33.580.491.723.2]3. Wire Feed Rate WF m/min 4-8 Table 4. Fixed Process Parameters
S. No. Process Parameters Value 1. Work material Die steel DC53 2. Cutting tool Brass wire of diameter 0.15 mm 3. Servo Feed 2050 unit
4. Peak current 150 A 5. Flushing Pressure 1 unit (15 kg/cm) 6. Peak Voltage 2 units (110 volt DC) 7. Dielectric Fluid De-ionised Water 8. Conductivity of Dielectric 20 mho 9. Work Piece Height 16 mm
PROCESS PARAMETERS
Pulse Duration
(On-time)
Pulse Interval
(Off-time)
Wire Feed
PERFORMANCE PARAMETERS
Surface Roughne
s
[421]
421
©IJRASET: All Rights are ReservedD. Experimental Data
The experimental work is carried out using Taguchi methodology. Taguchi’s L9 orthogonal array was chosen for the design of experiments. ‘MINITAB-16’ was used to create the experimental design. The experimental design according to Taguchi methodology along with the response data is shown in Table 5.
Table 5. Experimental Design according to Taguchi with Response Data
Factor1 Factor2 Factor 3 Response 1 Response 2 Run A:Pulse on Time (Ton) B:Pulse off Time (Toff)
C:Wire Feed Rate
[image:5.612.43.575.154.404.2](WF) MRR Surface Roughness µs µs mm/min mm3/min µm 1. 100 40 4 3.869 1.01 2. 100 50 6 4.760 1.09 3. 100 60 8 5.671 1.56 4. 110 40 6 6.199 1.25 5. 110 50 8 2.675 1.09 6. 110 60 4 8.564 1.95 7. 120 40 8 3.468 1.25 8. 120 50 4 4.986 1.43 9. 120 60 6 9.243 2.25 Figure 5 shows the specimen cut out from the work piece using different settings.
Fig. 5. Actual Picture of Specimen
IV. RESULT ANALYSIS
After conducting experiments with different values of input process parameters, the values of performance parameters were recorded and plotted. The analysis of the results obtained has been performed according to the standard procedure recommended by Taguchi.
A. Single response optimization
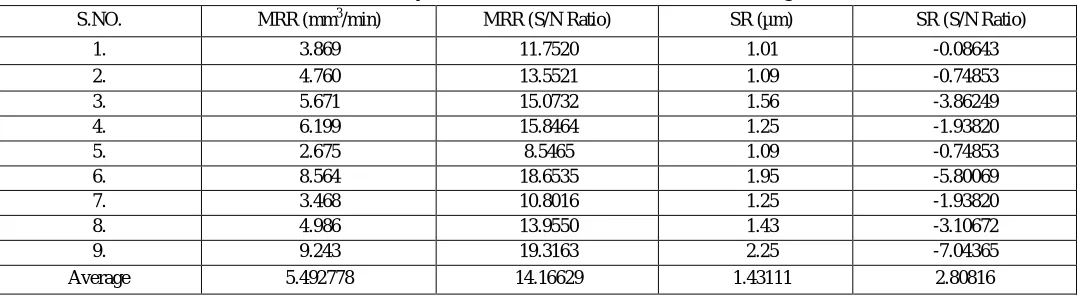
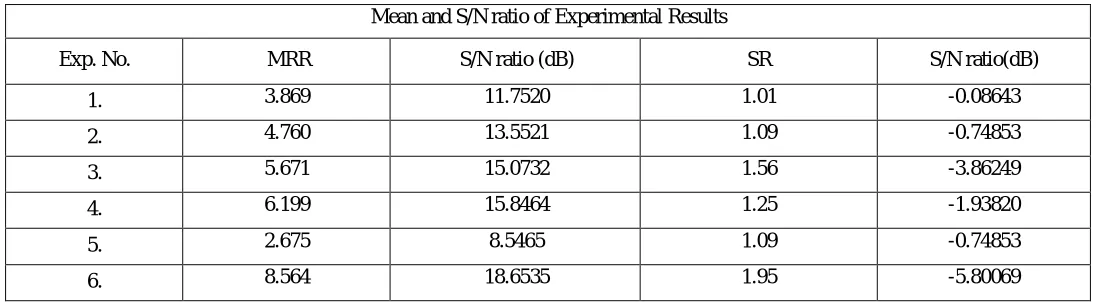
[image:5.612.38.578.590.742.2]1) Evaluation of S/N Ratio: The S/N ratio is obtained using Taguchi's methodology. Here, the term 'signal' (S) represents the desirable value (mean) and the ‘noise’ (N) represents the undesirable value (standard deviation). There are various types of S/N ratios. As the objective was to optimize the response variables, larger-the-better type and lower-the-better type S/N ratio was selected for MRR and surface roughness respectively. The values of S/N ratio of MRR and Surface Roughness corresponding to different experimental runs have been tabulated in Table 6 along with the mean values and the values of S/N ratio of MRR and surface roughness.
Table 6. Data Summary for Material Removal Rate and Surface Roughness
S.NO. MRR (mm3/min) MRR (S/N Ratio) SR (µm) SR (S/N Ratio)
1. 3.869 11.7520 1.01 -0.08643
2. 4.760 13.5521 1.09 -0.74853
3. 5.671 15.0732 1.56 -3.86249
4. 6.199 15.8464 1.25 -1.93820
5. 2.675 8.5465 1.09 -0.74853
6. 8.564 18.6535 1.95 -5.80069
7. 3.468 10.8016 1.25 -1.93820
8. 4.986 13.9550 1.43 -3.10672
9. 9.243 19.3163 2.25 -7.04365
[422]
422
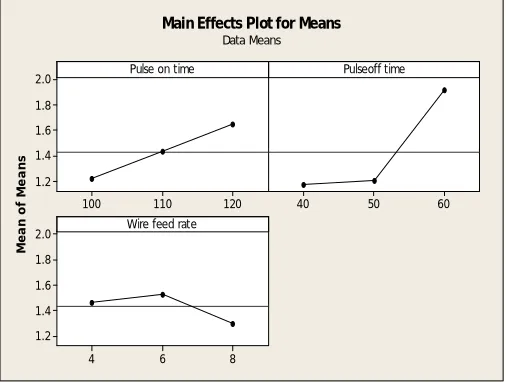
©IJRASET: All Rights are Reserved2) Response Analysis: The main effect of response variables is shown in Figure (6 - 9).
120 110 100 8 7 6 5 4 60 50 40 8 6 4 8 7 6 5 4
Pulse on time
M e a n o f M e a n s
Pulse off time
Wire feed rate
Main Effects Plot for Means
[image:6.612.187.437.310.494.2]Data Means
Fig. 6. Effects of Process Parameters on Material Removal Rate (Means)
120 110 100 18.0 16.5 15.0 13.5 12.0 60 50 40 8 6 4 18.0 16.5 15.0 13.5 12.0
Pulse on time
M e a n o f S N r a ti o s
Pulse off time
Wire feed rate
Main Effects Plot for SN ratios
Data Means
[image:6.612.192.445.524.715.2]Signal-to-noise: Larger is better
Fig. 7. Effects of Process Parameters on Material Removal Rate (S/N Ratio)
Fig. 8. Effects of Process Parameters on Surface Roughness (Means)
120 110 100 2.0 1.8 1.6 1.4 1.2 60 50 40 8 6 4 2.0 1.8 1.6 1.4 1.2
Pulse on time
M e a n o f M e a n s Pulseoff time
Wire feed rate
Main Effects Plot for Means
[423]
423
©IJRASET: All Rights are Reserved1 2 0 1 1 0
1 0 0 -1 -2 -3 -4 -5
6 0 5 0
4 0
8 6
4 -1 -2 -3 -4 -5
P u lse o n t im e
M
e
a
n
o
f
S
N
r
a
ti
o
s
P u ls e o ff t im e
W ire fe e d rat e
M a i n E f f e c t s P lo t f o r S N r a t io s
Da ta M e a n s
S ig n a l-to - n o is e : S m a lle r is b e tte r
Fig. 9. Effects of Process Parameters on Surface Roughness (S/N Ratio)
[image:7.612.180.449.78.220.2]3) ANOVA for Single Response Optimization: The Analysis of Variance ANOVA (general linear model) for raw data and S/N data has been performed. The ANOVA for Means & S/N data are given in Tables 7-10.
Table 7. Analysis of Variance for Material Removal Rate (Means)
Source DF Seq SS Adj SS Adj MS F P %age contribution Ton 2 2.3837 2.3837 1.1919 9.95 0.091 6.07%
Toff 2 24.7049 24.7049 12.3524 103.09 0.010 62.92%
WF 2 12.1689 12.1689 6.0844 50.78 0.019 30.99 Residual Error 2 0.2397 0.2397 0.1198
Total 8 39.4971
[image:7.612.35.577.280.398.2]DF - degrees of freedom, SS - sum of squares, MS - mean squares(Variance), F-ratio of variance of a source to variance of error, P < 0.05 - determines significance of a factor at 95% confidence level
Table 8. Analysis of Variance for Material Removal Rate (S/N ratio)
Source DF Seq SS Adj SS Adj MS F P %age contribution Ton 2 2.426 2.426 1.213 0.51 0.661 2.55%
Toff 2 56.507 56.507 28.253 11.92 0.077 59.65%
WF 2 35.784 35.784 17.892 7.55 0.117 37.78% Residual Error 2 4.740 4.740 2.370
Total 8 99.457
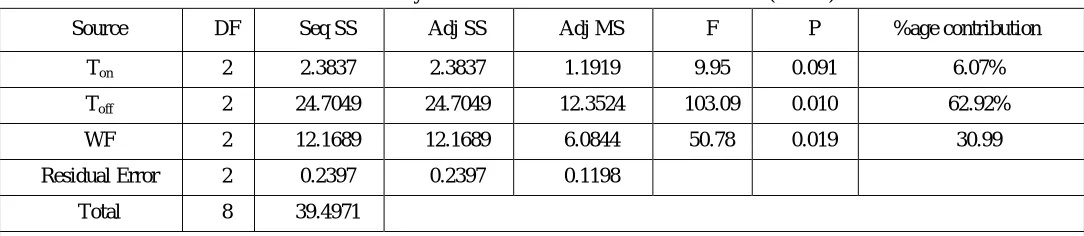
Table 9. Analysis of Variance for Surface Roughness (Means)
Source DF Seq SS Adj SS Adj MS F P %age contribution
Ton 2 0.26882 0.26882 0.134411 132.93 0.007 18.79%
Toff 2 1.07722 1.07722 0.538611 532.69 0.002 75.32%
WF 2 0.08402 0.08402 0.042011 41.55 0.024 5.87%
Residual Error 2 0.00202 0.00202 0.001011
[image:7.612.37.587.454.741.2][424]
424
©IJRASET: All Rights are ReservedTable 10. Analysis of Variance for Surface Roughness (S/N Ratio)
Source DF Seq SS Adj SS Adj MS F P %age contribution Ton 2 9.1068 9.1068 4.5534 51.05 0.019 20.09%
Toff 2 34.3672 34.3672 17.1836 192.65 0.005 75.82%
WF 2 1.8487 1.8487 0.9244 10.36 0.088 04.07% Residual Error 2 0.1784 0.1784 0.0892
Total 8 45.5010
[image:8.612.42.579.270.352.2]4) Confirmation Experiment for Single Response Optimization: In order to validate the results obtained, three confirmation experiments were conducted for each of the response characteristics (MRR and SR) at optimal levels of the process variables. The average values of the characteristics were obtained and compared with the predicted values. The results are given in Table 11.
Table 11. Predicted Optimal Values, Confidence Intervals and Results of Confirmation Experiments Performance
Measures / Responses
Optimal Set of Parameters
Predicted Optimal Value
Predicted Confidence Intervals at 95% Confidence Level
Experimental Value
MRR A3B3C2 9.473 mm3/min CICE: 8.04 < μMRR < 11.43 9.243 mm3/min
Surface Roughness A1B1C3 0.8278 µm CICE: 0.6728 < μSR < 0.983 0.795 µm
.
B. Multi response optimization
Taguchi’s method focuses on products with single quality characteristic for determining the optimal settings of controllable parameters. But most products have several quality characteristics of interest. A single setting of the process parameter may be optimal for one characteristic but not for the other one. In such cases, grey relational analysis is brought into use.
1) Grey Relational Analysis: The theory of grey system which was proposed by Deng[16-17]. It makes use of grey relational generation and the grey relational coefficient to handle the uncertain systematic problem under the status of only partial known information. Therefore, the grey relational coefficient can express the relationship between the desired and actual experimental results. The use of Taguchi method with the grey relational analysis can greatly simplify the optimization of process parameters for multiple-performance characteristics. Antony J [18] attempted simultaneous optimization of multiple quality characteristics in manufacturing processes using Taguchi’s quality loss function. In GRA, grey relational coefficient for different characteristics is calculated and their average is called grey relational grade which is used as a single response for the Taguchi’s experimental plan.
[image:8.612.32.586.573.724.2]Table 12 shows the mean values and S/N ratios of MRR and Surface Roughness. Table 13 shows the grey relational grade for each experiment using L9 orthogonal array. Higher grey relational grade represents that the corresponding elemental result is closer to the ideally normalized value.
Table 12. Mean Value and S/N ratio of Experimental Results Mean and S/N ratio of Experimental Results
[425]
425
©IJRASET: All Rights are Reserved [image:9.612.37.577.63.376.2]7. 3.468 10.8016 1.25 -1.93820 8. 4.986 13.9550 1.43 -3.10672 9. 9.243 19.3163 2.25 -7.04365 Average 5.492778 14.16629 1.431111 -2.80816
Table 13. Grey Relational Coefficient and Grey Relational Grade
S. No. Grey Relational Coefficient
Grey Relational Grade Comparability Sequence MRR SR
1. 0.415848 1 0.707924 2. 0.48299 0.8401 0.661545 3. 0.559296 0.479499 0.519398 4. 0.608133 0.652601 0.630367 5. 0.333333 0.8401 0.586717 6. 0.890405 0.378403 0.634404 7. 0.387414 0.652601 0.520007 8. 0.501098 0.535261 0.51818 9. 1 0.333333 0.666667
[image:9.612.32.580.416.528.2]2) ANOVA for Multi Response Optimization: The purpose of Analysis of Variance (ANOVA) is to investigate the parameters, whose combination to total variation is significant. The ANOVA for grey relational grade has been tabulated in Table 14.
Table 14. Analysis of Variance for Grey Relational Grade
Source DF Seq SS Adj SS Adj MS F P A 2 0.006307 0.006307 0.003153 0.44 0.695 B 2 0.001421 0.001421 0.000710 0.10 0.910 C 2 0.019454 0.019454 0.009727 1.36 0.424 Residual Error 2 0.014344 0.014344 0.007172
Total 8 0.041525
The graphs of grey relational grade are shown in Figure 10. It clearly shows that pulse on time, pulse off time and wire feed are the dominant parameters that affect grey relational grade and hence contributes in optimizing material removal rate and surface roughness to improve machining quality.
1 2 0 1 1 0 1 0 0 0 .6 5 0 0 .6 2 5 0 .6 0 0 0 .5 7 5 0 .5 5 0
6 0 5 0 4 0
8 6 4
0 .6 5 0 0 .6 2 5 0 .6 0 0 0 .5 7 5 0 .5 5 0
A
M
e
a
n
o
f
M
e
a
n
s
B
C
M ain Effects Plot for M eans
Data M ea ns
[image:9.612.175.423.579.720.2][426]
426
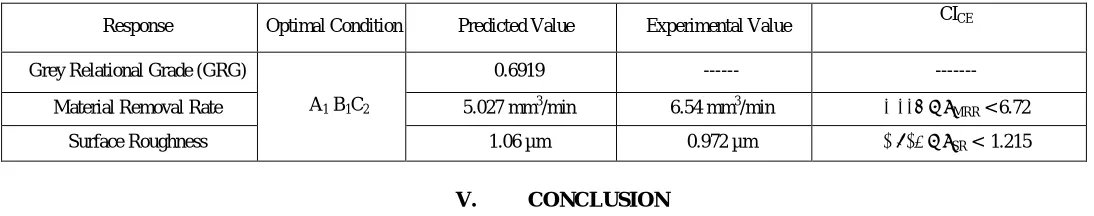
©IJRASET: All Rights are Reserved [image:10.612.34.581.140.248.2]3) Confirmation Experiment for Multi Response Optimization: In order to validate the results obtained, three confirmation experiments were conducted for each of the response characteristics (MRR and SR) at optimal levels of the process variables. The average values of the characteristics were obtained and compared with the predicted values. The results are given in Table 15.
Table 15. Predicted and Confirmation Experiments Results of Multi Response Optimization at Optimal Setting
Response Optimal Condition Predicted Value Experimental Value CICE
Grey Relational Grade (GRG)
A1 B1C2
0.6919 --- ---
Material Removal Rate 5.027 mm3/min 6.54 mm3/min 3.337 < μMRR < 6.72
Surface Roughness 1.06 µm 0.972 µm 0.905 < μSR < 1.215
V. CONCLUSION
The following conclusions are drawn based on the results obtained for performance characteristics studied in this research work namely, MRR and Surface Roughness. In this study, all three process parameters affect the performance parameters. All the selected parameters significantly affect the MRR. Pulse off time has emerged as most significant with a percentage contribution of 62.92 % followed by Wire Feed (30.99 %) and Pulse on time (6.07%). The process parameters settings of Pulse on time at 120 µs, Pulse off time at 60 µs and Wire Feed at 6mm/min have given the optimum results for MRR. All the selected parameters affect the Surface Roughness significantly. Pulse off time has emerged as most significant with a percentage contribution of 75.32% followed by Pulse on time (18.79%) and Wire Feed (5.87 %). The process parameters settings of Pulse on time at 100 µs, Pulse off time at 40 µs, and Wire Feed at 8 mm/min have given the optimum results for Surface Roughness.
REFERENCES
[1] Shinde, V. D., Shivade, A. S. (2014), “Parametric Optimization of Surface Roughness in Wire Electric Discharge Machining (WEDM) using Taguchi Method”, International Journal of Recent Technology and Engineering, Volume-3, Issue-2
[2] Lee S.H., Li X.P. (2001), “Study of the effect of machining parameters on the machining characteristics in electrical discharge machining of tungsten carbide”, Journal of Material Processing Technolology, 115, 344-358
[3] Nihat Tosun (2003), “The effect of the cutting parameters on performance of WEDM”, KSME international journal, 17(6)816- 824.
[4] Chiang K.T., Chang, F.P. (2006), “Optimization of the WEDM process of particle-reinforced material with multiple performance characteristics using grey relational analysis”, Journal of Materials Processing Technology, 180, 96-101
[5] Kanlaya siria K., Boonmung S. (2007), “Effects of wire-EDM machining variables on surface roughness of newly developed DC 53 die steel: design of experiments and regression model”, Journal of Materials Processing Technology, 459-464
[6] U. Esme, A. Sagbas and F. Kahraman (2009), “Prediction of surface roughness in wire electrical discharge machining using design of experiments and neural networks”, Iranian journal of science & technology, transaction b, engineering, 33, 231-240.
[7] Muthu Kumar V, Suresh Babu A , Venkatasamy R and Raajenthiren M (2010),“Optimization of the WEDM Parameters on Machining Incoloy800 Super alloy with Multiple Quality Characteristics”, International Journal of Engineering Science and Technology,2(6), 1538-1547.
[8] Vamsi Krishna Pasam (2010), “Optimizing Surface Finish in WEDM Using the Taguchi Parameter Design Method”, J. of the Braz. Soc. of Mech. Sci. & Eng, 32(2), 107-113
[9] Pujari Srinivasa Rao, Koona Ramji and Beela Satyanarayana (2011), “Effect of WEDM conditions on surface roughness: a parametric optimization using Taguchi method”, International journal of advanced engineering sciences and technologies, 6(1), 41-48.
[10] Anish Kumar , Vinod Kumar and Jatinder Kumar (2012),“Prediction of Surface Roughness in Wire Electric Discharge Machining (WEDM) Process based on Response Surface Methodology”, International Journal of Engineering and Technology,2(4),708-719
[11] Atul Kumar and Dr.D.K.Singh (2012), “Strategic optimization and investigation effect of process parameters on performance of wire electric discharge machine (WEDM)”, International journal of engineering science and technology, 4(06), 2766-2772
[12] Dharmender, Rajeev Kumar and Anmol Bhatia (2012), “Investigation of the effect of Process Parameters on Surface Roughness in Wire Electric Discharge Machining of En31 Tool Steel”, Proceedings of the National Conference on Trends and Advances in Mechanical Engineering, YMCA University of Science & Technology, Faridabad, Haryana,417-423.
[13] G. Rajyalakshmi and P.Venkata Ramaiah (2012), “A parametric optimization using Taguchi method: effect of WEDM parameters on surface roughness machining on Inconel 825”, Elixir Mech. Engg., 43, 6669-6674.
[14] Maneesh K. Yadav, ShaileshM.Pandey, Sumit Chaudhary and Qasim Murtaza (2012), “Effects of machining variables on surface roughness in wire-EDM of AISI D3”, International journal of engineering sciences, 1(3), 2277-9698
[15] Navjot Singh, Parlad Kumar and Khushdeeep Goyal (2014), “Experimental Investigation of WEDM Variables on Surface Roughness of AISI D3 Die Steel By Using Two Cryogenically Treated Different Wires”, Manufacturing Science and Technology, 2(1),20-25
[16] Deng, J. (1989). Introduction to grey system. Journal of Grey System, 1(1), 1-24
![Fig. 1. Schematic Diagram of WEDM (Shinde & Shivade, 2014)[1]](https://thumb-us.123doks.com/thumbv2/123dok_us/1256976.653038/1.612.211.404.585.718/fig-schematic-diagram-wedm-shinde-shivade.webp)