The Fabrication of Nano-Scale Engineered Surfaces to Investigate the
Enhancement of Boiling Heat Transfer and CHF in Nuclear Reactors
By
Olorunsola J. Akinsulire Jr.
SUBMITTED TO THE DEPARTMENT OF NUCLEAR SCIENCE AND ENGINEERING IN PARTIAL FULFILLMENT OF THE REQUIREMENTS FOR THE DEGREE OF
BACHELOR OF SCIENCE IN NUCLEAR SCIENCE AND ENGINEERING
AND
MASTER OF SCIENCE IN NUCLEAR SCIENCE AND ENGINEERING
AT THE
MASSACHUSETTS INSTITUTE OF TECHNOLOGY
JUNE 2019
©Massachusetts Institute of Technology. All rights reserved
Signature of Author:_____________________________________________________________________
Olorunsola J. Akinsulire Jr. Department of Nuclear Science and Engineering May 17, 2019
Certified by:____________________________________________________________________________
Matteo Bucci Norman C. Rasmussen Assistant Professor of Nuclear Science and Engineering Thesis Supervisor
Certified by:____________________________________________________________________________
Md Mahamudur Rahman Assistant Professor of Nuclear Science and Engineering Thesis Reader
Accepted by:___________________________________________________________________________
Ju Li Battelle Energy Alliance of Nuclear Science and Engineering
The Fabrication of Nano-Scale Engineered Surfaces to Investigate the Enhancement on Boiling Heat Transfer and CHF in Nuclear Reactors
By
Olorunsola J. Akinsulire Jr.
Submitted to the Department of Nuclear Science and Engineering on May 17, 2019 in Partial Fulfillment of the Requirements for the Degrees of Bachelor of Science and Master of Science in Nuclear Science and Engineering
ABSTRACT
This work looks into the feasibility of utilizing nanotechnology in order to improve the performance of pressurized water reactors (PWRs) in the nuclear industry. Through growing zinc oxide nanowires (ZnO NW) on the surface of zircaloy, which clads the uranium oxide fuel, the project aims to increase the heat flux limit, i.e., the critical heat flux (CHF), resulting in a boiling crisis. That allows for improvement on the safety margins and operation at higher power. The exact procedure for growing the nanowires will be delineated such that the results can be replicated exactly. A variety of ZnO NW structures will be fabricated based on the characteristic size of the features and characteristic spacing among the structures. This goal will be achieved by controlling the fabrication steps at various stages. Utilizing the Scanning Electron Microscope (SEM) and Focused Ion Beam (FIB), we will be able to geometrically describe the properties of the nanowires. Heat transfer performance of ZnO nanostructured surfaces will be characterized through flow boiling at atmospheric pressure and under pressurized conditions, using state-of-the-art diagnostic systems consisting of high-speed video and infrared (IR) thermometry. The post processing of the IR data will allow us to determine spatial and temporal evolution of heat flux and temperature across the heated surface to the point of CHF. This will all culminate into a numerical result termed the enhancement, which will describe the improvement from modern standards. These results will provide useful insights into designing the future generation nuclear fuel claddings as well as economic, feasible, and scalable nanofabrication techniques.
Acknowledgments
I would like to thank professor Matteo Bucci for his guidance in this research project and giving me the opportunity to join his team of highly skilled researchers. The work has helped to deepen my understanding of fundamental concepts and their application to an engineering laboratory scene. I would also like to thank Chi Wang, Guanyu Su, Md Mahamudur Rahman and Artyom Kossolapov for closely working with me and helping to ensure there was positive research development regardless of what technical challenges may have presented themselves.
To all above and the remaining RED lab members, I would like to thank them for their encouragement, friendship and opportunity to be part of such an outstanding team.
This work would not have been possible without the fellowship opportunities from the NRC, OGE diversity awards and the William T & Ann D. Mccormick fund.
This research was supported by Exelon Corporation through its membership in the MIT Energy Initiative’s Low Carbon Energy Centers
I would like to thank my undergraduate advisor, professor Michael Short, and research advisor, professor Anne White, for their guidance and advice through my 5 years spent here and for introducing me to the field of research through a UROP and providing a space to build and design with my hands while broadening my horizons.
Lastly, I would like to thank my friends and most of all my family for their love and encouragement, which undoubtedly gave me drive to work harder and continue to be the best that I can be.
Contents
Acknowledgements……….. 5
List of Figures ………...……….. 8
List of Tables ……….. ……… 9
1. Introduction ………. 10
2. Background ………. 12
2.1 Bubble Interference Model ……… 13
2.2 Hydrodynamic Instability Model ……….. 14
2.3 Macrolayer Dryout Model ……… 15
2.4` Hot/Dry Spot Model ………..……… 16
2.5 Interfacial Lift-off Model ……….. 18
2.6 Flow Boiling Models and Correlations ………. 19
2.7 Economic Potential of CHF Enhancement ………... 20
2.8 Fabrication of Nano-Engineered Surfaces ……….... 21
3. Approach and Methods ………... 25
3.1 Zinc Oxide Nanorod Fabrication on Titanium and Zircaloy ……… 26
3.2 Variation to the Fabrication Process ……….. 30
3.3 Flow Boiling Setup ………... 32
3.4 Test Matrix ……… 34
4. Results and Analysis ………... 35
4.1 Copper Fabrication ……… 35
4.2 Seed Solution Appearance ……… 36
4.3 Pool Seeding ………. 40
4.4 Substrate Orientation and Temperature Dependence During Growth Cycle … 41
4.5 Fabrication of nano-engineered cladding surfaces ………... 44
4.6 Flow Boiling on Zinc Oxide Nano-Engineered Surfaces ………. 48
5. Conclusion ……….. 55
References ………. 57
List of Figures
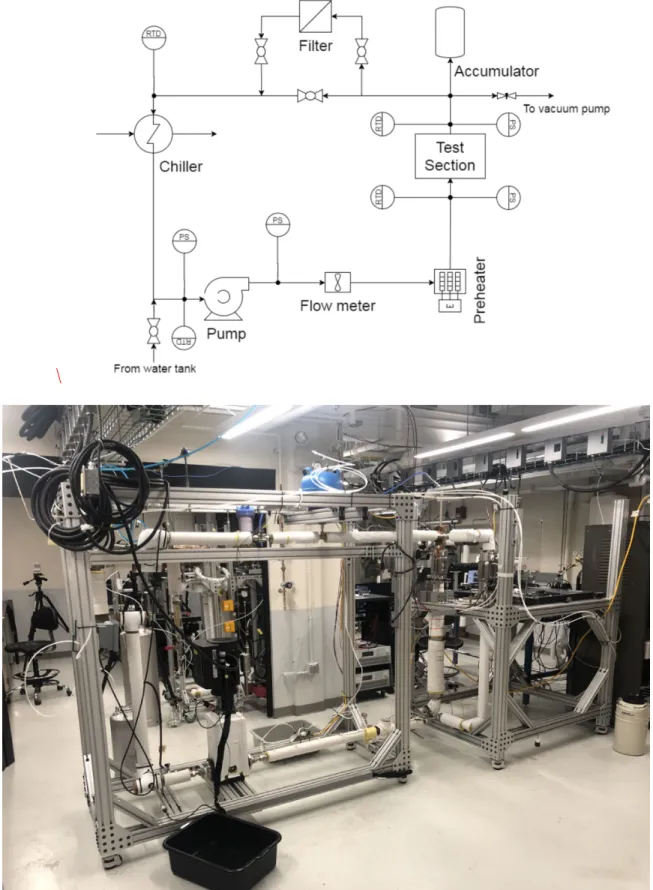
Figure 1. Chemicals and equipment used in the fabrication process ………... 28 Figure 2. Wire formation used to suspend sample (left) wire and sample suspended in beaker (right) ……… 30 Figure 3. Schematic of 10 bar flow loop (top). Picture of 10 bar loop (bottom) ………. 33 Figure 4. Oxidized copper flaking after removal from 350 oC furnace due to formation of copper oxides. The samples are 2cm by 2cm ……….. 35 Figure 5. SEM images of non-uniform copper surface with zinc oxide due to copper oxide formations at high temperatures ………. 36 Figure 6. Optical variation in seed solution appearance with same composition ……… 37 Figure 7. Unseeded cleaned copper surface (top left) and seeded copper surface (top right & bottom left) to determine seed presence in solution. Red circles indicate seed particles. Ticks on scale bar are 1mm apart (bottom right) ………. 38 Figure 8. Discoloration showing presence of particles coming out of solution despite being transparent. Zircaloy substrate is 2cm by 2cm. No seed (top left), 1 seed (top right), 5 seed (bottom left) and 10 seed (bottom right) ………... 39 Figure 9. SEM images showing growing density in zinc oxide nanorods with increasing times the surface is seeded. No seed (top left), 1 seed (top right), 5 seed (bottom left) and 10 seed (bottom right) ……….. 40 Figure 10. SEM images displaying thick non-uniform seed layer resulting from the pool seeding method ……….... 41 Figure 11. SEM images showing completely different zinc oxide structures resulting in temperature gradients in growth solution below 90oC (right) and higher temperatures (left) ……….. 42 Figure 12. Bubble formation on the surface of the zircaloy substrate facing the bottom of the beaker ………. 43 Figure 13. SEM images showing circular regions of low-density nanostructures due to formation of bubbles during the growth process at high temperatures ……… 44 Figure 14. SEM images of standard procedure (top left), use of vitamin C growth modifier (top right) and x10 concentration reduce growth solution (bottom) …………. 45 Figure 15. Clean sapphire heater coated in titanium with gold pads (left). Same heater with zinc oxide fabricated on top ………. 49 Figure 16. Boiling curves on titanium and zircaloy at 1 bar and titanium at 4 bar …….. 50 Figure 17. NSD as a function of applied heat flux at 1 bar (left) and 4 bar (right) ... 51 Figure 18. Bubble frequency as a function of applied heat flux at 1 bar (left) and 4 bar (right) ………... 51 Figure 19. NSD as a function of wall superheat at 1 bar (left) and 4 bar (right) ………. 52
List of Tables
Table 1. Chemicals used in the zinc oxide process and their concentrations ………...…27 Table 2. Variation test matrix for zinc oxide fabrication on zircaloy, copper and
titanium ………...……..31 Table 3. Test matrix for flow boiling experiments on sapphire and zircaloy substrates (* additional tests on titanium surface at high pressure) ……….. 34 Table 4. Description of results from each fabrication procedure done on zircaloy ……. 48 Table 5. CHF results on pure and coated titanium and zircaloy surfaces with
Chapter 1
Introduction
There are many aspects that limit the operation of nuclear reactors. Some of them are driven by safety, while others are design limits [1]. Design limits are actively imposed to ensure that damages to the reactor and accidents are actively avoided.
One of the design limits of interest, which will be the focus of this work, is known as critical heat flux (CHF). In Nuclear reactors, heat is generated by fission reactions, and transferred to the coolant through the fuel clad. If the temperature gets sufficiently high to activate nucleation sites, boiling can be observed on the cladding surface. This phenomenon is referred to as the onset of nucleate boiling (ONB). Once boiling has started, the process goes through various well-characterized phases that have different impacts on the heat transfer modes [2]. The study of how to well characterize these modes as well as the heat transfer coefficient has been and is continually being carried out [3]. CHF specifically, refers to the heat flux at which a continuous, spreading vapor film forms around the clad. Beyond the CHF, the heat transfer coefficient drops drastically. This is undesirable situation that should be avoided at all cost and under any circumstance. If the temperature of the fuel and clad rise rapidly, they eventually melt and initiate a quick and self-sustaining oxidation reaction, respectively. That would lead to the emission of radioactive material into the coolant and possibly into containment. Due to the rapid oxidation of the clad, its structural integrity will be severely impacted [4] Hydrogen could be released into the containment building, which can lead to a hydrogen explosion as seen in the Fukushima Daiichi reactor incident in Japan.
This work focuses on studying and enhancing the heat flux beyond which the CHF is triggered. By raising the CHF threshold, we can operate our nuclear reactors at even higher power while preserving the safety margins. In other fields, e.g., electronic cooling, enhancement of CHF has been achieved by manipulating the boiling surface at the micro and nanoscale [5]. In many of these studies, there have been significant increases in the CHF point, sometimes by over 100%. However, a true understanding of the underlying mechanism has not been understood. Nonetheless, these studies were carried out in operating conditions (e.g., saturated pool boiling at atmospheric pressure), which are not relevant to nuclear reactors, operated in pressurized conditions, and cooled by forced flows.
In this study, we use zinc oxide nanoparticles to construct nanostructures on the zircaloy clad surface. Using these surfaces, we plan to gain a deeper understanding of the underlying cause that affects the CHF as well as attain higher CHF limits. This will be done in the context of flow boiling. Using various imaging techniques we will visualize the formation of bubbles on the surface and extract parameters that can give insight into what the true CHF-enhancing mechanism may be.
Chapter 2
Background
The understanding and prediction of CHF is one of the major challenges for the thermal science community. A plethora of models have been proposed trying to capture the underlying phenomena. There is no universal agreement as to which model is the correct one. However, further improvements have been made to incorporate otherwise ignored parametric effects which could play key roles in various conditions, coolant type, surface properties, flow geometry etc.
Throughout recent literature, there are a few prevalent models [3], such as the bubble interference model, hydrodynamic instability model, macrolayer dryout model, hot/dry spot model and interfacial lift-off model. Briefly, the rationale beyond each of these models will be discussed. Before delving further into them, the foundation will be laid on the pioneering work that spearheaded the direction of today's research.
The first work worth of mention is perhaps the one of Kutateladze, who used dimensional analysis to predict CHF [6]. Kutateladze proposed the existence of vapor jets perpendicular to the boiling surface. At the onset of CHF, these vapors would separate the liquid from the heated surface suspending it in a gravitational balance at a height referred to as the linear scale of capillary disturbances. After mathematically defining these terms, they are combined to show that CHF is directly proportional to terms depending on vapor and liquid density, gravity, latent heat of vaporization and the fluid surface tension as seen in the following equation:
𝑞′′!"# 𝜌!ℎ!" 𝜎𝑔 𝜌!𝜌− 𝜌!
!!
!/! = 𝐾
The dimensionless parameter K is known as the dimensionless CHF, whereas the term
!"!!!!!
!!!
!/!
is often referred to as critical velocity. By a fitting of experimental data, Kutateladze found that this constant varied between 0.13 and 0.19, with 0.16 as an average.
2.1. Bubble Interference Model
This model, conceptualized in 1955 by Rohsenow and Griffith [7], proposes that CHF is triggered by the coalescence of individual bubbles that neighbor each other. At a critical point, this will lead to a vapor blanket enveloping the surface. The model is described by the equation
𝑞′′!"# = 0.012𝜌!ℎ!"(
𝜌!− 𝜌! 𝜌! )!.!
Iterating on the bubble interference model, Chang and Snyder [8] proposed a different mechanism, which took into account surface and fluid interaction. This led to the appearance of terms such as surface tension (σ) and contact angle (α) yielding the following equation, which takes similar form to that of Kutateladze's equation.
𝑞′′!"# =
1 2 𝜋 6 ! !
(0.0119𝛼)!!𝜌!ℎ!" 2𝜎𝑔 𝜌!− 𝜌!
𝜌!!
!/!
Precisely, the formulation Chang and Snyder has the same critical velocity as the Kutateladze correlation.
2.2. Hydrodynamic Instability Model
Inpired by Kutateladze's work, Zuber proposed the well-known hydrodynamic instability model [9]. This model assumes the existence of vapor jets perpendicular to the heated surface in the moments leading up to CHF. The vapor moves away from the heated surface with velocity 𝑢!. In between these jets, the heated surface is being replenished by coolant moving with velocity 𝑢!.
Zuber further assumed that distance between the vapor jets formed along the surface is dictated by Rayleigh-Taylor instabilities. Taking the heat generated during CHF to go completely into the vaporization of the liquid and Aw to be the wetted area of the surface and Ag to be the area covered by the vapor, he got the following equation
𝑞′′!"# = (𝐴!
𝐴!)𝜌!ℎ!"𝑢!
In this model, the triggering mechanism is a Kelvin-Helmoltz instability, which occurs as when the relative velocity of liquid and vapor is large enough, i.e., when the surface heat flux is large enough. The rapid expansion of this instability leads to the merging of vapor jets across the surface preventing liquid from quenching the heated surface.
Through properly defining the aforementioned terms (ug, uf, Aw, Ag) and combining the equations together, an expression for CHF is attained, which once again mimics the form of Kutateladze's equation with a dimensionless CHF value equal to 0.131.
𝑞′′!"# 𝜌!ℎ!" 𝜎𝑔 𝜌!𝜌− 𝜌!
!!
!/! =𝐾= 0.131
The concurrence of mechanistic formulations and dimensional analysis has reinforced the credibility of this formulation, often referred to as the Zuber-Kutateladzes’, which is perhaps the most popular to date. Significantly, further research has attempted to iterate on this result and include other effects such as surface characteristics [10], surface orientation with respect to liquid flow [11], contact angle [12], and liquid viscosity [13].
2.3. Macrolayer Dryout Model
Similar to the hydrodynamic instability model, the macrolayer dryout model also hypothesizes the existence of vapor jets. However, instead of these jets growing and overlapping to trigger CHF, this model developed by Haramura and Katto [14] suggests that these vapor jets exist among a liquid macrolayer and are contributing to a large hovering bubble due to the Helmholtz instability. Therefore, the growth of this bubble leads to the consumption of the liquid macrolayer below it. The trigger for CHF is when the liquid macrolayer dries out prior to the departure of the overhead bubble. This idea was translated in the following equation
𝑞′′!"# =𝜌!ℎ!"𝛿(1− 𝐴! 𝐴!)𝑓
Here, δ is defined as the thickness of the liquid macrolayer and f is the bubble departure frequency. Through the proper analytical definition of these terms and substituting it into the equation, it yields
𝑞′′!"# =0.721( 𝐴!
𝐴!)!/! (1− 𝐴!
𝐴!)!/!"[
𝜌! 𝜌!+1
11 16
𝜌!
𝜌! +1
!
!
]!/!" ∗ 𝜌
!ℎ!"
𝜎𝑔 𝜌!− 𝜌!
𝜌!!
!/!
𝐴!
𝐴! = 0.0584(
𝜌! 𝜌!)!/!
Similar to that of the hydrodynamic instability model, further modifications were made to this model to define a different liquid macrolayer thickness and even possibly the existence of a microlayer under small bubbles as opposed to macrolayer. However, despite its results in predicting CHF, its accuracy has been questioned, e.g., some researchers have argued that the macrolayer never actually dries out [15]. Note that the real difference between this formulation and the Zuber-Kutateladze model is in the term that multiplies
𝜌!ℎ!"
𝜎𝑔 𝜌!− 𝜌!
𝜌!!
!/!
2.4. Hot/Dry Spot Model
This model was proposed by Yagov in 1988 [16] and was modified in 2014 [17]. It assumes the existence of multiple dry spots across the heated surface prior to CHF during the nucleate boiling phase. The trigger mechanism for CHF in this model is when there is an irreversible growth of a dry spot on the surface.
This model takes into account varying effects such as different pressure ranges and liquid surface interactions. For low pressures of P/Pc < 0.001, we get the following expression where Pc is critical pressure, kf is thermal conductivity, Cp,f is the specific heat, ν is the kinematic viscosity, Ri is the individual gas constant, Tsat is the saturation temperature and f(Prf) is a function of the Prandtl number
𝑞′′!"#,! =0.5ℎ!"
!"/!!𝜎!/!!𝜌
! !"/!!"𝑘
!!/!!"𝑔!"/!!𝑓(𝑃𝑟!)
𝜈!!/!𝐶!!,/!!"𝑅!!"/!""𝑇!"#!"/!!
In the case of high pressures where P/Pc > 0.03 we get 𝑞′′!"#,! =0.06ℎ!"𝜌!!/!𝜎!/!
𝑔 𝜌!− 𝜌! 𝜇!
!/!
To address the intermediate range of pressures namely 0.001 < P/Pc < 0.03. Yagov defined the following weighting parameter
𝑞′′!"# = (𝑞′′!"#! ,!+ 𝑞′′!"#! ,!)!/!
This concept was further developed by Jung et al [18] who noted that in order to increase CHF, the wetted fraction of the surface needed to be increased or the heat transfer through the wetted portion needs to be improved. Assuming that CHF is determined by dynamics and instability of the liquid microlayer, they obtained a formulation similar to the Kutateladze-Zuber equation where k is a function of contact angle (α) (assuming that it is less than 90o
𝑞′′!"# = 𝑘!!/!𝜌 !ℎ!"
𝜎𝑔 𝜌!− 𝜌!
𝜌!!
!/!
𝑘= 1− 𝑠𝑖𝑛 𝛼
2 −
𝜋
2− 𝛼
2𝑐𝑜𝑠𝛼
!!/!
2.5. Interfacial Lift-off Model
The interfacial CHF prediction model was proposed by Galloway and Mudawar [19] after detailed analysis of high-speed video during flow boiling. They proposed that CHF would occur when the vapor momentum reaches a critical value that leads to the lifting of bulk fluid away from the heated surface.
Observing that the same phenomena can be seen in pool boiling along a vertical surface, they proposed a set of events that eventually lead to CHF. In the moments just prior to CHF, rapid vapor production generates a layer that moves across the surface due to buoyancy. Helmholtz instability produces waves in the vapor layer allowing for the liquid to contact the surface in what they called 'wetting fronts'. As these fronts move along the surface they provide the last source of cooling right before CHF is attained. CHF begins when the vapor momentum exceeds the pressure force resulting from interfacial curvature. By analytically defining the mean pressure difference, critical wavelength corresponding to the onset of Helmholtz instability and the vapor layer thickness they got the following equation
𝑞′′!"# = 2!!!"!" 3!! 𝜋
0.5
! !
( 𝜌!
𝜌!+ 𝜌!)𝜌!ℎ!"(1+
𝐶!,!Δ𝑇!"# ℎ!" )
𝜎𝑔 𝜌!− 𝜌!
𝜌!!
!/!
Assuming operation under saturated conditions and pressures that are not close to the critcal pressure, we can further simply to obtain the following equation, which is also similar to the Kutateladze-Zuber equation.
𝑞′′!"# = 0.151𝜌!ℎ!"
𝜎𝑔 𝜌!− 𝜌!
𝜌!!
!/!
Further studies have suggested that the interfacial lift-off model can also apply to surface orientation between 60o and 165o. The model has shown great success in predicting CHF in both flow and pool boiling in various conditions.
2.6. Flow Boiling Models and Correlations
Due to the added layer of complexity when we introduce fluid flow, the prediction of CHF during flow boiling is even more challenging. Given modest velocities and subcooling, three general models have been proposed for CHF being flooding-like models, bubble layer models and vapor blanket models [2]. These models are similar to what we see in the aforementioned case of pool boiling with the addition of a mass flux term.
Correlations for tube geometry are general correlations for predicting the onset of boiling crisis. In the case of PWRs that would be Departure from Nucleate Boiling
PWRs conditions is the Tong-68 correlation [2]. Similar to the pool boiling conditions, it is dependent on fluid intrinsic properties but now has a dependency on the mass flux of the fluid through the heated area (G) and the mass fraction of vapor at the exit of the heated area (xexit).
𝑞!" ℎ!" = 𝐶
𝐺!.!𝜇
!
!.!
𝐷!.!
𝐶= 1.76−7.433𝑥!"#$+12.222𝑥!"#$!
The Biasi correlation is dependent on similar parameters and 85.5% of its data points fall in the 10% accuracy range. For data that spans a large range of pressures as well as mass flux, the Bowring correlation can be implemented. The most accurate and useful ways to predict CHF are perhaps the Groeneveld’s look up tables, and the W-3 correlation, which is applicable to multiple geometries, and contain correction factors for non-uniform flux distributions in the core. More details on each of these correlations can be found in introductory textbooks, such as Ref. [2]. However, none of them accounts for surface effects.
2.7. Economic Potential of CHF Enhancement
Models for CHF prediction have had various successes and continue to be modified and studied today. On the forefront of these studies, is research hoping to raise the value of CHF. In nuclear reactor applications, this is very important in order to improve cost-competitiveness.
As it stands now, fuel assemblies in nuclear reactors are not utilized to their highest potential. A major limitation on this is the value of CHF. The heat flux through the assemblies at any point is set such that q''CHF/q''core > 1.3 based on engineering
tolerances and our understanding of what mechanisms govern CHF [2]. This is known as the minimum departure from nucleate boiling ratio (MDNBR) which was set by the Nuclear Regulatory Commission (NRC). It is expected that throughout the normal operation of the fuel, the heat flux in the core should respect the limit and remain below the CHF value. Therefore, it limits the net power output that can be produced by the fuel.
A potential economic benefit of increasing the CHF value comes from an increase of the reactor power rating, i.e., the reactor can produce more power when it is needed. Another benefit comes from the ability to extract more energy from each fuel assembly. Thus, for the same power output of a reactor, it would require fewer assemblies, which saves cost. This can be seen in the following equation
𝑄= 𝑞!𝑁𝐿
where 𝑄 is the core power q' is the average linear power for a fuel rod, N is the number of fuel rods in the core and L is the fuel rod active length. If we aimed to keep 𝑄 constant we can decrease the number of fuel rods (N) and increase the linear power q' thereby also increasing the operational heat flux q''.
This discussion begs the question of how to effectively raise the CHF values in our reactors. If we maintain the same clad material, the answer may come from surface modification using nano-engineered surfaces that will be discussed in the following section.
2.8. Fabrication of Nano-Engineered Surfaces
A multitude of studies have been conducted to test just how engineered surfaces affect CHF. Observation shows that they tend to yield an enhancement but the exact
mechanisms that govern it are not thoroughly understood. It is postulated that these underlying mechanisms come from liquid-surface interactions such as liquid microlayers, surface wetting, contact angle etc.
An example of this study can be seen in the work done by Tetreault-Friend et al [20] where the morphology of nanoporous surface layers was carefully controlled to study the impact on CHF. In this study, the nanoporous layer was constructed using hydrophilic SiO2 nanoparticles deposited using a layer-by-layer (LbL) method on a plain surface. The deposition was carried out by dipping the surface in alternating positively and negatively charged solutions with the nanoparticles allowing adsorption to the surface creating a bilayer. Through performance of boiling test on both the plain and engineered surface with various pore sizes, they were able to come to multiple conclusions.
First, across pore sizes varying from 10 - 100 nm, there was always enhancement when compared to the base plain case. Second, by even varying the thickness of the bilayers enhancement is always observed when compared to base case. Lastly, by choosing the optimal values of pore size and bilayer thickness, enhancement of 115% was observed.
Similar concepts have been tested with varying surface engineered structures to see how they affect the CHF result. The following surfaces were tested in pool boiling conditions at atmospheric pressures and were reported to demonstrate enhancement. These surfaces include square pillars, cylindrical pillars, ridges, porous coating, modulated porous coating and hierarchical porous coatings.
In the work done by Liter et al. [21], they reported a 98%, 193% and 214% increase in CHF on a uniform porous layer, a one-height modulation layer and a dual-height modulation layer. They argued the hydrodynamic CHF model of Kutateladze and Zuber [9] could explain the enhancement by the porous layer changing the critical wavelength of the instability.
Chu et al. [22] reported an enhancement of CHF up to 174% with cylindrical pillars. They proposed a CHF enhancement mechanism based on a modification of the force balance model introduced by Kandlikar [23].
Dhillon et al. [24] reported up to 100% CHF enhancement with silicon square pillars. Kim et al. [25] showed that microscale wells and channels increase CHF by 60%. Ahn et al. [26] investigated surfaces with deposited nanoparticles and reported enhancement up to 100%. Kim et al. [27] also studied nanoparticles coated surfaces and reported 150% increase in CHF.
Zou et al. [28] reported an increase of CHF up to 120% on ridged surfaces. Surfaces with different ridge height and spacing were tested. Wicking on these surfaces can be neglected due to the large spacing between ridges compared to their heights. They claimed that, for those surfaces, the increase is caused by the early evaporation of a liquid layer separated by and retained between ridges.
This shows that by leveraging surface modifications and carefully engineering surfaces, significant enhancements can be attained which is very promising. However these previous analyses focused on pool boiling at atmospheric conditions. Moving forward it is important to understand how these mechanisms affect forced fluid flow at
higher pressures. As a result, the focus of this study is to implement the additive solution phase hydrothermal synthesis of zinc oxide nanowires in flow boiling to determine its effect on CHF enhancement.
Chapter 3
Approach and Methods
Zinc oxide hydrothermal growth was decided upon as a potential candidate coating, due to its scalability as well as sustainability, as seen in Carey's paper [29]. If the process ended up being expensive to fabricate it would counter the end result of making reactors more economical. Beyond this, there are further nuclear requirements that the material must meet. It must be transparent to neutrons so that it doesn’t negatively impact the neutron economy within the core. This can be achieved by making the layer of zinc oxide relatively thin to reduce probability of interaction. It should not increase the friction coefficient inducing a bigger pressure drop that would require extra pumping power. Lastly, it should be chemically compatible with coolant chemistry and other materials in the core so that it does not degrade over time.
The chemicals used in the fabrication of the zinc oxide nanoparticles and those involved with the growing of the nanorods are readily available and at a reasonable price. Another benefit is that the chemicals are also non-toxic allowing for easy manipulation in a laboratory setting. Furthermore, since the seeding and growth is done in a hydrothermal environment it can easily be ramped to industrial scale. This of course is the most important property we would like since if this were to be imported to the nuclear industry, it would need to coat multiple 4m long fuel rods in a timely manner. Another advantage would be its application to complex geometrical surfaces. Since this method can be done by spraying, dipping and precise application to surface locations, it can be further extended to clad designs that are more complex in nature. By running this
experiment using Zinc oxide, we expect to see CHF enhancement and the study will attempt to explain the underlying mechanisms that are at play.
3.1. Zinc Oxide Nanorod Fabrication on Titanium and Zircaloy
The fabrication of the zinc oxide nanorods will be a slightly modified procedure from the work done by Ko et al. [30] and the work by Miljkovic et al. [36]. The general procedure of the fabrication process on copper due to its availability as well as Zircaloy since it is the material of the clad in reactors will be described as follows. The boiling substrate will be a sapphire base with a titanium coating on which the boiling will take place. The titanium surface will have gold pads on the end for conducting electricity through the surface to generate heat flux.
Solution 1 and oil bath preparation
1. Turn on hot plate with 50-50 silicone oil and water and heat to a steady state 60C (takes ~30min).
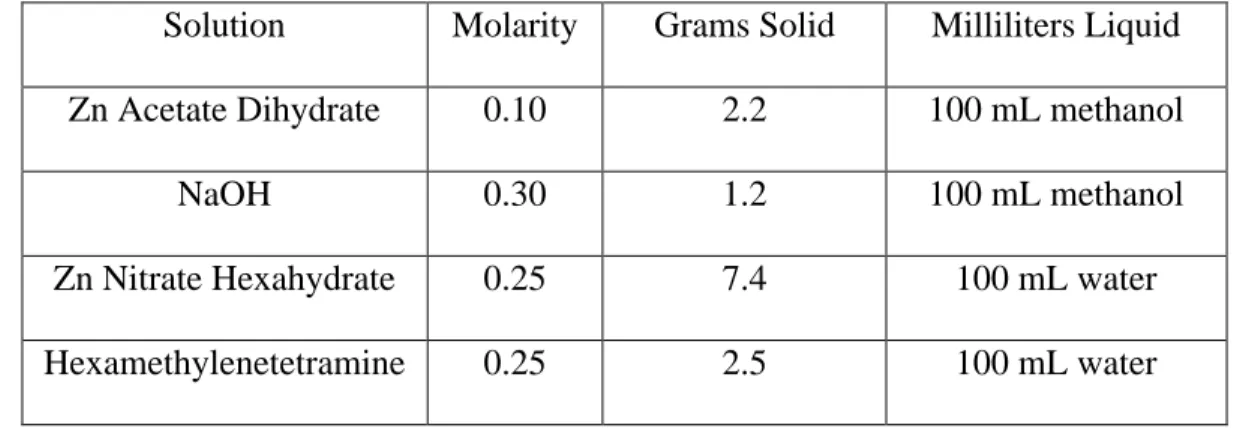
2. Create two stock solutions of Zn Acetate Dihydrate 0.1M and NaOH 0.3M in small disposable 100mL bottles by adding 2.2g of Zn acetate dihydrate to 100mL of methanol and a separate 1.2g of sodium hydroxide to 100mL of methanol respectively. If more stock solutions are required, the ratios are:
Table 1 : Chemicals used in the zinc oxide process and their concentrations
Solution Molarity Grams Solid Milliliters Liquid Zn Acetate Dihydrate 0.10 2.2 100 mL methanol
NaOH 0.30 1.2 100 mL methanol
Zn Nitrate Hexahydrate 0.25 7.4 100 mL water
Hexamethylenetetramine 0.25 2.5 100 mL water
3. Using a pipette, put 1 mL of each methanol-based stock solution into new disposable 50 mL bottles, and then add 9 mL of methanol to each solution. This results in Zn Acetate Dihydrate 0.01M and NaOH 0.03M.
4. Cap and stir/mix both thoroughly, then slowly add the NaOH to the Zn Acetate Dihydrate.
5. Cap and stir/mix mixture, label with date and “ZnO seeds”. Add stir bar, place mostly into silicone oil bath, turn on stirrer, maintain at 60C for two hours.
This is Solution 1, or the ZnO seed solution.
Solution 2 preparation and sample cleaning
1. Take 7.4g of zinc nitrate hexahydrate and add to 100mL of DI water and separately measure 2.5g of hexamethylenetetramine and add to 100mL of DI water.
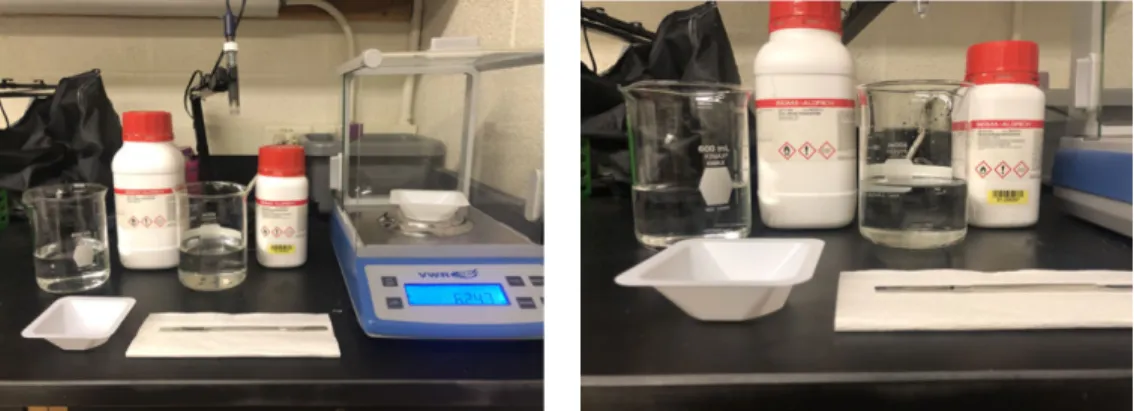
2. Measure Zn Nitrate Hexahydrate and Hexamethylenetetramine, using folded weight paper and enclosed scale, add into separate beakers, add stir bars.
Figure 1: Chemicals and equipment used in the fabrication process
3. Solvent clean each zircaloy, titanium or copper sample into beaker (Acetone, Ethanol, Methanol, IPA, DI H2O), N2 dry, and Plasma clean with Argon (15min, Harrick PDC-001 set on high) samples. From this point forward, be sure to only grab the sample at the edges or corners, preferably in the same location each time. 4. While samples are plasma cleaning, place zinc nitrate hexahydrate and
hexamethylenetetramine solution from (1) on hot plate covered with foil (Want this to be preheated to ~85C for growth, takes ~1 hr). Press down on the center of the foil to create an inverted cone to limit losses due to evaporation.
Sample preparation
1. Remove container with ZnO seed solution from oil bath.
2. In fume hood, lay out paper wipes to collect excess ZnO seed solution and methanol.
3. Drop ZnO seed solution on top of clean, dry sample until surface is covered, wait 10 sec, allow excess to drain, then rinse gently with methanol by dropping it onto the sample.
4. Dry sample with weak N2 or Ar stream, repeat steps 3 & 4 for a total of 5 repetitions.
5. The size of the ZnO nano seed crystals is 2-4 nm.
Anneal Seeded Samples
1. Place samples on platform in automated furnace, set ramp to 20 °C/min (or ramp 10 min); hold at 350C for 20 minutes, turn off. Ensure set points on the furnace are set properly to prevent temperature overshoot.
2. Automated furnace will turn off after the program completes (the target temp should go back to 25C) or turn furnace off by flipping switch. Allow samples to cool to under 150C before removing from the furnace; open the door slightly to increase cooling rate if needed.
ZnO Nanowire Growth
1. Taking the zinc nitrate hexahydrate and hexamethylenetetramine solution that were placed on the hot plate in Solution 2 preparation and sample cleaning step (4), mix together into one beaker making a 200mL solution. This is Solution 2. 2. Within 2 minutes of creating solution 2, place sample upside down in beaker of
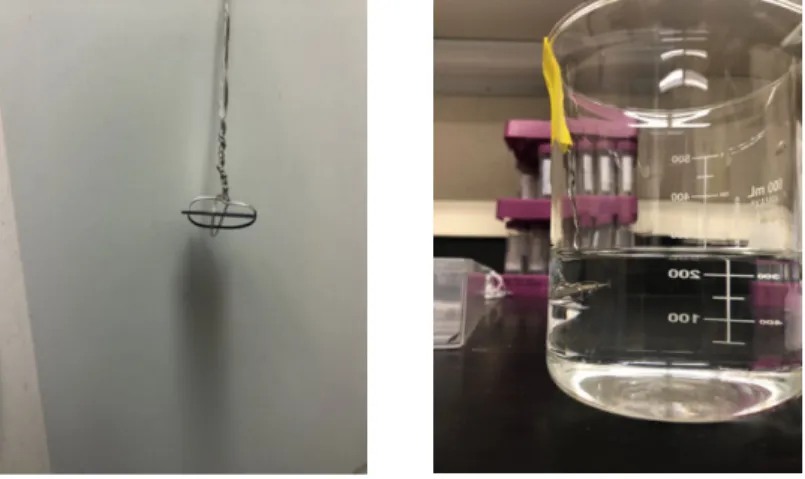
Solution 2 (but not with front face touching the bottom). Samples can be suspended using wires wrapped and hung from edge of beaker. Allow ZnO nanowires to grow on sample in beaker undisturbed for 3 hours at 90C in silicone oil and water bath.
Figure 2: Wire formation used to suspend sample (left) wire and sample suspended in beaker (right)
3. Properly dispose of all hazardous waste used; solvent cleaners, Zn Nitrate/Hex, Glass/pipettes in sharps. Remove clean and put away stir bars.
4. After 3 hours, remove sample from Solution 2, rinse back side first (most precipitate will accumulate on the back and this will also cool the sample), then turn over and gently rinse/ drop water on the front surface until there is no change in appearance.
5. Dry surface gently using N2 gas and ensure all moisture is removed. 6. Store finished samples in containment to be SEM’d at a later point.
3.2. Variation to the Fabrication Process
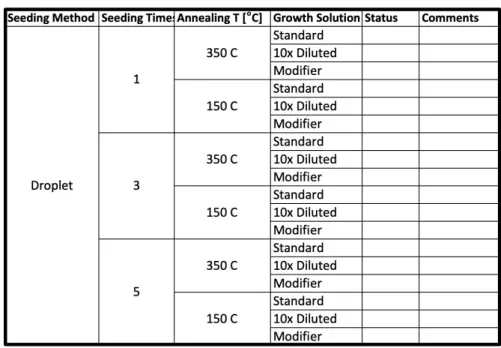
Taking this as the base procedure, variations will be made to certain parameters to test what effects they have on the zinc oxide nanorod structure. By performing boiling test on the base procedure and looking at how the structures vary on each iteration of the modified procedure, we will be able to determine what the optimal structure should look like. The variation can be seen in the following Table 2.
Table 2: Variation test matrix for zinc oxide fabrication on zircaloy, copper and titanium.
The Parameters that will be varied are the number of times the surface was seeded, the annealing temperature, and concentration of the growth solution and the use of the growth modifier vitamin C.
Through controlling the concentration of the growth solution, the overall density of the nanostructures on the surface will be controlled. If the concentration of solution 2 is reduced by a factor of 10 the overall number of nanoparticles that can form the structure is also reduced by a factor of 10. This we expect to result in much lower density.
In the hope of being able to control the aspect ratio of the nanorods to optimize the probability that the structures remain upright, Vitamin C will be used. The idea to use vitamin C, which is also known at L-ascorbic acid, was derived from the work of Cho et al. [31]. The study shows that with increasing concentration of vitamin C, axial growth of nanorods becomes severely inhibited allowing for more radial expansion.
All the aforementioned modifications to the fabrication procedure were done at the growth step. Before this point, other changes will be tested such as the varying the annealing temperature and the number of times the surface is seeded. At the end of all these iterations, a significant part of results aim to truly understand what control we have on the surface structure morphology by controlling specific parameters.
3.3. Flow Boiling Setup
A critical part of the research is to evaluate the performance of zinc oxide nanostructures on the CHF enhancement. Alongside gaining a deeper understanding of the fabrication process, the standard fabrication will be tested in flow boiling using the capabilities described in Ref. [32]. The fabrication will be done on a sapphire substrate with a coating of titanium and gold pads, as well as on a Zircaloy substrate
Both configurations allows for the use of the Phantom V2512 high-speed camera to visually study the nucleation of bubbles on the surface. The sapphire-titanium configuration allows also the use of the high speed IRC806 infrared camera to measure time-dependent temperature and heat flux distributions on the surface. Electrical heating is provided using a function generator set to increasing power inputs with a dwell time between each step to allow the system to reach steady state. Post-processing data from the IR camera using a Matlab based algorithm [33] enables us to determine time and spatial dependent temperature and heat flux up to the point of CHF .
The exact layout of the flow loop is detailed in Ref [32]. An image of the flow loop schematic is displayed in Figure 3.
\
3.4. Test Matrix
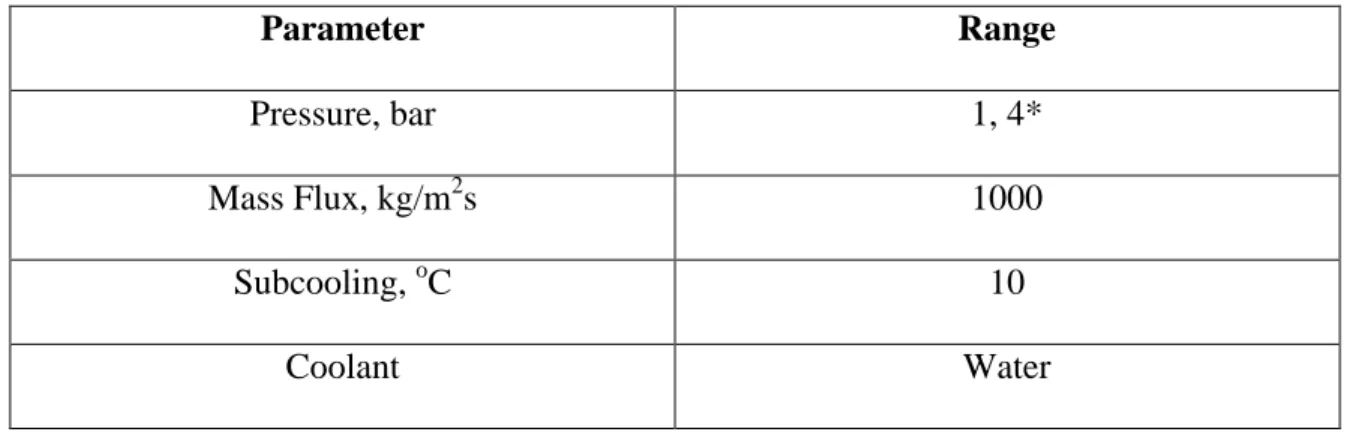
The test matrix for the study is displayed in Table 3. Flow boiling tests at atmospheric pressure will be performed on two different substrates, i.e., a sapphire substrate, enabling infrared thermometry measurements, and a Zircaloy substrate, mimicking the actual nuclear reactor cladding. The results of the CHF will then be compared to that of a plane surface to see if there is enhancement. Tests will also be done on a Zircaloy surface to see if it confirms the results obtained on sapphire heaters. The effect of pressure will also be investigated by conducting flow boiling experiments at 4 bar with the sapphire-titanium heaters.
The following section will summarize the results of the fabrication test as well as that of the boiling experiments
Table 3: Test matrix for flow boiling experiments on sapphire and zircaloy substrates (* additional tests on titanium surface at high pressure).
Parameter Range
Pressure, bar 1, 4*
Mass Flux, kg/m2s 1000
Subcooling, oC 10
Chapter 4
Results and Analysis
Given that the focus of this study is to see how varying parameters in the fabrication process affected the nanostructures, we will begin by discussing the results from this.
4.1. Copper Fabrication
The base fabrication was tested on a copper substrate due to its low cost to procure and how simple it was to sand the surface for the next run. However, a major obstacle encountered is coppers accelerated oxidation at the elevated temperature of 350oC at which the annealing of the seed particles is done. An example of the surface appearance post oxidation can be seen in Figure 4.
Figure 4: Oxidized copper flaking after removal from 350 oC furnace due to formation of copper oxides. The samples are 2cm by 2cm.
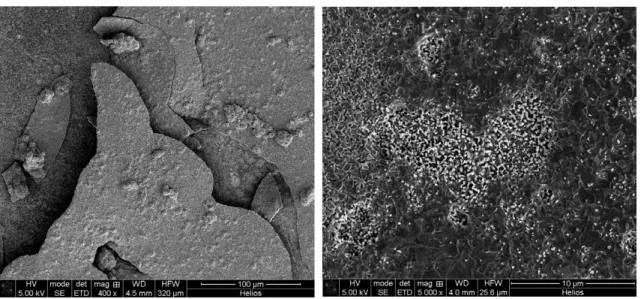
As seen, the process of annealing initiated the formation of black copper oxide flakes that would easily peel away from the surface. This would take away the seed layer with it exposing a fresh surface for the zinc oxide nanowires to grow randomly without seed particles to begin nucleation. Evidently, this is bad for a procedure that aims to have reproducibility and an isotropic surface from which effects on boiling can be determined. Looking at the SEM images, we can see just how rough and randomly distributed the structures are on the surface as seen in Figure 5.
Figure 5: SEM images of non-uniform copper surface with zinc oxide due to copper oxide formations at high temperatures
Given these results, copper, as a test substrate was set aside and all further fabrications were done on zircaloy surfaces, which did not exhibit this negative flaking behavior.
4.2. Seed Solution Appearance
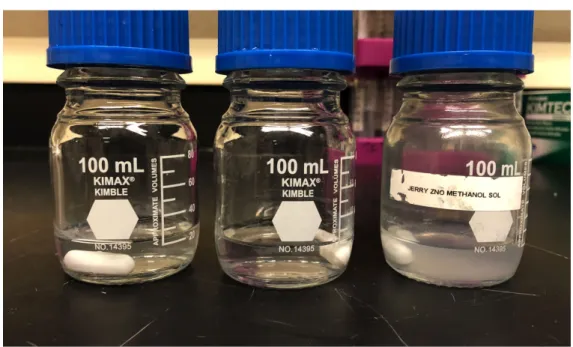
When preparing the seed solution to begin the seeding process, an unpredictable behavior in regards to the solutions color was noticed. Initially the solution would take on a white/foggy appearance indicating the formation of the zinc oxide nanoparticles.
However, at times the solution would be completely transparent as can be seen in Figure 6.
Figure 6: Optical variation in seed solution appearance with same composition
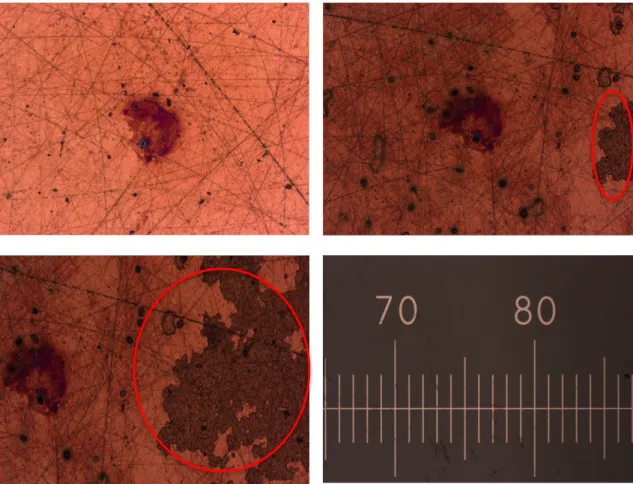
To test if the zinc oxide nanoparticles were still present and confirm what was observed was a simple visual effect two experiments were conducted. First, a plain surface was cleaned thoroughly to remove any debris or chemicals. The surface was then seeded multiple times without drying and placed under an optical microscope. If the particles were present they would be observed moving in the solution and over time would aggregate and form an agglomeration which would be easily observed. Indeed such a result was observed as can be seen in Figure 7.
Figure 7: Unseeded cleaned copper surface (top left) and seeded copper surface (top right & bottom left) to determine seed presence in solution. Red circles indicate seed particles. Ticks on scale bar are 1mm apart (bottom right)
The second test involved dividing a clean surface into four quadrants and seeding each 0,1,5,10 times to see if there was any effect on the final structure (see Figure 8). With this, we expected that by introducing more overall seed concentration we would increase the nucleation sites and therefore have a much more dense structure. Looking at the surface post seeding, we see a yellow/brown discoloration of the surface which normally has blue color after the zircaloy is annealed. This indicates the presence of foreign particles that we believed to be the zinc oxide nano particles. Furthermore, looking into the SEM images after the growth process, it becomes apparent that as we increase the seeding amount (i.e., the number of times that the surface is seeded), the
structures become denser and eventually have more structures growing on top of the base level ones. This result is confirmed by SEM images shown in Figure 9, and helps to conclude that despite the variation in appearance, there are still seed particles in the solution, which can be used for further procedures.
Figure 8: Discoloration showing presence of particles coming out of solution despite being transparent. Zircaloy substrate is 2cm by 2cm. No seed (top left), 1 seed (top right), 5 seed (bottom left) and 10 seed (bottom right)
Figure 9: SEM images showing growing density in zinc oxide nanorods with increasing times the surface is seeded. No seed (top left), 1 seed (top right), 5 seed (bottom left) and 10 seed (bottom right)
4.3. Pool Seeding
Another parameter that was initially going to be varied is the method in which the seeding is done. The standard procedure calls for applying the solution to the surface for a set amount of time and rinsing with methanol before drying with N2 gas. The concern with this is the drying process which if done by hand cannot be necessarily be replicated from fabrication to fabrication. In an attempt to remedy this, the pool seeding procedure was designed. In it, a steel plate sits on top of a hotplate to allow for uniform conduction and then the substrate is placed on the metal plate. The surface is seeded and remains untouched until all the solution evaporates leaving the seed particles, which is then placed
in the furnace to be annealed. However, as can be seen in SEM images Figure 10, the seed particles tend to aggregate in this case and are not uniform. They are extremely dense and lay on top of each other creating a surface with multiple pockets prior to growth. That would yield structures that are not normal to the substrate. The same result is seen even when the surface is seeded just once. As a result, the pool seeding method was abandoned and led the project to stick with the standard seeding method moving forward.
Figure 10: SEM images displaying thick non-uniform seed layer resulting from the pool seeding method.
4.4. Substrate Orientation and Temperature Dependence During Growth Cycle
Based on literature review [30], it became apparent that keeping the oil/water bath around 90oC during the ZnO nanowire growth stage was quintessential in ensuring the chemical reactions proceed unhindered in the right direction. In the initial test runs, the optimal set point for the hotplate to reach the appropriate oil bath temperature was not well defined. This led to fluctuations in temperature that would put it over 100oC and sometimes even
below 90oC if not well monitored throughout the entire 3 hours of growth. Looking at the SEM images displayed in Figure 11 shows the effect on the nanostructure. In this particular case, the sample was also left in the growth solution at an angle. The deeper end of the surface tended to have more of the rod like structures (left figure) while the end that was farther up had a flower like structure (right figure) that was completely different from what was expected. This effect was attributed to the fact that the solution did not reach a stable temperature and so the part that was higher up was at a lower temperature than 90oC causing the formation of unwanted structures while the end that was deeper and warmer did have the nanorods.
Figure 11: SEM images showing completely different zinc oxide structures resulting in temperature gradients in growth solution below 90oC (right) and higher temperatures (left).
Interesting effects can also be seen on the other side of the spectrum where the temperature may be too high. Unlike the case where the temperature was too low, the structures maintain a rod like shape but there exist circular regions of low density rods distributed throughout the surface. Repeating the experiment at similar elevated
temperatures revealed the existence of bubbles that would nucleate on the surface but not depart since the surface of growth is facing downwards as seen in Figure 12.
Figure 12: Bubble formation on the surface of the zircaloy substrate facing the bottom of the beaker.
As a result, the bubble would stay on the surface for extended periods of times preventing access of the growth solution to the area. The region would see less zinc oxide nanoparticles and as a result would have less nucleation yielding significantly less dense regions. The SEM images can be seen in Figure 13. It was easily concluded that the elevated temperatures and lack of thermal equilibrium in the bath created an environment for temperatures to spike and nucleate a bubble giving the emergent phenomenon.
Figure 13: SEM images showing circular regions of low-density nanostructures due to formation of bubbles during the growth process at high temperatures
The best solution to this problem was to allow the temperature of the bath to come to an appropriate temperature and be allowed to reach a point where the oscillations would end. Only at this point could the growth solution with the substrate be added to the bath. It is important that the steady state temperature of the bath be a couple degrees above the required temperature due to the inevitable fact that the addition of the growth solution in its own beaker would bring down the temperature a couple of degrees. The initial steady state temperature of the bath was then set to be around 95oC before growth solution is added so it does not fall below 90oC at any point during the growth procedure. Also, to try and keep the entire surface at around the same temperature, it is important that the substrate be parallel to the bottom of the beaker to eliminate any gradients in temperature that may exist along the height of the beaker.
4.5. Fabrication of nano-engineered cladding surfaces
Moving forward, the next step was to complete the fabrication process on zircaloy. As discussed before, the standard procedure in which the surface is seeded 5 times, annealed at 350 oC and grown in the standard concentration growth solution was executed first.
After the substrate was taken out, it appeared to have uniform coverage of a white layer on top of the zircaloy that was the zinc oxide. SEM images revealed that there was a uniform, very dense distribution of nanorods over the surface (see Figure 14, top left). The nanostructures push up against each other not leaving much space for subcooled water to flow through and wet the surface during boiling.
Figure 14: SEM images of standard procedure (top left), use of vitamin C growth modifier (top right) and x10 concentration reduce growth solution (bottom).
In an attempt to try and reduce the density of the nanorods on the surface the growth solution concentration was reduced by a factor of 10. By significantly reducing the concentration of nanoparticles that can interact with the surface, the rate of growth as well as the nucleation sites for the nanorods is reduced. When the substrate was taken
out of the growth solution it was uniformly covered again but appeared less white and almost translucent so the color of the zircaloy can still be observed behind the zinc oxide layer. Examining under the SEM revealed structures that were grass like with much more space between the rods (see Figure 14, bottom). The density was reduced but since the rods were much thinner, they became less orthogonal to the substrate and raised the concern of detaching during the boiling process.
To remedy the issue of the nanostructures having a low aspect ratio, the modifier compound of L-ascorbic acid/vitamin-C was utilized (see Figure 14, top right). When introduced in concentrations of around 0.125mM, it retards the axial growth while allowing radial growth by adsorbing vitamin-C particles to axial (top) surface of the nanorods. This increases the aspect ratio and produces nanorods that are much thicker and orient themselves orthogonally with the substrate surface. This is useful because even though the top right image in Figure 12 seems tightly packed, it is possible to adjust the concentration of growth solution to vitamin-C modifier to increase the aspect ratio and the spacing between each rods. This iteration helped to confirm the effects the modifier can have on the nanostructure. By controlling these 3 parameters we have been able to effectively control the nanostructure of zinc oxide on the zircaloy substrate. The resulting SEM images from the three fabrications can be seen in Figure 12.
Moving forward, the rest of the test matrix involved the variation of the temperature at which annealing was done and the number of times the surface was seeded. These were tested while systematically varying the 3 growth parameters to see the result of each permutation. The results produced a general trend that can be summarized as follows:
• As the annealing temperature is reduced, it produces fewer structures on the final fabricated surface. This is likely due to the fact that at lower temperatures, the bond between the seed particles and the surface is weaker making them detach from the zircaloy substrate with agitation. This reduces nucleation sites during the growth process leading to fewer structures.
• As the number of times the substrates surface was seeded goes down, the density of nanorods is reduced due to the presence of less nucleation sites for the structures to grow from.
• Reducing the overall concentration of the growth solution gave a less dense nanostructure but also resulted in a low aspect ratio giving grass like structures that were not preferentially oriented normal to the surface. This is likely due to the fact that the nanorods exhibit a preference to grow more axially than in the radial direction. By reducing the concentration, this preference still exist and we see even less radial growth of the nanorods yielding the grass like structure. The thin nano grass structure bends away from the vertical direction due to the convective motion of water in the growth solution.
• The addition of vitamin C as a growth modifier allowed for correction of the low aspect ratio and orientation of nanorods making the nanostructure more dense but overall populated with less individual rods since they are much thicker. The vitamin C bonds to the axial tip inhibiting growth in the normal direction. This leaves more particles to increase the radial growth making the rods thicker.
The summary of each individual case can be seen in Table 4. The results that yielded the worse surface distribution tended to have low seeding numbers as well as low
temperatures at which the substrate was annealed. SEM images for all the cases can be found in the appendix.
Table 4: Description of results from each fabrication procedure done on zircaloy.
4.6. Flow Boiling on Zinc Oxide Nano-Engineered Surfaces
The next step is to test the performance of the zinc oxide nano engineered surfaces in flow boiling to see if it produces CHF enhancement. Previous test were done at atmospheric pressure but only in a pool boiling design. The major contribution here is to see what effects forced fluid flow convection heat transfer has on the CHF value. As mentioned before, the substrate is a sapphire base with coated titanium boiling surface and gold pads to conduct the current. On the titanium film, zinc oxide was fabricated with the standard procedure. The optical image of the fabricated surfaces can be seen in Figure 15. Flow boiling test at 1 bar were conducted on both the sapphire-titanium and zircaloy engineered surfaces to see what effects zinc oxide have on CHF in a flow boiling scenario. Additionally, a 4 bar test on the sapphire titanium heater was done to see how the engineered surface may affect CHF at higher-pressure. For details on the construction
of the zircaloy and titanium sapphire heaters see Ref. [32]. To see how heat flux and temperature is extrapolated from the data, see Ref. [33].
Figure 15: Clean sapphire heater coated in titanium with gold pads (left). Same heater with zinc oxide fabricated on top
Each boiling test was done with a mass flux of 1000 kg/m2s and a subcooling of 10°C. The sample was placed in a cartridge holder and had an electrical current run through it until CHF was achieved which was determined visually on the infrared camera output. CHF values for each condition are displayed in Table 5. The boiling curve for each experiment is seen in figure 16.
Table 5: CHF results on pure and coated titanium and zircaloy surfaces with enhancement
1 bar 4 bar
CHF (MW/m2)
Enhancement (%)
CHF (MW/m2)
Enhancement (%)
Ti 3.38 3.192
Ti-ZnO
4.47 32.2 5.49 72%
Zr 2.695
Zr-ZnO
3.18 18.0
Figure 16: Boiling curves on titanium and zircaloy at 1 bar and titanium at 4 bar.
Here we see enhancement in CHF for surfaces that have been coated with the zinc oxide nanostructures. We believe that this enhancement is due to changes in bubble size, bubble nucleation site density and bubble frequency [34]. Compared to plain surfaces and surfaces with LBL coating, ZnO tends to have higher values (see figure 17-19).
Figure 17. NSD as a function of applied heat flux at 1 bar (left) and 4 bar (right).
Figure 18. Bubble frequency as a function of applied heat flux at 1 bar (left) and 4 bar (right).
Figure 19. NSD as a function of wall superheat at 1 bar (left) and 4 bar (right).
We hypothesize that a large amount of small and rapidly departing bubbles observed on the nano-engineered surfaces are what primarily gives us CHF enhancement. Under these conditions, the nano-engineered surfaces can delay the formation of spanning vapor patches and consequently enhance the critical heat flux limit.
Furthermore, the change in cavity size distribution is the reason for the different effects of nanostructures on HTC at 1 bar and 4 bar. Fig. 19 shows the NSD at the two pressures. At 1 bar, the ITO surface starts to nucleate earlier. According to classical nucleation models [35], the superheat required to nucleate a cavity is inversely proportional to its size:
r!~ 2σT!"#
ρ!h!"#∆T!"#
Therefore, at relatively low superheats, large cavities will nucleate first. From Fig. 19 we can estimate the onset of nucleate boiling (ONB) cavity size on ITO to be around 1 µm in comparison to the smaller than 500nm cavities seen on zinc oxide nanostructures in Fig. 14. When the zinc oxide nanowires cover the plain surfaces, they fill some of the
large cavities and create many small ones. As a result, the nano-engineered surfaces do not have the large cavity sizes to nucleate at lower superheats. However, Fig. 19 does show that as the wall superheat increases, the nano-engineered surface nucleates more than ITO. This happens because the coatings create smaller imperfections in the range of the active cavity size. At 4 bar, the scenario is different. At 1 bar, when the wall superheat is ~30°C, cavities larger than 1 µm can be activated. For the same wall superheat, at 4 bar, all cavities larger than 300 nm can nucleate. While the nano-engineered surfaces may not have many cavities larger than 1 µm, they have more cavities around 300 nm than the plain ITO. Thus, at 4 bar, the nano-engineered surfaces have a higher NSD from the onset of nucleate boiling (Fig. 19 right). That explains the enhancement of boiling heat transfer coefficient and CHF at high pressure.
Similarly, the same effect can be observed on the polished and zinc oxide covered zircaloy surfaces. Even though the surface of zircaloy may be polished, there still exist scratches and imperfections that can be on the order of microns all over the surface. On the zinc oxide coated zircaloy surfaces, the scale of the cavities is still around 300nm. Effectively, this suppresses the nucleation on the zinc oxide covered surface in comparison to the plain zircaloy surface at lower superheats. As the superheat increases, smaller cavities becomes active and the nucleation site density on the zinc oxide covered surfaces exceeds that on the plain surface improving the heat transfer coefficient and CHF.
Each experiment was carried out to the point of CHF at least two times on the same surface and produced the same CHF value after post processing. This shows the durability of the zinc oxide coating when subjected to such high temperatures and
heatflux. Furthermore, experiments were repeated on entirely different heaters and also provided similar CHF values which goes to support the repeatability of the experiment from the growth of the nanostructures to the flow boiling experiment.
Chapter 5
Conclusion
In this study, the objectives were to investigate variations to the zinc oxide fabrication procedure and to test the nanostructures performance in flow boiling.
With the fabrication process presented in this research, ensuring to keep the annealing temperature at 350oC, growth solution temperature above 90oC and the number of times the surface is seeded above 3 times helps in the production of uniform structures that strongly adhere to the surface of the heater. Uniformity in the heater is important for testing conditions and ensuring we obtain similar pore sizes across the surface. The most effective means for controlling the spread between the rods as well as each individual rods thickness would be the combination of varying the final growth solutions concentration in combination with modifiers like vitamin C to allow for preferential growth in one direction. Adding controlled variations to the procedure and seeing the effect on the final structure would help to provide understanding as to how to manipulate nanostructures to conform to desired geometries for testing in various conditions. By testing the nanostructures performance in a boiling setup, it would help to validate theoretical models and take steps in the right direction for the improvement of the performance of fission nuclear reactor systems.
In regards to performance during flow boiling, zinc oxide gave overall CHF enhancement from the plain substrate being zircaloy as well as nano-smooth titanium
nucleation sites especially at higher pressures as well as increase the rate of bubble departures enhancing the heat transfer coefficient during the nucleate boiling process. This helps in preventing the formation of irreversible vapor patches and delaying the onset of CHF.
For future work, it would prove interesting to investigate the performance of nano-engineered surfaces in higher pressures on zircaloy surfaces all the way up to PWR conditions to see if the trend continues to extrapolate further and if the coating remains durable at such extreme conditions. Coupled with the fabrication procedure, structures of varying pore sizes can be constructed to optimize the overall enhancement that can be observed.