EMC
Storage Analytics
Version 2.1
Installation and User Guide
300-014-858Published December, 2013
EMC believes the information in this publication is accurate as of its publication date. The information is subject to change without notice.
The information in this publication is provided as is. EMC Corporation makes no representations or warranties of any kind with respect to the information in this publication, and specifically disclaims implied warranties of merchantability or fitness for a particular purpose. Use, copying, and distribution of any EMC software described in this publication requires an applicable software license.
EMC², EMC, and the EMC logo are registered trademarks or trademarks of EMC Corporation in the United States and other countries. All other trademarks used herein are the property of their respective owners.
For the most up-to-date regulatory document for your product line, go to EMC Online Support (https://support.emc.com). For documentation on EMC Data Domain products, go to the EMC Data Domain Support Portal (https://my.datadomain.com).
EMC Corporation
Hopkinton, Massachusetts 01748-9103
1-508-435-1000 In North America 1-866-464-7381 www.EMC.com
5 7 Introduction 9 Overview... 10 References... 11 Terminology... 11
Installation and licensing 13 Installation overview... 14
Installation requirements... 16
Installing vCenter Operations Manager for EMC Storage... 19
Installing the EMC Adapter and dashboards... 20
Adapter instances... 21
Adding an EMC Adapter instance for vCenter... 21
Adding EMC Adapter instances for your storage system...24
Editing EMC Adapter instances for your storage system...27
EMC Storage Analytics Dashboards 29 Topology mapping...30
VNX Block topology...31
VNX File topology... 32
VMAX topology...33
VMAX topology rules... 34
EMC dashboards... 35
Storage Topology dashboard...35
Storage Metrics dashboard... 38
VNX Overview dashboard... 40
VMAX Overview dashboard... 42
Topology dashboards...44
Metrics dashboards... 47
Top-N dashboards...49
Dashboard XChange...52
Resource Kinds and Metrics 53 Resource Kinds... 54 VNX Block metrics... 55 VNX File metrics... 63 VMAX metrics...69 Troubleshooting 73 Launching Unisphere... 74 Installation logs... 74 Tables Figures Chapter 1 Chapter 2 Chapter 3 Chapter 4 Chapter 5
Error handling and event logging... 75
Viewing error logs... 75
Creating and downloading a support bundle... 76
Editing the Collection Interval for a resource...78
Frequently Asked Questions - General... 79
Frequently Asked Questions for VNX...83
Frequently Asked Questions for VMAX... 85 87 Index
Installation and Upgrade options...15
VNX Block metrics for Array...55
VNX Block metrics for Storage Processor...55
VNX Block metrics for FAST Cache...56
VNX Block metrics for Pool LUN...57
VNX Block metrics for RAID Group LUN... 58
VNX Block metrics for RAID Group... 59
VNX Block metrics for Storage Pool... 60
VNX Block metrics for Tier... 61
VNX Block metrics for Disk...62
VNX File metrics for Array... 63
VNX File metrics for Data Mover... 63
VNX File metrics for dVol...67
VNX File metrics for File Pool...67
VNX File metrics for File System... 67
VMAX metrics for Storage Group... 69
VMAX metrics for Device... 69
VMAX metrics for Thin Pool ... 70
VMAX metrics for Front-End Director ...70
VMAX metrics Front-End Port ...70
VMAX metrics SRDF Director ...70
VMAX metrics Remote Replica Group ... 70 1 2 3 4 5 6 7 8 9 10 11 12 13 14 15 16 17 18 19 20 21 22
EMC adapter architecture...10
VNX Block topology... 31
VNX File topology...32
VMAX topology... 33
Storage Topology dashboard... 36
Storage Metrics dashboard...38
VNX Overview dashboard...40
VMAX Overview...42
Example of VNX Topology dashboard...45
Example of VMAX Topology dashboard... 46
Example of VNX Metrics dashboard... 47
Example of VMAX Metrics dashboard...48
Example of VMAX Top-5 Devices... 49
Example of Top-5 VNX File Systems...50
Example of Top-5 VNX LUNs...51
Dashboard XChange... 52
Example of launching to Unisphere...74
Log Content... 76
Status shows: Resource down... 80
Workload shows: No Data...81
VM Resources shows: ?...82 1 2 3 4 5 6 7 8 9 10 11 12 13 14 15 16 17 18 19 20 21
Introduction
This chapter contains the following topics.
u Overview... 10 u References... 11 u Terminology... 11
Overview
VMware® vCenter Operations Manager is a software product that collects performance and capacity data from monitored software and hardware resources. It provides users with real‐time information about potential problems in the enterprise.
vCenter Operations Manager presents data and analysis in several ways: u Through alerts that warn of potential or occurring problems.
u In configurable dashboards and predefined pages that show commonly needed information.
u In predefined reports.
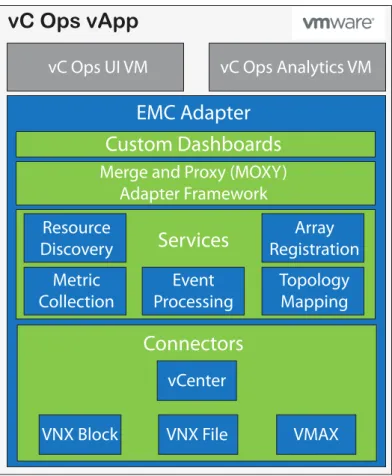
EMC® Storage Analytics links vCenter Operations Manager with an EMC Adapter. The adapter is bundled with a connector that enables vCenter Operations Manager to collect performance metrics. The adapter is installed with the vCenter Operations Manager user interface.
The connector types are shown in Figure 1 on page 10.
EMC Storage Analytics leverages the power of existing vCenter features to aggregate data from multiple sources and process the data with proprietary analytic algorithms.
Figure 1 EMC adapter architecture
VNX Block
Connectors
Metric
Collection
Event
Processing
Topology
Mapping
Services
Resource
Discovery
Array
Registration
Merge and Proxy (MOXY)
Adapter Framework
Custom Dashboards
EMC Adapter
vC Ops Analytics VM
vC Ops UI VM
vC Ops vApp
vCenter
VNX File
VMAX
References
This topic provides a list of vCenter Operations Manager documentation. VMware vCenter Operations Manager documentation includes:
u vCenter Operations Manager Release Notes . Contains descriptions of known issues and workarounds.
u vCenter Operations Manager vApp Deployment and Configuration Guide . Explains installation, deployment, and management of vCenter Operations Manager.
u vCenter Operations Manager Getting Started Guide. Explains basic features and use of vCenter Operations Manager.
u vCenter Operations Manager Administration Guide. Describes how to configure and manage the vCenter Operations Manager custom interface.
u vCenter Operations Manager Adapter Guide . Provides information on how vCenter Operations Manager uses adapters to consume data from the enterprise.
VMware documentation is available at http://www.vmware.com/support/pubs.
Terminology
This topic contains a list of commonly used terms. adapter
A vCenter Operations Manager component that collects performance metrics from an external source like a vCenter or storage system. Third-party adapters such as the EMC Adapter are installed on the vCenter Operations Manager server to enable creation of adapter instances within vCenter Operations Manager.
adapter instance
A specific external source of performance metrics, such as a specific storage system. An adapter instance resource is an instance of an adapter that has a one-to-one relationship with an external source of data, such as a VNX storage system. dashboard
A tab on the home page of the vCenter Operations Manager GUI. vCenter Operations Manager ships with default dashboards. Dashboards are also fully customizable by the end user.
health rating
An overview of the current state of any resource, from an individual operation to an entire enterprise. vCenter Operations Manager checks internal metrics for the resource and uses its proprietary analytics formulas to calculate an overall health score on a scale of 0 to 100.
metric
A category of data collected for a resource. For example, the number of read operations per second is one of the metrics collected for each LUN resource. resource
Any entity in your environment for which vCenter Operations Manager can collect data. For example, LUN 27 is a resource.
resource kind
A general type of a resource, such as LUN or DISK. The resource kind dictates the type of metrics collected.
Installation and licensing
This chapter contains the following topics.
u Installation overview... 14
u Installation requirements... 16
u Installing vCenter Operations Manager for EMC Storage... 19
u Installing the EMC Adapter and dashboards... 20
u Adapter instances... 21
Installation overview
EMC Storage Analytics 2.1 consists of two installation packages. The two packages are:
u vCenter Operations Manager for EMC Storage u EMC Adapter
vCenter Operations Manager for EMC Storage is a storage only version of vCenter Operations Manager 5.8 developed specifically for EMC storage customers. Installation instructions are in the vCenter Operations Manager vApp Deployment and Configuration Guide at http://www.vmware.com/support/pubs/vcops-pubs.html.
Licensing depends on which version of the vCenter Operations Manager you have installed:
u VMware issues the license for vCenter Operations Manager Advanced and Enterprise versions.
u EMC issues the license for vCenter Operations Manager for EMC Storage. NOTICE
If you have vCenter Operations Manager Advanced or Enterprise versions with a VMware-issued license, do not install the EMC-VMware-issued license for vCenter Operations Manager; installing the EMC-issued license restricts vCenter Operations Manager to storage-only mode.
A 90-day trial license is available with EMC Storage Analytics 2.1 for all supported products. The 90-day trial license provides the same features as a permanent license, but after 90 days of usage, the adapter stops collecting data. You can add a permanent license at any time.
The EMC Adapter collects metrics from resources. It supports vCenter Operations Manager for EMC Storage and the VMware vCenter Operations Manager Advanced and Enterprise versions. EMC Adapter 2.1 supports vCenter Operations Manager versions 5.7.1 and higher.
The adapter installation includes:
u Installing the adapter and dashboards.
u Configuring the adapter instances with licensing.
Installing the EMC Adapter and dashboards on page 20 provides installation instructions. The adapter is licensed when Adding EMC Adapter instances for your storage system on page 24 or Editing EMC Adapter instances for your storage system on page 27.
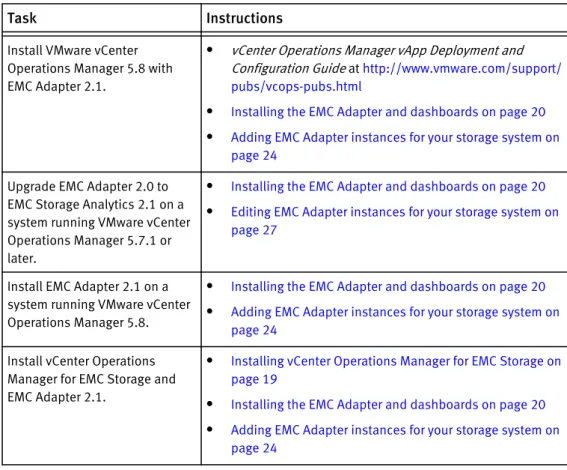
Table 1 on page 15 lists the installation and upgrade options for different vCenter Operations Manager and the EMC Adapter combinations. To perform an installation or upgrade, refer to the instructions for the task that matches your objective.
Table 1 Installation and Upgrade options
Task Instructions
-
-Install VMware vCenter Operations Manager 5.8 with EMC Adapter 2.1.
l vCenter Operations Manager vApp Deployment and
Configuration Guide at http://www.vmware.com/support/ pubs/vcops-pubs.html
l Installing the EMC Adapter and dashboards on page 20 l Adding EMC Adapter instances for your storage system on
page 24
Upgrade EMC Adapter 2.0 to EMC Storage Analytics 2.1 on a system running VMware vCenter Operations Manager 5.7.1 or later.
l Installing the EMC Adapter and dashboards on page 20 l Editing EMC Adapter instances for your storage system on
page 27
Install EMC Adapter 2.1 on a system running VMware vCenter Operations Manager 5.8.
l Installing the EMC Adapter and dashboards on page 20 l Adding EMC Adapter instances for your storage system on
page 24
Install vCenter Operations Manager for EMC Storage and EMC Adapter 2.1.
l Installing vCenter Operations Manager for EMC Storage on
page 19
l Installing the EMC Adapter and dashboards on page 20 l Adding EMC Adapter instances for your storage system on
page 24
Installation requirements
Before installing the EMC Adapter, verify that hardware and software component compatibility requirements are satisfied.
EMC Adapter requirements
Supported vCenter Operations Manager version u vCenter Operations Manager 5.7.1 and higher u vCenter Operations Manager for EMC Storage
EMC Storage Analytics requires vCenter Operations Manager Advanced or Enterprise editions. EMC Storage Analytics does not support vCenter Operations Manager Foundation and Standard editions.
Note
vCenter Operations Manager 5.7.1 and higher is supported with EMC Adapter 2.1, but vCenter Operations Manager 5.8 is recommended.
Deploy the vApp for vCenter Operations Manager before installing the EMC Adapter. Check the vCenter Operations Manager vApp Deployment and Configuration Guide at http://www.vmware.com/support/pubs/vcops-pubs.html for system requirements pertaining to your version of vCenter Operations Manager. The deployment
instructions for vCenter Operations Manager 5.8 apply to vCenter Operations Manager for EMC Storage.
Supported VNX series (1st generation) u VNX5100 u VNX5300 u VNX5500 u VNX5700 u VNX7500 u VG2 u VG8
Supported VNX series (2nd generation) u VNX5200 u VNX5400 u VNX5600 u VNX5800 u VNX7600 u VNX8000
Supported CX series u CX4-120 u CX4-240 u CX4-480 u CX4-960 Supported NS series u NS120 u NS480 u NS960
Supported VMAX series u VMAX (all models) u VMAXe
u VMAX 10K u VMAX 20K u VMAX 40K Supported web browser
u Internet Explorer 8 or 9. u Firefox 10.0 or later.
u Google Chrome version 19 or later. VNX Block systems
The EMC Adapter uses naviseccli to collect metrics from VNX Block systems. It is
bundled into the EMC Adapter install file and is automatically installed along with the adapter. Storage processors require IP addresses that are reachable from the vCenter Operations Manager server. Bidirectional traffic for this connection flows through port 443 (HTTPS). Statistics logging must be enabled on each storage processor (SP) for metric collection (System > System Properties > Statistics Logging in Unisphere).
VNX File systems
CLI commands issued on the Control Station direct the EMC Adapter to collect metrics from VNX File systems. The Control Station requires an IP address that is reachable from the vCenter Operations Manager server. Bidirectional ethernet traffic flows through port 22 using Secure Shell (SSH). If you are using the EMC VNX
nas_stig script for security (/nas/tools/nas_stig), do not use root in password
credentials. Setting nas_stig to ON limits direct access for root accounts, preventing the adapter instance from collecting metrics for VNX File. SMI-S Provider for VMAX requirements
The EMC SMI-S Provider for VMAX must be on the network and accessible through port 5988 (non-secure port) or port 5989 (secure port) for communication. If the SMI-S Provider is also used for vSMI-Sphere vSMI-Storage API for SMI-Storage Awareness (VASMI-SA), follow the recommendations in the SMI-S Provider Release Notes to increase the number of available connections. The user configured in the EMC Adapter instance and connecting to the SMI-S instance must have the role of monitor or administrator.
VMAX software requirements
VMAX software requirements include Enginuity 5876 or higher and Solutions Enabler 7.6.1 (for SMI-S Provider) or higher.
Minimum OE requirements
Platform Supported OE versions
-
-VNX 1st generation series Block:
l R31 - 05.31.000.5.727 and higher l R32 - 05.32.000.5.006 and higher File:
l 7.0.546 and higher l 7.1.47.5 and higher
VNX 2nd generation series Block: R33 - 05.33.000.5.015 and higher File: 8.1.0.15 and higher
CX4 series R30 04.30.000.5.004 and higher NS series 6.0.40-0 and higher
User accounts
To create an EMC Adapter instance for a storage array, you must have a user account that allows you to connect to the storage array or SMI-S Provider. For example, to add an EMC Adapter for a VNX array, use a global account with operator or administrator role (a local account will not work).
To create an EMC Adapter instance for vCenter (where Adapter Kind = EMC Adapter and Connection Type = VMware vSphere), you must have an account that allows you access to vCenter and the objects it monitors. In this case, vCenter enforces access
credentials (not the EMC Adapter). To create an EMC Adapter instance for vCenter, use, at minimum, an account assigned to the Read-Only role at the root of vCenter, and enable propagation of permissions to descendant objects. Depending on the size of the vCenter, wait approximately 30 seconds before testing the EMC Adapter. More information on user accounts and access rights is available in the vSphere API/SDK Documentation available at: http://pubs.vmware.com/vsphere-51/ index.jsp?topic=%2Fcom.vmware.wssdk.pg.doc%2FPG_Authenticate_Authorize. 8.3.html.
DNS configuration
To use the EMC Adapter, the vCenter Operations Manager vApp requires network connectivity to the storage systems to be monitored. DNS must be correctly
configured on the vCenter Operations Manager server to enable hostname resolution by the EMC Adapter.
Time zone and synchronization settings
Ensure time synchronization for all EMC Storage Analytics resources by using Network Time Protocol (NTP). Also, set correct time zones for EMC Storage Analytics resources (including the SMI-S Provider if using an adapter for VMAX) and related systems. Failure to observe these practices may affect the collection of performance metrics and topology updates.
Installing vCenter Operations Manager for EMC Storage
If no vApp for vCenter Operations Manager is deployed, install the vCenter Operations Manager for EMC Storage.
Before you begin Pre-requisites:
u Obtain the OVA installation package for vCenter Operations Manager 5.8 from VMware or vCenter Operations Manager for EMC Storage.
u Obtain a vCenter Operations Manager for EMC Storage license key. u Obtain a copy of the vCenter Operations Manager vApp Deployment and
Configuration Guide at http://www.vmware.com/support/pubs/vcops-pubs.html. To deploy the vApp for vCenter Operations Manager, refer to the vCenter Operations Manager vApp Deployment and Configuration Guide .
Procedure
1. Review the System Requirements.
2. Follow instructions in Installing vCenter Operations Manager.
When assigning the vCenter Operations Manager license, type the vCenter Operations Manager for EMC Storage license from the EMC Storage Analytics Software Key Card. 3. Conclude the installation with Verifying the vCenter Operations Manager Installation.
Installing the EMC Adapter and dashboards
Before you begin
Pre-requisites: Obtain the PAK file for the EMC Adapter.
Note
If using Internet Explorer, the installation file downloads as a ZIP file but functions the same way as the PAK file.
WARNING
Upgrading EMC Storage Analytics overwrites the standard dashboards. To customize a standard dashboard, clone it, rename it, and then customize it.
To install the adapter and dashboards: Procedure
1. Save the PAK file in a temporary folder.
2. Start the vCenter Operations Manager administrative user interface in your web browser and log in as administrator.
For example, http://<vCOPs_ip_address>/admin 3. On the Update tab, click Browse to locate the adapter PAK file. 4. Click Update.
The status of the update process appears in the bottom pane.
Note
Installation of the PAK file can take several minutes or longer depending on the amount of metric data that already exists in the vCenter Operations Manager
database. The vCenter Operations Manager will restart services following installation of the PAK file.
Adapter instances
The vCenter Operations Manager requires an adapter instance for each resource to be monitored. The instance specifies the type of adapter to use and the information needed to identify and access the resource.
With EMC Storage Analytics, the vCenter Operations Manager uses EMC Adapter instances to identify and access the resources, such as:
u Adapter instance for vCenter u Adapter instance for the VNX File u Adapter instance for the VNX Block u Adapter instance for VMAX
The adapter instance for vCenter is a prerequisite for other adapter instances. If this adapter is not configured, other adapter instances will function normally but will not display visible connections between the VMware objects and the array objects.
Note
After adapter instances are created, the vCenter Operations Manager Collector requires several minutes to collect statistics, depending on the size of the storage array
configuration. Large configurations can take up to 45 minutes to collect metrics and resources and update dashboards. This is a one-time event; future statistical collections run quickly.
Adding an EMC Adapter instance for vCenter
For users to traverse health trees from the virtual environment into the storage
environment, EMC Storage Analytics requires you to install an EMC Adapter instance for vCenter. All storage system adapter instances require the EMC Adapter instance for vCenter, which you must add first.
To add an EMC Adapter instance for vCenter: Procedure
1. Start the vCenter Operations Manager custom user interface and log in as admin. For example in a web browser, type: http://<vCOPs_ip_address>/vcops-custom
2. Select Environment > Configuration > Adapter Instances. 3. Click the Add New Adapter Instance icon.
The Add Adapter Instance screen appears. 4. Set the following:
Collector vCenter Operations Standard Server Adapter Kind EMC Adapter
Adapter Instance Name Any descriptive name. For example, My vCenter. Management IP IP address of the vCenter server.
Array ID (optional) This field must be blank for VMware vSphere connection type. Connection Type VMware vSphere
License (optional) Leave blank. Not applicable for EMC Adapter instance for vCenter. Log Level Configure log levels for each adapter instance. The four levels for
logging information are ERROR, WARN, INFO, and DEBUG. ERROR
The ERROR level logs only error conditions. The ERROR level provides the smallest amount of logging information. WARN
The WARN level logs information when an operation completes successfully but there are issues with the operation.
INFO
The INFO level logs information about workflow. It describes how an operation occurs.
DEBUG
The DEBUG level logs all details related to an operation. This level is the highest level of logging. If logging is set to DEBUG, all other levels of logging information are displayed in the log file. Credential Select any previously defined credentials for this storage system,
otherwise click Add.
The Add Credential screen appears with the Adapter Kind set to EMC Adapter. 5. Set the following:
Credential kind Password Credentials
Instance name Any descriptive name. For example, My VMware Credentials. Username Username that EMC Storage Analytics uses to connect to the VMware vCenter
system.
If a domain user is used, the format for the username is DOMAIN\USERNAME. Password Password for the EMC Storage Analytics username on the VMware vCenter
6. Click OK.
The Add Adapter Instance screen reappears.
7. To test the adapter instance, click Test.
If the connection is correctly configured, a confirmation box appears. 8. Click OK.
The new adapter instance polls for data every 5 minutes by default. At every interval, the adapter instance will collect information about the VMware vSphere datastore and virtual machines with Raw Device Mapping (RDM). Consumers of the registered VMware service can access the mapping information.
To edit the polling interval, select Environment > Environment Overview > Resource Kinds > EMC Adapter Instance > All Atrributes. Select the EMC Adapter instance and click the Edit Resource icon.
Adding EMC Adapter instances for your storage system
Before you begin Pre-requisites:
u Install the EMC Adapter for vCenter
u Obtain the adapter license key for your storage system
Each storage system requires an adapter instance. All storage system adapter instances require the EMC Adapter instance for vCenter. Add the EMC Adapter instance for vCenter first. Then add the adapter instances for each storage system. Adapter instances are licensed per array.
Note
A VNX Unified array can use the same license for VNX File and VNX Block. Procedure
1. Start the vCenter Operations Manager custom user interface and log in as administrator.
For example in a web browser, type: http://<vCOPs_ip_address>/vcops-custom
2. Select Environment > Configuration > Adapter Instances. The Manage Adapter Instances screen appears. 3. Click the Add New Adapter Instance icon.
4. Set the following:
Field Value to enter
-
-Collector vCenter Operations Standard Server Adapter Kind EMC Adapter
Adapter Instance Name Any descriptive name. For example, My Storage System or the array ID.
License (optional) License key required for the array. Verify that the license is for the array you want to monitor.
Log Level Configure log levels for each adapter instance. The four levels for logging information are ERROR, WARN, INFO, and DEBUG. ERROR
The ERROR level logs only error conditions. The ERROR level provides the smallest amount of logging information. WARN
The WARN level logs information when an operation completes successfully but there are issues with the operation.
INFO
The INFO level logs information about workflow. It describes how an operation occurs.
DEBUG
The DEBUG level logs all details related to an operation. This level is the highest level of logging. If logging is set to DEBUG, all other levels of logging information are displayed in the log file. Credential Select any previously defined credentials for this storage system,
otherwise, click Add.
Field VNX Block VNX File VMAX
- - -
-Management IP Use the IP address of one Storage Processor (SP) in a single array. Do not add an adapter instance for each SP.
Use the IP address of the primary Control Station.
Use the IP address of the configured SMI-S Provider.
Array ID (optional)
Not applicable Not applicable Required with prefixed zeros. Example: 000195901003 Connection Type VNX Block (use for VNX
Block and CX4 arrays)
VNX File (use for VNX File/Unified models, VG gateways, and NS models)
VMAX (use for VMAX models)
The Add Credential screen appears with the Adapter Kind set to EMC Adapter. 5. Set the following:
Field Value to enter
-
-Adapter kind EMC Adapter. Retain the setting. Credential kind Password Credentials.
Instance name Any descriptive name. For example, Default Credentials.
Username Username that EMC Storage Analytics uses to connect to the storage system. l For VNX File, use the credentials of the Control Station.
l For VNX Block, use the credentials of the Storage Processors. l For VMAX, use the credentials of an ECOM user with monitor or
administrator privileges. The default user/password combination is admin/#1Password.
Password Password for the EMC Storage Analytics username on the storage system. 6. Click OK.
The Add Adapter Instance screen reappears.
7. Click Test to validate the values you entered.
If the adapter instance is correctly configured, a confirmation box appears.
NOTICE
Testing an adapter instance validates the values you entered. Failure to do this step causes the adapter instance to change to the red (warning) state if you enter invalid values and do not validate them.
Editing EMC Adapter instances for your storage system
Before you begin Pre-requisites:
u Install the EMC Adapter
u Configure the EMC Adapter instance for your storage system u Obtain an adapter license key for your storage system
The EMC Adapter instances for storage systems require licenses. Adapter instances are licensed per storage array. A VNX Unified array can use the same license for VNX File and VNX Block.
Procedure
1. Start the vCenter Operations Manager custom user interface and log in as administrator.
For example in a web browser, type: http://<vCOPs_ip_address>/vcops-custom
2. Select Environment > Configuration > Adapter Instances. The Manage Adapter Instances screen appears.
3. Select the row of an EMC Adapter instance (Adapter Kind is EMC Adapter), and click the Edit Selected Adapter Instance icon.
The Edit Adapter Instance screen appears.
4. Add the license from the EMC Storage Analytics Software Key Card. The EMC Adapter instance license key is issued for the storage system. Verify that the Management IP is for the same array model specified on the key card.
5. To test the configuration, click Test.
If the adapter instance is correctly configured, a confirmation box appears. 6. To finish editing the adapter instance, click OK.
EMC Storage Analytics Dashboards
This chapter contains the following topics.
u Topology mapping...30 u EMC dashboards... 35
Topology mapping
Topology mapping is viewed and traversed graphically using vCenter Operations Manager health trees. The dashboards developed for EMC Storage Analytics utilize topology mapping to display resources and metrics.
EMC Storage Analytics establishes mappings between: u Storage system components
u Storage system objects and vCenter objects
Topology mapping enables health scores and alerts from storage system components, such as storage processors and disks, to appear on affected vCenter objects, such as LUNs, datastores, and VMs. Topology mapping between storage system objects and vCenter objects uses a vCenter adapter instance.
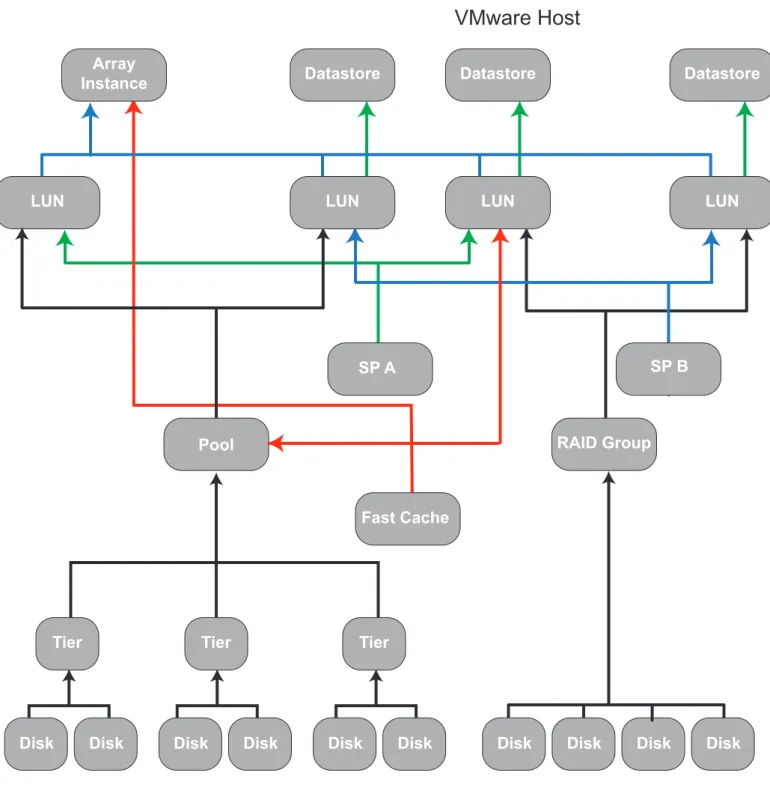
VNX Block topology
EMC Storage Analytics implements the following topology for VNX Block. Figure 2 VNX Block topology
VMware Host
Array Instance Pool Fast Cache Datastore Datastore SP A Tier RAID Group LUN Datastore LUN Tier Disk Disk Disk Disk Disk Disk Disk Disk Disk Disk Tier SP B LUN LUN VNX Block topology 31VNX File topology
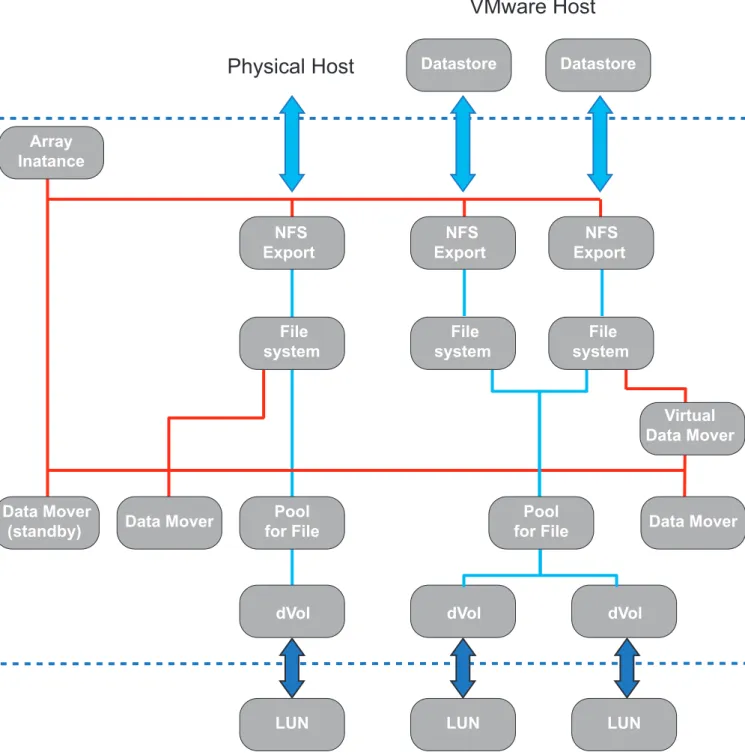
EMC Storage Analytics implements the following topology for VNX File. Figure 3 VNX File topology
Physical Host
VMware Host
Array Inatance Pool for File LUN Virtual Data Mover Datastore Datastore Data Mover(standby) Data Mover
dVol Data Mover dVol dVol LUN LUN NFS Export NFS Export NFS Export File system File system File system Pool for File
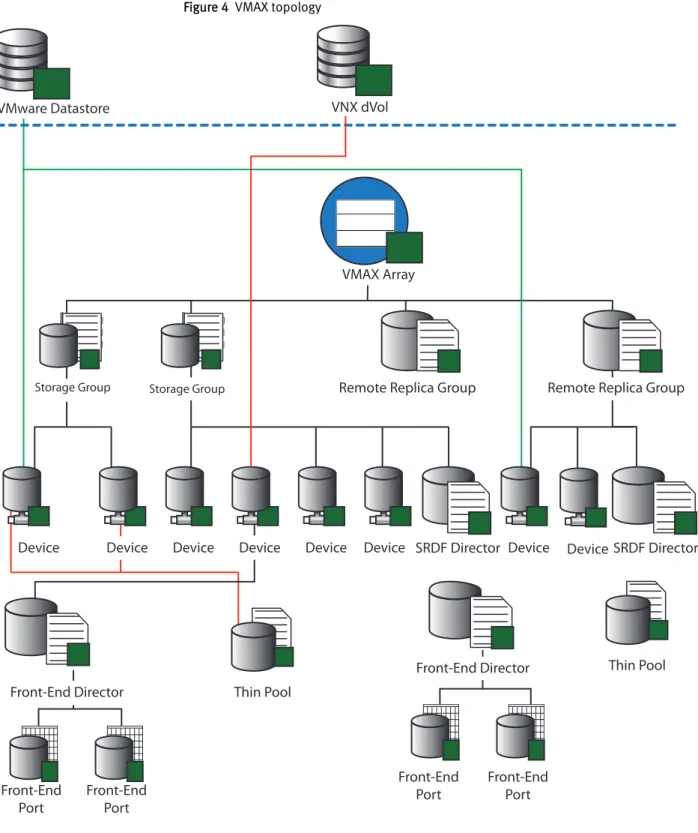
VMAX topology
EMC Storage Analytics implements the following topology for VMAX. Figure 4 VMAX topology
VMAX Array
Front-End Port
Remote Replica Group
Thin Pool VMware Datastore VNX dVol
Thin Pool Front-End Port Front-End Port Front-End Port SRDF Director SRDF Director Device Device Device
Remote Replica Group
Storage Group Storage Group
Device
Device Device Device
Front-End Director Front-End Director
Device
VMAX topology rules
The following rules govern how objects are displayed in the VMAX topology dashboard and which metrics are collected for them.
u vCenter Operations Manager does not display devices that are unmapped and unbound.
u vCenter Operations Manager does not display devices that are mapped and bound but unused by VMware or VNX. Performance metrics for these devices are aggregated into the parent Storage Group performance metrics.
u If the corresponding EMC vSphere adapter instance is running on the same vCenter Operations Manager appliance, then the vCenter Operations Manager displays devices that are mapped, bound, and used by VMware datastores or RDMs. u If the corresponding EMC VNX File adapter instance is running on the same vCenter
Operations Manager appliance, then the vCenter Operations Manager displays devices that are mapped, bound, and used by VNX File Disk Volumes.
u vCenter Operations Manager does not display Storage Groups with unmapped and unbound devices.
u vCenter Operations Manager displays Storage Groups that contain mapped and bound devices, and their metrics are aggregates of the member devices.
EMC dashboards
Use dashboards to view metrics.
The standard dashboards are delivered as templates - if a dashboard is accidentally deleted or changed, you can generate a new one. EMC Storage Analytics includes these EMC dashboards: u Storage Topology u Storage Metrics u VNX Overview u VMAX Overview u Topology dashboards u Metrics dashboards u Top-N dashboards
You can use the standard vCenter Operations Manager dashboard customization features to create additional dashboards that are based on your site requirements.
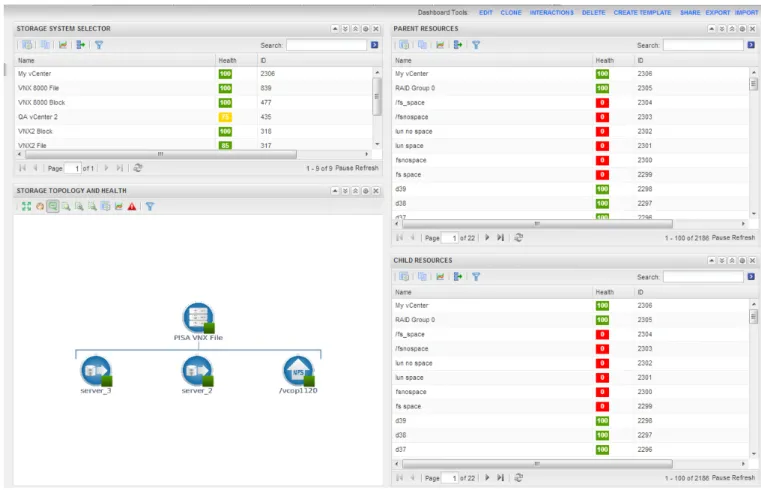
Storage Topology dashboard
The Storage Topology dashboard provides an entry point for viewing resources and relationships between storage and virtual infrastructure objects.
Click the Storage Topology tab. Details for every object in every widget are available by selecting the object and clicking the Resource Detail icon at the top of each widget circled in red in Figure 5 on page 36.
The Storage Topology dashboard contains the following widgets: Storage System Selector
This Resource widget filters the EMC Adapter instances that are found in each storage system. To populate the Storage Topology and Health widget, select an instance name.
Storage Topology and Health
This Health Tree widget provides a navigable visualization of resources and virtual infrastructure resources. Single-click to select resources, or double-click to change the navigation focus. To populate the Parent Resources and Child Resources widgets, select a resource in this widget.
Parent resources
This widget lists the parent resources of the resource selected in the Storage Topology and Health widget.
Child resources
This widget lists the child resources of the resource selected in the Storage Topology and Health widget.
Storage Metrics dashboard
The Storage Metrics dashboard displays resource and metrics for storage systems and allows the user to view graphs of resource metrics.
Figure 6 Storage Metrics dashboard
The Storage Metrics dashboard contains the following widgets: Storage System Selector
This Resource widget lists all configured EMC Adapter instances. To populate the Resource Selector widget, select an instance name.
Resource Selector
This Health Tree widget lists each resource associated with the adapter instance selected in the Storage System Selector. To populate the Storage System Selector widget, select a resource.
Metric Selector
This widget lists all the metrics that are collected for the resource selected in the Resource Selector widget. The search feature of this widget allows users to locate specific objects. Double-click a metric to create a graph of the metric in the Metric Graph widget.
Metric Graph
This widget graphs the metrics selected in the Metric Selector widget. Display multiple metrics simultaneously in a single graph or in multiple graphs.
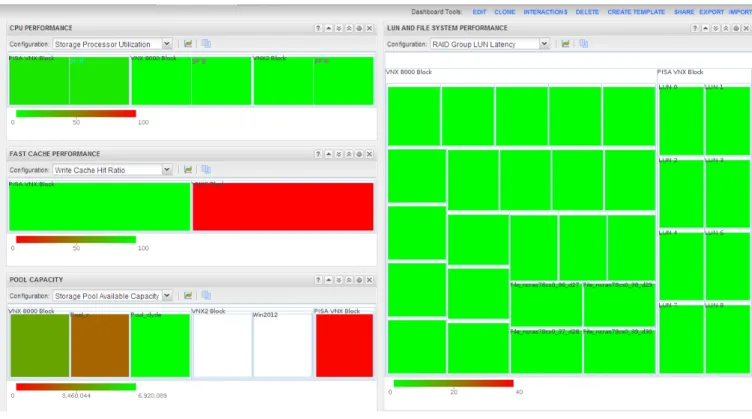
VNX Overview dashboard
This collection of heat maps provides a single view of the performance and capacity for all VNX resources with configured adapter instances. Heat maps on this dashboard group the contents by adapter instance.
Figure 7 VNX Overview dashboard
The VNX Overview dashboard displays the following heat maps: CPU performance
This displays the CPU Utilization, such as % busy, of each Storage Processor and Data Mover on each configured adapter instance. The color of the heat map entries shows % busy:
u Green indicates 0% busy. u Red indicates 100% busy. FAST cache performance
This has two modes: Read Hit Ratio and Write Hit Ratio. To select the mode, use the Configuration menu. The Read/Write Cache Hit Ratio (%) is the number of FAST Cache read or write hits divided by the total number of read or write I/Os across all RG LUNs and Pools configured to use FAST Cache. The color of the heat map entries shows hit ratios:
u Green indicates a high FAST Cache hit ratio.
u Red indicates a low FAST Cache hit ratio. A low value on an idle array is acceptable.
u Grey indicates that there is no FAST Cache present on the VNX systems identified by the adapter instances and a Heat Map not configured message appears with the heat map.
Pool capacity
This has four modes: RAID Group Available Capacity, Storage Pool Capacity Utilization, Storage Pool Available Capacity, and File Pool Available Capacity. In Capacity Utilization mode, the color of the heat map entries shows the value of the % full metric for all non-RAID Group storage pools:
u Green indicates 0% full. u Red indicates 100% full.
In Available Capacity mode, the color of the heap map entries shows the value of the Available Capacity (GB) metric:
u Green indicates the largest available capacity on any storage pool for any of the configured adapter instances.
u Red indicates 0 GB available. LUN and file system performance
This has several modes.
In LUN Utilization mode, the color of the heat map entries show the % busy metric for all LUNs grouped by adapter instance:
u Green indicates 0% busy. u Red indicates 100% busy.
In RAID Group LUN Latency mode, the color of the heat map entries shows the value of the Latency (ms) metric:
u Green indicates 0 ms latency.
u Red indicates 20 ms or greater latency and is configurable.
Latency values appear for RAID Group LUNs. Pool LUNS appear in white with no latency values reported.
In LUN Read IOPs mode, the color of the heat map entries shows the relative number of read IO operations per second serviced by the LUN. The color ranges from light green to dark green. Dark green indicates the highest number of read IO operations per second serviced by any LUN listed in the heat map.
In LUN Write IOPS mode, the color of the heat map entries shows the relative number of write IO operations per second serviced by the LUN. The color ranges from light green to dark green. Dark green indicates the highest number of write IO operations per second serviced by any LUN listed in the heat map.
In File System Read IOPs mode, the color of the heat map shows the relative number of read IO operations per second serviced by the file system. The color ranges from light green to dark green. Dark green indicates the highest number of read IO operations per second serviced by any file system listed in the heat map.
In File System Write IOPS mode, the color of the heat map entries shows the relative number of write IO operations per second serviced by the file system. The color ranges from light green to dark green. Dark green indicates the highest number of write IO operations per second serviced by any file system listed in the heat map.
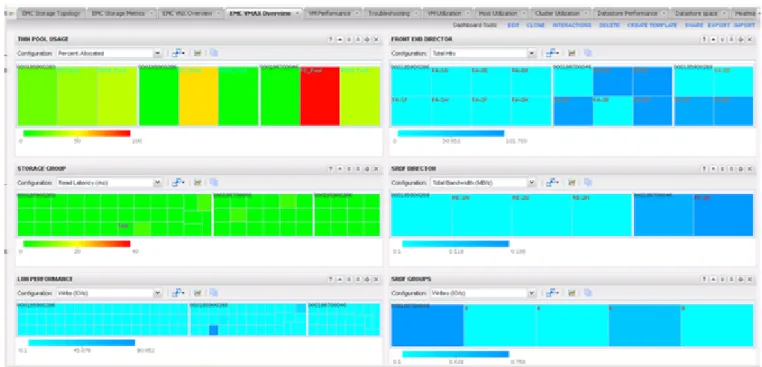
VMAX Overview dashboard
This collection of heat maps provides a single view of the performance and capacity for all VMAX resources with configured adapter instances. Heat maps on this dashboard group the contents by adapter instance.
Figure 8 VMAX Overview
The VMAX Overview dashboard displays the following heat maps. For each heat map and selected metric, the configured VMAX Adapter is shown:
Thin Pool Usage
This heat map displays the Percent Allocated metric. Percent Allocated displays the allocated capacity in each thin pool. The color of the heat map entries ranges from green to red and corresponds to the percent allocated as follows:
u Green indicates that 0% of the thin pool is allocated. u Yellow indicates that 50% of the thin pool is allocated. u Red indicates that 100% of the thin pool is allocated. Storage Group
This has four modes: Total Reads (IO/s), Total Writes (IO/s), Read Latency (ms), and Write Latency (ms).
Total Reads and Writes represent the aggregate reads or writes for all LUNs in the storage group. Write and Read Latency is the average write or read latency of all LUNs in the storage group.
For Total Reads and Writes, the color of the heat map entries shows the relative number of total reads or writes across all the storage groups. The color ranges from light blue to dark blue. Dark blue indicates the storage group(s) with the highest number of total reads or writes while light blue indicates the lowest. Because the range of values for total reads or writes has no lower or upper limits, the numerical difference between light and dark blue may be very small.
EMC recommends adjusting the scale appropriately. The color of the heat map entries ranges from green to red as follows:
u Green indicates a latency of 0ms. u Yellow indicates a latency of 20ms. u Red indicates a latency of 40ms. LUN Performance
This has four modes: Reads (IO/s), Writes (IO/s), Read Latency (ms), and Write Latency (ms).
Reads and Writes represent the total reads or writes for a particular LUN. Read and Write Latency is the average read or write latency of all LUNs in the storage group. For Reads and Writes the color of the heat map entries shows the relative number of reads or writes across all the LUNs. The color ranges from light blue to dark blue. Dark blue indicates the LUN(s) with the highest number of reads or writes while light blue indicates the lowest. Because the range of values for reads or writes has no lower or upper limits, the numerical difference between light and dark blue may be very small.
For Read and Write Latency the color of the heat map entries ranges from green to red and is based on a scale of latency from 0 to 40ms. This scale is a based on average customer requirements and may not represent a customer's particular requirements for latency. In such cases EMC recommends adjusting the scale appropriately. The color of the heat map entries range from green to red as follows: u Green indicates a latency of 0ms.
u Yellow indicates a latency of 20ms. u Red indicates a latency of 40ms. Front End Director
This has two modes: Total Bandwidth (MB/s) and Total Operations (IO/s). Total Bandwidth is the cumulative amount of data transferred over all ports of the front-end director. Total Operations is the total number of operations taking place over all ports of a front-end director.
The color of the heat map entries is the same for both metrics. It shows the relative total bandwidth or relative total number of operations, depending on the selected metric. The color ranges from light blue to dark blue. Dark blue indicates the front-end director(s) with the highest number of total operations or the greatest total bandwidth, depending on the selected metric. Light blue indicates the lowest number of operations or the least total bandwidth. Because the range of values for operations or bandwidth has no lower or upper limits, the numerical difference between light and dark blue may be very small.
SRDF Director
This has two modes: Total Bandwidth (MB/s) and Total Writes (IO/s).
Total Bandwidth is the cumulative amount of data transferred over an SRDF director. Total Writes is the total number of writes over an SRDF director.
The color of the heat map entries is the same for both metrics. It shows the relative total bandwidth or relative total number of writes, depending on the selected metric. The color ranges from light blue to dark blue. Dark blue indicates the SRDF
director(s) with the highest number of total writes or the greatest total bandwidth, depending on the selected metric. Light blue indicates the lowest number of writes or the least total bandwidth. Because the range of values for bandwidth or writes
has no lower or upper limits, the numerical difference between light and dark blue may be very small.
SRDF Groups
This has four modes: Devices in Session (count), Average Cycle Time (ms), Writes (IO/s), and Writes (MB/s).
Devices in Session represents the number of devices in an SRDF session in the SRDF group. The Average Cycle Time is an SRDF/A metric that provides the average elapsed time between data transfer cycles. Writes (IO/s) represents the number of writes per second on the devices in the SRDF group. Writes (MB/s) represents the number of megabytes per second sent from the SRDF group.
The color of the heat map entries is the same for all metrics. It shows the relative devices in session, average cycle time, total bandwidth, or the relative number of writes, depending on the selected metric. The color ranges from light blue to dark blue. Dark blue indicates the SRDF group(s) with the highest number of one these metrics and light blue indicates the lowest number of one of these metrics. Because the range of values has no lower or upper limits, the numerical difference between light and dark blue may be very small.
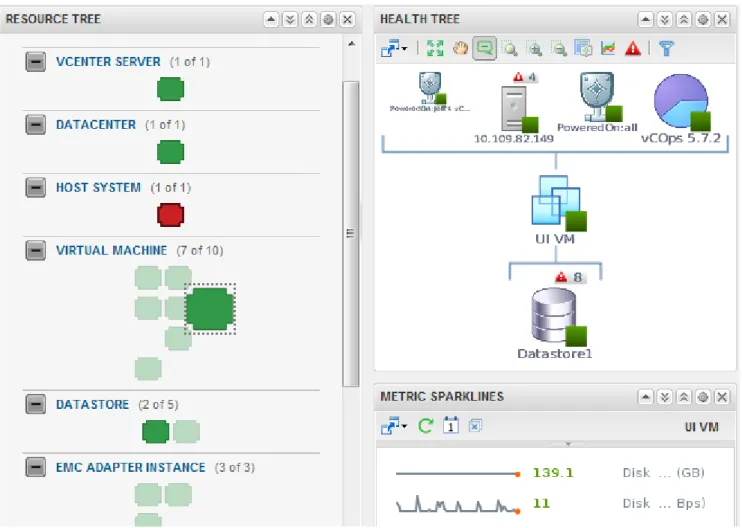
Topology dashboards
The topology dashboards provide an entry point for viewing resources and relationships between storage and virtual infrastructure objects for VNX and VMAX adapter instances. Click the VNX Topology or VMAX Topology tab, depending on the EMC adapter instance you installed. Details for every object in every widget are available by selecting the object and clicking the Resource Detail icon at the top of each widget as shown.
Figure 9 Example of VNX Topology dashboard
The topology dashboards contain the following widgets: Resource Tree
This widget shows the end-to-end topology and health of resources across vSphere and storage domains. You can configure the hierarchy that is shown by changing the widget settings; changing these settings does not alter the underlying object relationships in the database. Select any resource in this widget to view related resources in the stack.
Health Tree
The Health Tree widget provides a navigable visualization of resources that have parent or child relationships to the resource you select in the Resource Tree widget. Single-click to select resources, or double-click to change the navigation focus. Metric Sparklines
This widget shows sparklines for the metrics of the resource you select in the Resource Tree widget.
Metrics dashboards
The metrics dashboards display resources and metrics for VNX or VMAX storage systems and allows the user to view graphs of resource metrics.
Figure 11 Example of VNX Metrics dashboard
Figure 12 Example of VMAX Metrics dashboard
The metrics dashboards contain the following widgets: Resource Tree
This widget shows the end-to-end topology and health of resources across vSphere and storage domains. You can configure the hierarchy that is shown by changing the widget settings; changing these settings does not alter the underlying object relationships in the database. Select any resource in this widget to view related resources in the stack.
Metric Selector
This widget lists all the metrics that are collected for the resource you select in the Resource Tree widget. Double-click a metric to create a graph of the metric in the Metric Graph widget.
Metric Graph
This widget graphs the metrics you select in the Metric Selector widget. Display multiple metrics simultaneously in a single graph or in multiple graphs.
Top-N dashboards
Top-N dashboards enable you to view your top performers at a glance. The number of objects in your top performer list is configurable. Top-N dashboards are available for VNX and VMAX systems as shown in these examples.
Figure 13 Example of VMAX Top-5 Devices
Figure 15 Example of Top-5 VNX LUNs
By default, the dashboard shows the top 5 devices in the following categories across all of your VNX or VMAX systems:
u Top-5 by Read (IO/s) u Top-5 by Write (IO/s) u Top-5 by Read (MB/s) u Top-5 by Write (MB/s) u Either:
l Top-5 by Read Latency (ms) for VMAX Top-5 Devices dashboard
l Top-5 by Consumed Capacity for Top-5 VNX LUNs or Top-5 VNX File Systems dashboards
Top performers are selected based on the current value of the associated metric that you configured for each widget. You can change the time period.
You can also configure each widget on the dashboard to show more than 5 top performers in your environment.
Dashboard XChange
The Dashboard XChange is a user community page for users to exchange EMC Storage Analytics custom dashboards.
EMC Storage Analytics provides a set of default dashboards that provide you with a variety of functional views into your storage environment. EMC Storage Analytics also enables you to create custom dashboards that allow you to visualize collected data according to your own requirements. The Dashboard XChange is an extension of that feature that enables you to:
u Export custom dashboards to the Dashboard XChange to benefit a wider EMC Storage Analytics community
u Import custom dashboards from the Dashboard XChange to add value to your own environment
The Dashboard XChange, hosted on the EMC Community Network, will also host
dashboards designed by EMC to showcase widget functions that may satisfy a particular use-case in your environment. You can import these dashboards into your existing environment to enhance the functionality offered by EMC Storage Analytics. You can also edit imported dashboards to meet the specific requirements of your own storage
environment.
The Dashboard XChange, shown in Figure 16 on page 52, provides the following resources to assist you in creating custom dashboards:
u How-to video that shows how to create custom dashboards
u Best practices guide that provides detailed guidelines for dashboard creation u Slide show that demonstrates how to import dashboards from or export them to the
Dashboard XChange Figure 16 Dashboard XChange
The EMC Storage Analytics Dashboard XChange is available at https://
Resource Kinds and Metrics
This chapter contains the following topics.
u Resource Kinds... 54 u VNX Block metrics... 55 u VNX File metrics... 63 u VMAX metrics...69
Resource Kinds
Metrics collected in the vCenter Operations Manager are grouped by Resource Kind.
Resource Kinds for VNX Block
EMC Storage Analytics includes the following Resource Kinds for VNX Block: u EMC Adapter Instance
u Storage Processor u FAST Cache u Pool LUN u RAID Group LUN u RAID Group u Storage Pool u Tier
u Disk
Resource Kinds for VNX File
EMC Storage Analytics includes the following Resource Kinds for VNX File: u EMC Adapter Instance
u Data Mover u Virtual Data Mover u dVol
u NFS Export u File Pool u File System
Resource Kinds for VMAX
u EMC Adapter Instance u Storage Group u Device u Thin Pool
u Front-End Director u Front-End Port
u Remote Replica Group u SRDF Director
VNX Block metrics
EMC Storage Analytics includes the following metrics for VNX Block with one table for each Resource Kind.
Table 2 VNX Block metrics for Array
Metric Additional information
-
-Elapsed collect time (ms) Time elapsed during the collection. New metrics in each collect call Number of new metrics per collection. New resources in each collect call Number of new resources per collection.
Number of down resources Number of down resources for this adapter instance. Number of metrics collected Number of metrics collected by this adapter instance. Number of resources collected Number of resources collected by this adapter
instance. Table 3 VNX Block metrics for Storage Processor
Metric Additional information
-
-Writes (IO/s) The number of writes per second at the time when the SP is polled. that is passed through the SP per second. Smaller requests usually result in a higher write throughput than larger requests.
Writes (MB/s) The average write request size in megabytes that passes through the SP per second. Larger requests usually result in higher bandwidth than smaller requests.
Reads (IO/s) The average number of host read requests that is passed through the SP per second. Smaller requests usually result in a higher read throughput than larger requests.
Reads (MB/s) The average amount of host read data in megabytes that is passed through the SP per second. Larger requests usually result in a higher bandwidth than smaller requests. Busy (%) The percentage of time during which the SP is serving
requests. When the SP becomes the bottleneck, the utilization will be at or close to 100%. And increase in workload will have no further impact on the SP throughput, but the I/O response time will start increasing more aggressively.
Write Cache Flushes (MB/s) The average amount of data in megabytes that was written from the write cache to the disks per second. The value is a measure of back-end activity.
Dirty Cache Pages (%) The amount of dirty cache pages by percentage. This metric is for 1st generation VNX models (see Supported VNX series (1st generation) on page 16 for list of supported VNX models). Dirty Cache Pages (MB) The amount of dirty cache pages in megabytes. This metric is
for 2nd generation VNX models (see Supported VNX series
Table 3 VNX Block metrics for Storage Processor (continued)
Metric Additional information
-
-(2nd generation) on page 16 for list of supported VNX models).
Read Cache Size (MB) The size of the read cache in megabytes. This metric is only for 1st generation VNX models (see Supported VNX series (1st generation) on page 16 for list of supported VNX models). Read Cache State The enabled or disabled state of the read cache.
Write Cache Size (MB) The size of the write cache in megabytes. This metric is only for 1st generation VNX models (see Supported VNX series (1st generation) on page 16 for list of supported VNX models). Write Cache State The enabled or disabled state of the write cache.
Read Cache Hit Ratio (%) The ratio of read requests that the SP Cache satisfied without requiring any disk access versus the total number of read requests.
Write Cache Hit Ratio (%) The ratio of write requests that the SP Cache satisfied without requiring any disk access versus the total number of write requests.
Table 4 VNX Block metrics for FAST Cache
Metric Additional information
-
-Current Operation Creating or Destroying.
Current Operation Status If there is a current FAST Cache operation in progress such as destroying or creating, this displays the percentage complete.
Mode Read/Write.
RAID Type The RAID Type of FAST Cache. Size (GB) The capacity of FAST Cache.
Dirty (%) Appears in the Performance > SPA and Performance > SPB metric groups.
Percentage of write cache pages owned by the SP that contain data that has not yet been flushed out to the FAST Cache. Flushed (MB) Appears in the Performance > SPA and Performance > SPB metric
groups.
The average amount of data in megabytes that was written from the write cache to the FAST Cache.
Read Cache Hit Ratio (%) The ratio of read requests that the FAST Cache satisfied without requiring any disk access versus the total number of read requests. The higher the ratio the better the read performance. Read Cache Hits (Hits/s) Average number of read requests per second that were satisfied
Table 4 VNX Block metrics for FAST Cache (continued)
Metric Additional information
-
-Read Cache Misses (Misses/s) Average number of read requests per second that required one or multiple disk accesses.
Write Cache Hit Ratio (%) The ratio of write requests that the FAST Cache satisfied without requiring any disk access versus the total number of write requests. The higher the ratio the better the write performance. Write Cache Hits (Hits/s) Average number of write requests per second that were satisfied
by the FAST Cache without requiring any disk access. Write requests that are not FAST Cache hits are write misses. Write Cache Misses (Misses/s) Average number of write requests per second that required one
or multiple disk accesses. Current Operation Complete
(%)
If there is a current FAST Cache operation in progress such as destroying or creating, this displays the percentage complete. Table 5 VNX Block metrics for Pool LUN
Metric Additional information
-
-Performance Tier Distribution (%)
The distribution (%) of the Performance Tier. Extreme Performance Tier
Distribution (%)
The distribution (%) of the Extreme Performance Tier. Capacity Tier Distribution (%) The distribution (%) of the Capacity Tier.
Tiering Policy The tiering policy of this Pool LUN.
Initial Tier The initial tier that was used for initial placement of the new LUN.
Consumed Capacity (GB) The amount of space consumed in the pool by the LUN plus overhead.
User Capacity (GB) The amount of space consumed in the pool by the LUN.
Busy (%) Appears in the Performance > SPA and Performance > SPB metric groups.
The fraction of an observation period during which a LUN has any outstanding requests. When the LUN becomes the bottleneck, the utilization is at or near 100%. However, since the I/Os can be serviced by multiple disks, an increase in workload may still result in a higher throughput.
Queue Depth The length of the LUN queue.
Read Cache State The enabled or disabled state of the read cache. Write Cache State The enabled or disabled state of the write cache. Reads (IO/s) The average number of host read requests that is passed
through the LUN per second. Smaller requests usually result in a higher read throughput than larger requests.
Table 5 VNX Block metrics for Pool LUN (continued)
Metric Additional information
-
-Reads (MB/s) The average amount of host read data in Mbytes that is passed through the LUN per second. Larger requests usually result in a higher bandwidth than smaller requests.
Writes (IO/s) The average number of host write requests that is passed through the LUN per second. Smaller requests usually result in a higher write throughput than larger requests.
Writes (MB/s) The average amount of host write data in Mbytes that is passed through the LUN per second. Larger requests usually result in higher bandwidth than smaller requests.
Explicit trespasses Appears in the Performance > SPA and Performance > SPB metric groups.
Number of trespasses since the last poll. Default polling cycle is 5 minutes. Occurs as a result of an external command from a user or the failover software. When an SP receives this command, LUN ownership is transferred to that SP.
Implicit trespasses Appears in the Performance > SPA and Performance > SPB metric groups.
Number of trespasses since the last poll. Default polling cycle is 5 minutes. Occurs as a result of software controls within the storage system. An implicit trespass occurs when the amount of I/O transferred across the non-optimal path exceeds the optimal path I/O by a specified threshold.
Total Latency (ms) The average time, in milliseconds, that a request to this LUN is outstanding, including its waiting time.
Table 6 VNX Block metrics for RAID Group LUN
Metric Additional information
-
-Total Latency (ms) The average time in milliseconds, that it takes for one request to pass through the LUN, including any waiting time. The higher the queue length for a LUN, the more requests are waiting in its queue, thus increasing the average latency of a single request. For a given workload, queue length and response time are directly proportional.
Read Cache State The enabled or disabled state of the read cache. Write Cache State The enabled or disabled state of the write cache.
Reads (IO/s) The average number of host read requests that is passed through the LUN per second. Smaller requests usually result in a higher read throughput than larger requests.
Reads (MB/s) The average amount of host read data in Mbytes that is passed through the LUN per second. Larger requests usually result in a higher
Table 6 VNX Block metrics for RAID Group LUN (continued)
Metric Additional information
-
-Writes (IO/s) The average number of host write requests that is passed through the LUN per second.
Writes (MB/s) The average amount of host write data in Mbytes that is passed through the LUN per second.
Queue Depth The length of the LUN queue.
User Capacity The amount of space available in the RAID Group LUN.
Busy (%) Appears in the Performance > SPA and Performance > SPB metric groups. The fraction of an observation period during which a LUN has any outstanding requests. When the LUN becomes the bottleneck, the utilization is at or near 100%. However, since the I/Os can be serviced by multiple disks, an increase in workload may still result in a higher throughput.
Table 7 VNX Block metrics for RAID Group
Metric Additional information
-
-Full (%) Percentage of total capacity that is consumed. User Capacity (GB) The amount of space available in the RAID Group.
Raw Capacity (GB) The total amount of space available in the RAID Group prior to RAID protection.
Available Capacity (GB) The remaining free capacity of this RAID Group. Free Continuous Group of
Unbound Segments (GB)
Size in GB of the largest continuous span of free space in the RAID Group. LUNs must fit into a contiguous span of free space.
Disk Count Number of disks in this RAID Group. LUN Count Number of LUNs in this RAID Group.
Max Disks Maximum number of disks allowed for this RAID Group. Max LUNs Maximum number of LUNs allowed for this RAID Group. Defragmented (%) When a defragment operation in progress, this displays the
percentage complete.
Table 8 VNX Block metrics for Storage Pool
Metric Additional information
-
-Available Capacity (GB) Capacity available for use in this Storage Pool. Consumed Capacity (GB) Capacity used in this Storage Pool.
Disk Type Type of disks in this Storage Pool. Current Operation Displays the current operation in the pool.
Current Operation Complete (%) If there is a thin pool operation in progress such as a re-balance, this displays the percentage complete. Current Operation State Displays the current operation state.
Current Operation Status Displays additional descriptive information for the current state of the thin pool.
FAST Cache The enabled or disabled state of the FAST Cache for this Storage Pool.
Full (%) Percentage of total capacity that is consumed. Subscribed (%) Percentage of total capacity that is subscribed. Threshold (%) Threshold as percentage of total capacity. Oversubscribed (GB) How much the Storage Pool is oversubscribed. Disk Count Number of disks consumed by this Storage Pool. LUN Count Number of LUNs hosted by this Storage Pool. Auto-Tiering Shows if auto-tiering is scheduled.
Relocation Status Relocation is active or inactive. Relocation Type Scheduled or manual relocation. Relocation Rate Rate at which relocation occurs. Relocation Start Time Start time for the relocation. Relocation Stop Time Stop time for the relocation.
Schedule Duration Remaining If using scheduled relocation, this displays the remaining time for the relocation.
Auto-Tiering State The enabled or disabled state of auto-tiering. Data Movement Completed (GB) Amount of data that has been moved up or down. Data to Move Up (GB) Amount of data that is going to be moved up. Data to Move Down (GB) Amount of data that is going to be moved down. Data to Move Within (GB) Amount of data to move within tiers.
Estimated Time to Complete Estimated time to complete the data relocation. Deduplication State The deduplication state can take any of these values:
l Idle (No deduplicated LUNs)
Table 8 VNX Block metrics for Storage Pool (continued)
Metric Additional information
-
-l Pending - Faulted
l Running (% complete, GB remaining)
l Running - Faulted (% complete, GB remaining) l Paused
l Paused - Faulted
Tiering Policy With FAST VP enabled, tiering policy can take any of these values:
l Start High then Auto-Tier (recommended) l Auto Tier
l Highest Available Tier l Lowest Available Tier l No Data Movement
With FAST VP disabled, tiering policy can be: l Optimize for Pool Performance (default) l Highest Available Tier
l Lowest Available Tier
Initial Tier Initial tier can be any of the values available for Tiering Policy (above).
Deduplication Rate Rate of deduplication. Deduplicated LUNs Shared
Capacity (GBs)
Shared capacity of deduplicated LUNs. Deduplication and Snapshot
Savings (GBs)
Capacity savings through deduplication and Snapshots.
Table 9 VNX Block metrics for Tier
Metric Additional information
-
-RAID Type Type of RAID applied to the tier. Disk Count Number of disks in the tier.
Higher Tier (GB) Amount of data targeted for higher tiers. Lower Tier (GB) Amount of data targeted for lower tiers. Available Capacity (GB) Capacity still available for use. Consumed Capacity (GB) Used capacity.
User Capacity (GB) Free capacity for users.
Subscribed (%) Percentage of tier that is subscribed.
Table 10 VNX Block metrics for Disk
Metric Additional information
-
-Capacity (GB) Total capacity of the disk.
LUN Count Total number of LUNs that the disk is serving. State Current state of the disk.
Hard Read Errors Number of hard read errors. Hard Write Errors Number of hard write errors.
Reads (IO/s) The average number of read requests from the disk per second.
Reads (MB/s) The average amount of data read from the disk in Mbytes per second.
Writes (IO/s) The average number of write requests to the disk per second. Writes (MB/s) The average amount of data written to the disk in Mbytes per
second.
Busy (%) The percentage of time during which the disk is servicing any requests.
Total Latency (ms) The average time, in milliseconds, that it takes for one request to pass through the disk, including any waiting time.
Queue Depth The average number of requests within a polling interval that are waiting to be serviced by the disk, including the one currently in service.
VNX File metrics
EMC Storage Analytics includes the following metrics for VNX File with one table for each Resource Kind.
Table 11 VNX File metrics for Array
Metric Additional information
-
-Elapsed collect time (ms) Amount of elapsed time for the collection. New metrics in each collect call Number of new metrics per collection. New resources in each collect call Number of new resources per collection.
Number of down resources Number of down resources for this adapter instance. Number of metrics collected Number of metrics collected by this adapter instance. Number of resources collected Number of resources collected by this adapter instance. Table 12 VNX File metrics for Data Mover
Metric Description Additional information
- -
-Type Data Mover type. The value can be Active (for the primary Data Mover), Standby, or VDM.
-Busy (%) CPU utilization percentage during this interval.
-DNLC Hit Ratio (%) Directory Name Lookup Cache
(DNLC) hit ratio percentage used for pathname resolution logic.
-Open File Cache Hit Ratio (%)
Open File Cache Hit ratio percentage.
-Buffer Cache Hit
Ratio (%)
Buffer Cache Hit ratio percentage.
-Reads (MB/s) Storage in Mbytes received from
all server-storage interfaces. -Writes (MB/s) Storage in Mbytes sent to all
server-storage interfaces.
-Total Bandwidth
(MB/s)
The total bandwidth for the Data Mover.
-NFS Reads (IO/s) NFS read operations per second. -NFS Writes (IO/s) NFS write operations per second. -NFS Reads (MB/s) NFS read data response in
Mbytes per second.
-NFS Writes (MB/s) NFS write data response in
Mbytes per second.