Prevalence of Pre-Obesity/Obesity in Pre and Basic School
Children at Vila Nova de Gaia, Portugal
A Prevalência de Pré-Obesidade/Obesidade nas Crianças
do Ensino Pré-Escolar e Escolar na Autarquia de Vila Nova
de Gaia, Portugal
1. Departamento de Educação. Câmara Municipal de Vila Nova de Gaia. Vila Nova de Gaia. Portugal. 2. Faculdade de Ciências da Nutrição e Alimentação. Universidade do Porto. Porto. Portugal.
3. Programa nacional para a Promoção da Alimentação Saudável. Direção-Geral da Saúde. Lisboa. Portugal. 4. Faculdade de Medicina. Universidade de Lisboa. Lisboa. Portugal.
5. Serviço de Informação e Análise. Direção-Geral da Saúde. Lisboa. Portugal. Autor correspondente: Bárbara Camarinha. [email protected]
Recebido: 08 de junho de 2015 - Aceite: 17 de agosto de 2015 | Copyright © Ordem dos Médicos 2016 Bárbara CAMARINHA1, Pedro GRAÇA2,3, Paulo Jorge NOGUEIRA4,5 Acta Med Port 2016 Jan;29(1):31-40
RESUMO
Introdução: Mais de 30% das crianças portuguesas apresentam excesso de peso. Sendo um grave problema de saúde pública com múltiplas causas, só uma ação intersectorial e concertada poderá contribuir para a sua resolução. As autarquias possuem um conjunto de competências que as tornam ideais para uma intervenção eficaz na luta contra este problema. Para essa ação ser efetiva é ne-cessária uma avaliação local da dimensão do problema e sua distribuição espacial. O objetivo deste estudo foi caracterizar, do ponto de vista da prevalência de excesso de peso, a população do pré-escolar e primeiro ciclo do ensino básico sob responsabilidade da autarquia de Vila Nova de Gaia, o terceiro município mais populoso do país.
Material e Métodos: Avaliaram-se 8 974 crianças do pré-escolar e primeiro ciclo do ensino básico do município, no ano letivo 2013/14. A avaliação do estado nutricional da amostra foi feita com recurso às medidas antropométricas peso e altura. Na classificação do es-tado nutricional considerou-se os percentis ou z-scores do índice de massa corporal para a idade de acordo com os critérios definidos pela Organização Mundial de Saúde, Centers for Disease Control and Prevention e pela International Obesity Task Force.
Resultados: A prevalência de excesso de peso pelo critério da Organização Mundial da Saúde foi de 37,4%. Identificaram-se dispari-dades na distribuição do excesso de peso nas escolas do concelho.
Discussão: Os resultados encontrados foram ligeiramente superiores aos de outros estudos nacionais e internacionais, podendo a abrangência amostral justificar as diferenças encontradas.
Conclusão: A prevalência encontrada é elevada e de distribuição aparentemente distinta a nível espacial, o que poderá contribuir para a identificação dos principais determinantes do problema a nível local.
Palavras-chave: Composição Corporal; Criança; Criança Pré-Escolar; Excesso de Peso; Índice de Massa Corporal; Obesidade Pediátrica; Portugal; Prevalência.
ABSTRACT
Introduction: Over 30% of Portuguese children present overweight. Being a serious public health problem with multiple causes, only a cross-sectorial and concerted action could contribute to their resolution. Municipalities have a set of skills that make them ideal for effective intervention in the fight against this problem. For this action to be effective there must be a local assessment of the extent of the problem and their spatial distribution. The aim of this study was to characterize, from the point of view of the prevalence of overweight, the population of pre-school and first cycle basic education under the responsibility of the municipality of Vila Nova de Gaia, the third most populous municipality in the country.
Material and Methods: Were evaluated 8 974 pre and basic-school children, in school year 2013/14. The assessment of the nutritional status of the sample was made using anthropometric measures height and weight. In the classification of nutritional status was considered z-scores or percentiles of body mass index for age according to the World Health Organization, Centers for Disease Control and Prevention and International Obesity Task Force.
Results: The prevalence of overweight by the World Health Organization requirements was 37.4%. There were some disparities in the distribution of overweight in schools of the municipality.
Discussion: The results were slightly higher than those of other national and international studies, being the sampling size the possible justification for the differences founded.
Conclusion: The prevalence found is high and with irregular geographical distribution, which could help identifying the main causes of the problem at the local level.
Keywords: Body Composition; Body Mass Index; Child; Child, Preschool; Overweight; Pediatric Obesity; Portugal; Prevalence.
INTRODUCTION
Childhood obesity is a global issue. Worldwide, 42 mil-lion children under the age of 5 were overweight, in 2013.1
In Europe, around 14 million children were overweight to which 400,000 are annually added.2,3 In Portugal, more than
30% of the childhood population is overweight.3 These
fig-ures have tripled in many European countries since 1980, in general population and these are about 10-times higher in children to those found in 1970,3 making obesity a
world-wide public health issue with epidemic proportions.4-6 Ac-cording to Marie Ng et al.,7around 2.1 billion people were
overweight worldwide by 2013, while in 1980 these were around 857 million.7
World Health Organization (WHO) considered obesity as one of ten major risk factors for mortality in 2002 and,8 in 2004, obesity was considered as the epidemic of the twenty-first century.9 The number of overweight people is currently 2.5 times higher than the number of undernourished people.10 However, it should be mentioned that a deceleration has been observed in high-income countries,7,11 which has not been found in low and medium-income countries facing both ends of malnutrition dilemma: malnutrition and overweight.2
Obesity has a multifactorial aetiology, with inherited, genetic, environmental, metabolic, behavioural, cultural, social and economic interacting determinants. Its characteristics include excessive body weight, with high accumulation of fat, due to the maintenance of a positive energy balance over time.12,13 Childhood obesity enhancers
are described in literature and include parental obesity, low economic and social status, high birth weight, sedentary lifestyle and inadequate nutritional patterns.14,15
The human body has excellent physiological defences against depletion of its energetic reserves, whilst showing weak mechanisms against an excessive accumulation of energetic reserves when food is abundant.16
Some studies suggest that childhood overweight is a risk factor to the development of obesity in later adult life and around 60% of children showing this condition before puberty are estimated to remain overweight as young adults, with short-term and long-term adverse effects on adult morbidity and mortality.9,12,13,17,18 Consequences of childhood and adolescence obesity include not only physical (high blood pressure, hypercholesterolaemia, metabolic syndrome, type-2 diabetes, osteoarticular pathology, sleep apnoea, asthma and liver cirrhosis) but also psychological, social and behavioural issues such as low self-esteem, social isolation, school failure, discrimination, depression and reduced overall quality of life.13 Early approach to
overweight, starting in childhood, is fundamental in order to prevent the dissemination of the epidemic and associated comorbidities.
The approach to childhood overweight mainly regards a prevention strategy, in spite of an individual intervention and treatment;19 the earlier the approach is started (in terms of patient’s age), the more effective it can be.20 Childhood is considered as a priority period in the action against overweight and obesity.21 Once established, childhood
obesity is extremely difficult to be reverted, as described by de Onis M et al.22 and obesity prevalence monitoring is a
key issue for the definition and assessment of the impact of policies and strategies in this area.22-24 In addition, the WHO enhances the need for a multi-sectoral approach involving
the joint effort of agro-food, education, local authorities and healthcare sectors.25
Local authorities, particularly municipalities, within their own areas of action, have the means allowing for knowledge and actions against childhood obesity and acting on different environmental, cultural, social and economic determinants as a joint effort.26,27
Vila Nova de Gaia is currently the third most populous Portuguese municipality, with a population of 302,295, from whom 46,641 are aged 0-14.28
As in other Portuguese municipalities, according to the Law 75/2013 (12 September),26 it is responsible for the management of pre-primary (ensino pré-escolar (PE)) and primary school education (primeiro ciclo do ensino básico (1CEB)), except regarding educational issues and the management of teaching staff, having to ensure the management of school meals. These educational levels are organized by School Clusters (Agrupamentos de Escolas). Over the last few years, different nationwide and/ or local studies aimed to the evaluation of overweight prevalence (pre-obesity and obesity) in Portuguese child population.14,29-32 A high prevalence (>30%) of childhood pre-obesity and obesity has been generally found.14,29-32 In fact, the National Program on the Promotion of a Healthy Nutrition (‘Programa Nacional para a Promoção da Alimentação Saudável’),33 established in 2012 by the Direção-Geral da Saúde, includes the control of childhood overweight prevalence as one of its indicators, limiting its growth to zero up to 2016.33 In the updated and extended to
2020 edition of the National Health Plan (Plano Nacional de Saúde), one of its four fundamental aims is non-growth of childhood obesity.34
Therefore, considering these national targets, our research work aims to characterise the current situation as regards the prevalence of childhood pre-obesity and obesity in children living in the municipality of Vila Nova de Gaia, as well as to show the ability of holding an evaluation of childhood pre-obesity and obesity based on the communal services and from there defining intervention strategies with the use and potentiating skills and resources available to the municipality.
MATERIAL AND METHODS
This is an observational, descriptive, cross-sectional study led by the Department of Education at the Câmara Municipal de Vila Nova de Gaia and held at the PE and 1CEB public schools over the 2013/14 school year.
Over the 2013/2014 school year, 87 PE and 100 1CEB schools existed in Vila Nova de Gaia, grouped into 14 School Clusters and attended by 13,951 students (3,527 in PE and 10,424 in 1CEB schools).
All 13,951 students attending the 187 schools were
invited to participate in the study. Parents and guardians were explained on the aim of the study, its authors and contacts, on data collection and result destination, ensuring participant’s anonymity and informing that participation was voluntary and that any harm to their children would arise from the participation in the study. Only students whom their parents/guardians’ authorization was expressed were enrolled in the study; parents/guardians were asked to sign the abovementioned informed consent based on the
International Ethical Guidelines for Biomedical Research Involving Human Subjects35 according to the World
Health Organization(WHO) European Childhood Obesity Surveillance Initiative (COSI) methodology32,36 used as reference to the methodological design of our study. Apart from this informed consent, our study was submitted and approved by the Board of School Clusters and Coordinators of each school.
In total, 8,974 students (2,697 PE and 6,277 1CEB students) aged between 3 and 13 were enrolled in our study.
The difference between the total number of participants and the total initial sample, from which those with any physical disability preventing from completing the anthropometric evaluation were excluded, correspond to non-authorised students or those that were absent on the day of the evaluation.
Even though the individual results were not sent to each student, this information was sent to any parent/guardian having expressed such interest.
Variables
Collected data included the information regarding each student provided by the school (date of birth, gender, address) and the information obtained through the anthropometric evaluations (body weight, standing height and date of evaluation).
Data collection and processing
The anthropometric evaluations were carried out by trained assistants according to the WHO recommended methodology.37 Training occurred in December on the school year when our study took place and included a theoretical approach to the subject, study presentation and aim (45 minutes), followed by the presentation and standardisation of the anthropometric evaluation procedure and practical training (120 minutes).
Before measurements, each participant was asked to authorise the procedure and all children gave their agreement.
Body weight was assessed with the same electronic digital scale and measured to the nearest hectogram (0.1 kg. One of the scales was calibrated by the Department of
Metrology at the Câmara Municipal de Vila Nova de Gaia
over the 10, 20, 30, 40, 50, 60, 70 and 80 kg reading range, in order to gauge the 85 scales used in the study. The remaining scales were checked through three comparative evaluations with the calibrated scale. The differences found were recorded and considered in data processing from each school.
Standing height was evaluated using a non-stretchable measuring tape attached to a vertical and flat wall, the head assuming a position with eyes horizontally looking straight ahead, according to the Frankfurt plane38 and the chin held by the evaluator with the index finger and the thumb, using a rectangular flat object placed at 90º as a headboard caliper. Standing height was measured to the nearest millimetre (0.1 cm). The measurement was obtained twice and the average value from both measurements was considered and the results were recorded in a digital support.
Ten schools were randomly selected in order to validate measurements and these were repeated by the nutritionists working at the Municipality. Apart from these, the evaluations were additionally repeated in three schools. Repeated measurements were obtained upon a first checking and subsequent cleaning of every obtained measurements and due to uncommon records obtained from three schools, when compared to the average values.
The anthropometric evaluation was held between 24 February and 6 April 2014 and children wore only one upper and one lower piece of clothing (apart from underwear). A maximum two-month timeframe between the starting and the end of procedures was considered in the definition of the evaluation period; procedure was started at least two weeks from the beginning of the school year.36
Data were entered into the Anthro® software (regarding
students up to 60 months of age) and into the AnthroPlus®39
software (students over that age) and, for each participant, body mass index (BMI), for-age percentile and BMI-for-age z-score were obtained.
Selected references for the classification of nutritional
status
BMI was the selected anthropometric measure used for the evaluation of the prevalence of childhood pre-obesity and obesity and it is currently the international predictor of obesity adopted and accepted as an indirect measurement of childhood adiposity.40
BMI-for-age percentiles or z-scores were considered for the classification of nutritional status according to the criteria and cut-offs defined by the WHO,22,41,42 by the
Centers for Disease Control and Prevention (CDC)43 and by
the International Obesity Task Force (IOTF),42,44 as shown in
Table 1.
Data processing and subsequent analysis was carried
out and sample was subsequently split into two subgroups (children aged under the age of 5 and 5-13), due to the need for a separate evaluation of these two groups, according to the WHO criteria.41,45
A uniform language for the different criteria had to be established in the overall analysis, particularly with children under the age of 5; we opted to include children classified as ‘increased risk of overweight’ into the ‘pre-obesity’ class.
Data processing and analysis
A descriptive statistical analysis was carried out and the
Statistical Package for Social Sciences (SPSS®) version
22.0 software was used.
Statistical analysis considered means and standard deviations of quantitative variables and frequencies of categorical variables. Differences in categorical variables were compared using Chi-square test. Quantitative variables were compared using t-Student’s test. A <0.05 level of significance was considered.
RESULTS
Characteristics of the participants
In total, 8,974 children aged 3-13 were enrolled in the study, from 93 out of 113 pre-primary and primary schools
within the 14 School Clusters of Vila Nova de Gaia.
Anthropometric characteristics by gender are shown in Table. The presence of a great homogeneity as regards the distribution by gender was found, either in the analysis of the overall sample (51.30%), in the subgroup of children under 5 years of age (48.96%) or in the 5-13 years subgroup (51.74% male participants). As regards the participants’ body weight and standing height, even though similar values were found on both genders, higher values were found in boys (body weight: boys – 27.58 kg ± 8.51 and girls – 27.28 kg ± 9.02; p = 0.096; standing height: boys – 125.23 cm ± 12.66 and girls – 123.81 ± 13.35; p < 0.001) and the opposite was found when BMI was analysed (boys – 17.22 ± 2.77 and girls – 17.34 ± 2.92; p = 0.041). Overall, girls showed a higher level of variation in values. When both subgroups were analysed, we found the general trend in the group of children aged 5-13 – boys were heavier, taller and with lower BMI, while girls had lower BMI (16.27 ± 1.97), when compared to boys in the subgroup of children under 5 years of age.
Overweight prevalence. Pre-obesity and obesity. Prevalence by gender, according to the three selected references (CDC, IOTF and WHO) are shown in Table.
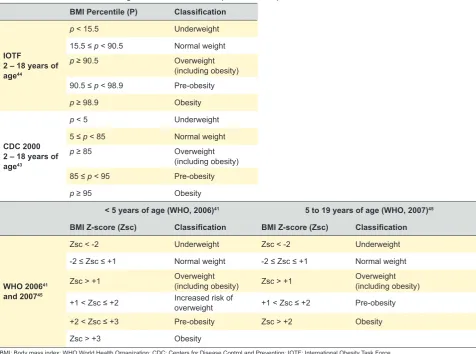
Table 1 - BMI classification according to IOTF, CDC and WHO (2006 and 2007) criteria BMI Percentile (P) Classification
IOTF
2 – 18 years of age44
p< 15.5 Underweight
15.5 ≤ p < 90.5 Normal weight
p ≥ 90.5 Overweight
(including obesity) 90.5 ≤ p < 98.9 Pre-obesity
p ≥ 98.9 Obesity
CDC 2000 2 – 18 years of age43
p < 5 Underweight
5 ≤ p < 85 Normal weight
p ≥ 85 Overweight
(including obesity)
85 ≤ p < 95 Pre-obesity
p ≥ 95 Obesity
< 5 years of age (WHO, 2006)41 5 to 19 years of age (WHO, 2007)45 BMI Z-score (Zsc) Classification BMI Z-score (Zsc) Classification
WHO 200641 and 200745
Zsc < -2 Underweight Zsc < -2 Underweight
-2 ≤ Zsc ≤ +1 Normal weight -2 ≤ Zsc ≤ +1 Normal weight
Zsc > +1 Overweight (including obesity) Zsc > +1 Overweight (including obesity)
+1 < Zsc ≤ +2 Increased risk of overweight +1 < Zsc ≤ +2 Pre-obesity
+2 < Zsc ≤ +3 Pre-obesity Zsc > +2 Obesity
Zsc > +3 Obesity
BMI: Body mass index; WHO World Health Organization; CDC: Centers for Disease Control and Prevention; IOTF: International Obesity Task Force
A lower overweight prevalence (pre-obesity + obesity) was found when IOTF references were used (31.85%) and very similar to CDC and WHO references – 37.54% and 37.44%, respectively. As regards the distribution by gender, higher overweight values were found in boys. However, when unfolding overweight into pre-obesity and obesity (O), we found that pre-obese participants (22.16% and 19.69%, respectively) had a higher contribution to overweight prevalence, using the WHO and the IOTF classification, while obese participants (22.14%) had the higher contribution to overweight prevalence, according to the CDC classification.
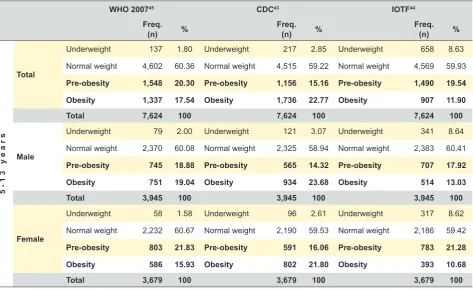
BMI classification of our group of participants among both age subgroups (under five years of age and 5-13) is shown in Tables 4 and 5. An overweight (obesity included) prevalence constantly above 30% was always found, except in children under five years of age when using the IOTF references. The percentage of obese children found in the subgroup of children under five years of age obtained by the WHO references (2.52%) was below the percentage found when using the IOTF references (8.44%) and even lower to the percentage found when the CDC references were used (18.59%), whenever each overweight reference was separately considered. Regarding the subgroup of children aged 5-13, a higher percentage of obese participants, constantly above 20%, regardless of gender, was still found when using the CDC references whereas, when using the WHO and IOTF references, the opposite to what was found in the subgroup of children under five years of age occurred and a higher percentage of obese participants was found when using the WHO references.
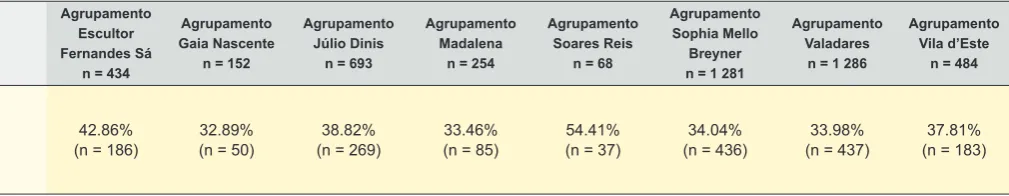
The summary of the distribution of pre-obesity and obesity prevalence in the 14 School Clusters of the Municipality of Vila Nova de Gaia is shown in Table. Important differences were found as regards the geographical distribution and the
highest prevalence (54.41%) was found in the Soares dos Reis School Cluster while the lowest (32.89%) was found in the Gaia Nascente School Cluster, showing statistically significant differences between them (p = 0.003).
DISCUSSION
The isolated use of BMI as the anthropometric predictive indicator of overweight has been considered cautiously by some authors.5 However, the advantages due to the ease
of use, affordability and the fact that it is a non-invasive assessment apart from the constraints associated to other methods of evaluation of body fat and to the lack of references allowing for its interpretation, have made BMI-for-age the best indicator for childhood pre-obesity and obesity,22 the reason why we opted to use it in our study.
There are currently different references aimed to the identification of childhood overweight (pre-obesity and obesity).12,29 The European Childhood Obesity Group46 as
well as the International Pediatric Association47 recommend the use of the WHO cut-offs for children under five years of age (WHO 2006)41 and aged 5 to 19 (WHO 2007)45 in order
to standardise the management protocols and to improve quality of the comparison between the different studies and consequently to improve the quality of the research and monitoring of this subject.46,47 However, many studies still use the CDC and OITF cut-offs14,30,48,49 leading us to establish our evaluation according to these three different references, increasing the chances of comparison with the results found by other studies.
As regards the results, we found that these were in line with other Portuguese and international studies in which an overweight prevalence of approximately 30% was found.14,18,30,50
Few national and/or international studies involved patient’s ages from pre-school (three years of age) to ten
Tablel 2 - Participants characteristics
N (years)Age Body weight(kg) Standing height(cm) BMI percentile (%)BMI-for-age
mean ± sd mean ± sd mean ± sd mean ± sd mean ± sd
Overall
Total 8,974 (100) 6.78 ± 1.97 27.44 ± 8.76 124.54 ± 13.02 17.28 ± 2.84 68.88 ± 29.95 Masculino 4,606 (51.30) 6.81 ± 1.96 27.58 ± 8.51 125.23 ± 12.66 17.22 ± 2.77 66.95 ± 30.19
Feminino 4,368 (48.70) 6.75 ± 1.97 27.28 ± 9.02 123.81 ± 13.35 17.34 ± 2.92 65.81 ± 29.70
3 - 4 years of age
Total 1,350 3.74 ± 0.44 18.32 ± 3.10 105.84 ± 6.18 16.29 ± 1.86 65.13 ± 29.43
Masculino 661 (48.96) 3.75 ± 0.44 18.63 ± 2.93 106.72 ± 6.20 16.31 ± 1.72 66.17 ± 28.93
Feminino 689 (51.04) 3.73 ± 0.45 18.03 ± 3.24 105.00 ± 6.04 16.27 ± 1.97 64.13 ± 29.89
5 - 13 years of age
Total 7,624 7.32 ± 1.61 29.05 ± 8.45 127.85 ± 10.95 17.46 ± 2.95 66.01 ± 30.04 Masculino 3,945 (51.74) 7.33 ± 1.61 29.09 ± 8.21 128.34 ± 10.66 17.37 ± 2.88 65.91 ± 30.40
Feminino 3,679 (48.26) 7.32 ± 1.60 29.01 ± 8.69 127.33 ± 11.23 17.54 ± 3.03 66.13 ± 29.65
BMI: Body mass index
Table 3 -BMI classification according to the WHO, CDC and IOTF references
WHO 2006/200741,45 CDC43 IOTF44
Freq.
(n) % Freq. (n) % Freq. (n) %
Overall
Total
Underweight 158 1.76 Underweight 257 2.86 Underweight 802 8.94
Normal weight 5,456 60.8 Normal weight 5,348 59.59 Normal weight 5,314 59.22
Pre-obesity 1,989 22.16 Pre-obesity 1,382 15.40 Pre-obesity 1,767 19.69 Obesity 1,371 15.28 Obesity 1,987 22.14 Obesity 1,091 12.16
Total 8,974 100 8,974 100 8,974 100
Male
Underweight 86 1.87 Underweight 136 2.95 Underweight 414 8.99
Normal weight 2,782 60.4 Normal weight 2,728 59.23 Normal weight 2,702 58.66
Pre-obesity 970 21.06 Pre-obesity 684 14.85 Pre-obesity 848 18.41 Obesity 768 16.67 Obesity 1,058 22.97 Obesity 642 13.94
Total 4,606 100 4,606 100 4,606 100
Female
Underweight 72 1.65 Underweight 121 2.77 Underweight 388 8.88
Normal weight 2,674 61.22 Normal weight 2,620 59.98 Normal weight 2,612 59.8
Pre-obesity 1,019 23.33 Pre-obesity 698 15.98 Pre-obesity 919 21.04 Obesity 603 13.8 Obesity 929 21.27 Obesity 449 10.28
Total 4,368 100 4,368 100 4,368 100
BMI: Body mass index; WHO: World Health Organization; CDC: Center for Disease Control and Prevention; IOTF: International Obesity Task Force
Table 4 - BMI classification of participants under five years of age according to WHO, CDC and IOTF references
WHO 200641 CDC43 IOTF44
Freq.
(n) % Freq. (n) % Freq. (n) %
3-4 years
Total
Underweight 21 1.56 Underweight 40 2.96 Underweight 117 8.67
Normal weight 854 63.26 Normal weight 833 61.70 Normal weight 858 63.56
Increased risk of
overweight 295 21.85 Pre-obesity 226 16.74 Pre-obesity 261 19.33 Pre-obesity 146 10.81 Obesity 251 18.59 Obesity 114 8.44 Obesity 34 2.52
Total 1,350 100 1,350 100 1,350 100
Male
Underweight 7 1.06 Underweight 15 2.27 Underweight 46 6.96
Normal weight 412 62.33 Normal weight 403 60.97 Normal weight 432 65.36
Increased risk of
overweight 149 22.54 Pre-obesity 119 18.00 Pre-obesity 125 18.91 Pre-obesity 76 11.50 Obesity 124 18.76 Obesity 58 8.77 Obesity 17 2.57
Total 661 100 661 100 661 100
Female
Underweight 14 2.03 Underweight 25 3.63 Underweight 71 10.30
Normal weight 442 64.15 Normal weight 430 62.41 Normal weight 426 61.83
Increased risk of
overweight 146 21.19 Pre-obesity 107 15.53 Pre-obesity 136 19.74 Pre-obesity 70 10.16 Obesity 127 18.43 Obesity 56 8.13 Obesity 17 2.47
Total 689 100 689 100 689 100
BMI: Body mass index; WHO: World Health Organization; CDC: Centre for Diseases Control and Prevention; IOTF: International Obesity Task Force
years of age (end of primary school). In Europe, within the project Identification and prevention of Dietary - and lifestyle
- induced health Effects In Children and infantS (IDEFICS)51
involving children under the age of 10, as in other studies, a higher overweight prevalence was found in Southern European countries52 mainly a 42.4% prevalence in Italy.51
The value found in our study is slightly above the 26.8% overweight (PO + O) prevalence described by Nogueira H
et al.53
Internationally, the Organization for Economic Cooperation and Development (OECD) found a 21.4 and 22.9% overweight prevalence in 2011 in girls and in boys, respectively. In this study, Portugal was already above average, showing 21.6 and 23.5% prevalence in girls and in boys respectively,54 clearly below those found in our study,
which may be related to differences in sampling as well as in time gap between data collections.
The well-known difficult comparative analysis between studies on overweight prevalence, due to the scarce number of publications as to the lack of consistency in methodology, is even more difficult when we analyse the subgroup of children under 5 years of age.51 Therefore,
higher obesity and pre-obesity prevalence was found in this age group when compared to other studies, using the IOTF references.52,55 We can say that the studies by Lourenço
M et al.49 and Rito A were in line with our study55 using the
CDC references, even though slightly lower overweight percentages were found. As regards the WHO criteria, our
study found higher overweight prevalence to the one found in the study by Rito A.55
The results found in the subgroup of children aged 5-13 were mainly compared to those described by the COSI study. In line with what has been described by Wijnhoven T et al.18 and by Rito A et al.,56 the prevalence of pre-obesity, regardless of gender, according to the 2007 WHO references, was always higher than the prevalence found in the COSI study. However, as regards the prevalence of obesity, the CDC references showed to be the most sensitive in such evaluation, when compared to these two authors. Padez C et al.30 found results in line with our study for the prevalence of pre-obesity (20.3% and 19.54% respectively) and obesity (11.3% and 11.90%). The study by Cordinhã AC
et al.48 found a lower (PO + O) prevalence of overweight to
the one found in our study, except regarding the percentage of pre-obese girls (20.3%) which was of higher than the one found in our study (16.06%). Pedrosa C et al.31 found in a
group of children aged 7 to 9, mainly when using the CD references, a lower prevalence of obesity (14.0%), when compared to the prevalence found in our study regarding the subgroup of children aged 5-13 (22.7%).
The differences found in our study when compared to others may relate to the fact that our sample correspond to almost all the population considered in the study, as well as to the extended age range, as most studies are restricted to children populations within one or two-year age range. Our study regards the 2013/2014 school year even
Table 5 - BMI classification of participants aged 5 - 13, according to WHO, CDC and IOTF references
WHO 200745 CDC43 IOTF44
Freq.
(n) % Freq. (n) % Freq. (n) %
5-13 years
Total
Underweight 137 1.80 Underweight 217 2.85 Underweight 658 8.63
Normal weight 4,602 60.36 Normal weight 4,515 59.22 Normal weight 4,569 59.93
Pre-obesity 1,548 20.30 Pre-obesity 1,156 15.16 Pre-obesity 1,490 19.54 Obesity 1,337 17.54 Obesity 1,736 22.77 Obesity 907 11.90
Total 7,624 100 7,624 100 7,624 100
Male
Underweight 79 2.00 Underweight 121 3.07 Underweight 341 8.64
Normal weight 2,370 60.08 Normal weight 2,325 58.94 Normal weight 2,383 60.41
Pre-obesity 745 18.88 Pre-obesity 565 14.32 Pre-obesity 707 17.92 Obesity 751 19.04 Obesity 934 23.68 Obesity 514 13.03
Total 3,945 100 3,945 100 3,945 100
Female
Underweight 58 1.58 Underweight 96 2.61 Underweight 317 8.62
Normal weight 2,232 60.67 Normal weight 2,190 59.53 Normal weight 2,186 59.42
Pre-obesity 803 21.83 Pre-obesity 591 16.06 Pre-obesity 783 21.28 Obesity 586 15.93 Obesity 802 21.80 Obesity 393 10.68
Total 3,679 100 3,679 100 3,679 100
BMI: Body mass index; WHO: World Health Organization; CDC: Centre for Diseases Control and Prevention; IOTF: International Obesity Task Force
though it is included into a follow-up work started in 2008/2009 and regarding pre-primary education. The 2014/2015 data are now being collected (April 2015) and this monitoring is intended to be kept annually. This is a very relevant tool for political and executive decision-making regarding the different local authorities, namely regarding healthcare, education, social action, sports, infrastructures and commercial licensing, as it was developed within the municipality itself, using the entire school population as study population and therefore ensuring a representative sample of the Municipality on its different realities (geographical, social and demographic).26 Even though the evaluation of overweight distribution was not the major aim of this document, we found significant differences between different School Clusters, which will allow in future for a comparison between social and demographic characteristics and the prevalence of overweight found in our study.
Our study is according to the recommendations of the European Food and Nutrition Action Plan 2015-202025 as
well as to the Vienna Declaration on Nutrition and Non-communicable Diseases in the Context of Health 202057 fully assuming the role of municipalities in the promotion of healthy nutrition, in encouragement of physical activity and in the prevention of childhood obesity57 and local reality should be defined in order to find reality-adjusted solutions.
CONCLUSION
Regardless of classification method or subgroup analysed, a very high overweight prevalence (PO + O) was found in children aged 3-13 living at the Municipality of Vila Nova de Gaia, always higher to those found in national comparable studies.
The results found in our study are very relevant. Even though the high prevalence of childhood overweight was already known to exist in Portugal, this new characterisation allows for a more reliable local identification of the subject (22.16% prevalence of pre-obesity and 15.28% of obesity in children attending to pre-primary and primary public schools within the Municipality of Vila Nova de Gaia). These data also show an important geographical variation between schools, inserted in different social, urban and demographic
realities.
These results and the possibility of keeping this local monitoring will allow for better planning and evaluation of the effects of different approach strategies to this serious subject, namely regarding (i) the control of food school supply, as well as the control of licensing of food catering services near schools, (ii) regarding the promotion of physical activity by including this discipline in school curricula or by building and managing sport facilities and (iii) by its capacity to control and modify some social, geographical and demographic determinants.
ACKNOWLEDGEMENTS
The authors wish to acknowledge all the families that have participated in the study as well as all the teachers, technical assistants and operational assistants working at the Municipality of Vila Nova de Gaia for their contribution in the collection and evaluation of anthropometric data.
HUMAN AND ANIMAL PROTECTION
The authors declare that the followed procedures were according to regulations established by the Ethics and Clinical Research Committee and according to the Helsinki Declaration of the World Medical Association. Our study complied with the International Ethical Guidelines for Biomedical Research Involving Human Subjects and was designed according to the recommendations of the World Health Organization(WHO) European Childhood Obesity Surveillance Initiative (COSI).
DATA CONFIDENTIALITY
The authors declare that they have followed the protocols of their work centre on the publication of patient data.
CONFLICTS OF INTEREST
The authors declare that there were no conflicts of interest in writing this manuscript.
FINANCIAL SUPPORT
The authors declare that there was no financial support in writing this manuscript.
Table 6 - Distribution of overweight prevalence (including obesity) by the 14 School Clusters (Agrupamentos de Escolas), according to the WHO references
Agrupamento António Sérgio
n = 329
Agrupamento Canelas n = 1 112
Agrupamento Carvalhos
n = 824
Agrupamento D. Pedro
n = 852
Agrupamento Diogo Macedo
n = 273
Agrupamento Dr. Costa Matos
n = 932
Agrupamento Escultor Fernandes Sá
n = 434
Agrupamento Gaia Nascente
n = 152
Agrupamento Júlio Dinis
n = 693
Agrupamento Madalena
n = 254
Agrupamento Soares Reis
n = 68
Agrupamento Sophia Mello
Breyner n = 1 281
Agrupamento Valadares
n = 1 286
Agrupamento Vila d’Este
n = 484
Percentage of overweight children
(including obesity) WHO references41,45
40.42%
(n = 133) (n = 443)39.83% (n = 371)45.02% (n = 321)37.68% (n = 99)36.26% (n = 310)33.26% (n = 186)42.86% (n = 50)32.89% (n = 269)38.82% 33.46%(n = 85) 54.41%(n = 37) (n = 436)34.04% (n = 437)33.98% (n = 183)37.81%
WHO: World Health Organization
REFERENCES
1. World Health Organization. Obesity and overweight. Fact Sheet nr 311. Geneva: WHO, Media Centre; 2015. [consultado 2015 mai 07]. Disponível em: http://www.who.int/mediacentre/factsheets/fs311/en/#. 2. Abela S, Bagnasco A, Arpesella M, Vandoni M, Sasso L. Childhood
obesity: an observational study. J Clin Nurs. 2014;23:2990-2.
3. Direção Geral da Saúde. Plataforma contra a obesidade. Lisboa; 2015. [consultado 2015 mai 07]. Disponível em: http://www. plataformacontraaobesidade.dgs.pt/.
4. de Onis M, Blössner M, Borghi E. Global prevalence and trends of overweight and obesity among preschool children. Am J Clin Nutr. 2010;92:1257-64.
5. World Health Organization. Obesity: preventing and managing the global epidemic. Report of a WHO consultation. World Health Organ Tech Rep Ser. 2000;894:1-253.
6. International Association for the Study of Obesity. Obesity: understanding and challenging the global epidemic. London: IASO; 2013.
7. Ng M, Fleming T, Robinson M, Thomson B, Graetz N, Margono C, et al. Global, regional, and national prevalence of overweight and obesity in children and adults during 1980–2013: a systematic analysis for the Global Burden of Disease Study 2013. Lancet. 2014;384:766-81. 8. World Health Organization. Food and Agriculture Organization of the
United Nations. Diet, nutrition and the prevention of chronic diseases: report of a joint WHO/FAO expert consultation. Report No. 916. Geneva: WHO; 2003.
9. World Health Organization. Global status report on noncommunicable diseases 2010. Geneva: WHO; 2011.
10. Haddad L, Achadi E, Bendech MA, Ahuja A, Bhatia K, Bhutta Z, et al. The Global Nutrition Report 2014: Actions and Accountability to Accelerate the World’s Progress on Nutrition. J Nutr. 2015;145:663-71. 11. Olds T, Maher C, Zumin S, Péneau S, Lioret S, Castetbon K, et al.
Evidence that the prevalence of childhood overweight is plateauing: data from nine countries. Int J Pediatr Obes. 2011;6:342-60.
12. Krebs NF, Himes JH, Jacobson D, Nicklas TA, Guilday P, Styne D. Assessment of child and adolescent overweight and obesity. Pediatrics. 2007;120:S193-228.
13. Pulgaron ER. Childhood obesity: a review of increased risk for physical and psychological comorbidities. Clin Ther. 2013;35:A18-32.
14. Bingham DD, Varela-Silva MI, Ferrão MM, Augusta G, Mourao MI, Nogueira H, et al. Socio-demographic and behavioral risk factors associated with the high prevalence of overweight and obesity in Portuguese children. Am J Hum Biol. 2013;25:733-42.
15. Padez C, Mourão I, Moreira P, Rosado V. Prevalence and risk factors for overweight and obesity in Portuguese children. Acta Paediatr. 2005;94:1550-7.
16. Hill JO, Peters JC. Environmental contributions to the obesity epidemic. Science. 1998;280:1371-74.
17. Beja A, Ferrinho P, Craveiro I. Evolução da prevenção e combate à obesidade de crianças e jovens em Portugal ao nível do planeamento estratégico. Rev Port Saúde Pública. 2014;32:10-17.
18. Wijnhoven T, van Raaij J, Sjöberg A, Eldin N, Yngve A, Kunešová M, et al. WHO European Childhood Obesity Surveillance Initiative: School Nutrition Environment and Body Mass Index in Primary Schools. Int J Environ Res Public Health. 2014;11:11261-85.
19. Lobstein T, Baur L, Uauy R. Obesity in children and young people: a crisis in public health. Obes Rev. 2004;5:4-85.
20. Langley-Evans SC, Moran VH. Childhood obesity: risk factors, prevention and management. Matern Child Nutr. 2014;10:453-5. 21. Commission of the European Communities. White paper on a Strategy
for Europe on Nutrition, Overweight and Obesity related health issues. COM (2007) 279 final. Luxembourg: EC; 2007.
22. de Onis M, Lobstein T. Defining obesity risk status in the general
childhood population: which cut-offs should we use? Int J Pediatr Obes. 2010;5:458-60.
23. Wijnhoven TM, van Raaij JM, Spinelli A, Rito AI, Hovengen R, Kunesova M, et al. WHO European Childhood Obesity Surveillance Initiative 2008: weight, height and body mass index in 6–9-year-old children. Pediatr Obes. 2013;8:79-97.
24. European Commission. EU Action Plan on Childhood Obesity 2014 - 2020. Luxembourg: EC; 2014.
25. World Health Organization. European Food and Nutrition Action Plan 2015-2020. Copenhagen: WHO; 2014.
26. Assembleia da República. Lei n.º 75/2013 de 12 setembro: Regime jurídico das autarquias locais.
27. Borys JM, Le Bodo Y, Jebb SA, Seidell JC, Summerbell C, Richard D, et al. EPODE approach for childhood obesity prevention: methods, progress and international development. Obes Rev. 2012;13:299-315. 28. PORDATA. População residente segundo os Censos: total e por
grandes grupos etários - Municípios 2011. [consultado 2015 mai 07]. Disponível em: http://www.pordata.pt/.
29. Antunes A, Moreira P. Prevalência de excesso de peso e obesidade em crianças e adolescentes Portugueses. Acta Med Port. 2011;24:279-84. 30. Padez C, Fernandes T, Mourão I, Moreira P, Rosado V. Prevalence of
overweight and obesity in 7-9-year-old Portuguese children: trends in body mass index from 1970-2002. Am J Hum Biol. 2004;16:670-8. 31. Pedrosa C, Correia F, Seabra D, Oliveira BM, Simões-Pereira C,
Vaz-de-Almeida MD. Prevalence of overweight and obesity among 7–9-year-old children in Aveiro, Portugal: comparison between IOTF and CDC references. Public Health Nutr. 2011;14:14-9.
32. Rito A. Childhood Obesity Surveillance Initiative - COSI Portugal. Observações. Bol Epidem. 2012: 6.
33. Direção-Geral da Saúde. Programa Nacional para a Promoção da Alimentação Saudável: Orientações Programáticas. Lisboa: DGS; 2012. 34. Direção-Geral da Saúde. Plano Nacional de Saúde: Revisão e extensão
a 2020. Lisboa: DGS; 2015.
35. Council for International Organizations of Medical Sciences. International Ethical Guidelines for Biomedical Research Involving Human Subjects Geneva: CIOMS; 2002.
36. Wijnhoven T, Van Raaij J, Breda J. WHO European Childhood Obesity Surveillance Initiative: Implementation of round 1 (2007/2008) and round 2 (2009/2010). Copenhagen: WHO Europe; 2014.
37. World Health Organization. WHO child growth standards: training course on child growth assessment. Geneva: WHO; 2008.
38. Lohman TG, Roche AE, Martorell R, editors. Anthropometric standardization reference manual. Illinois: Human Kinetic Books; 1988. 39. World Health Organization. AnthroPlus for personal computers Manual:
Software for assessing growth of the world’s children and adolescents. Geneva: WHO; 2009. [consultado 2015 Mai 07]. Disponível em: http:// www.who.int/growthref/tools/en/.
40. Rolland-Cachera MF. Childhood obesity: current definitions and recommendations for their use. Int J Pediatr Obes. 2011;6:325-31. 41. World Health Organization. Multicentre Growth Reference Study G, de
Onis M. WHO Child Growth Standards based on length/height, weight and age. Acta Pædiatr. 2006;95:76-85.
42. Cole TJ, Lobstein T. Extended international (IOTF) body mass index cut-offs for thinness, overweight and obesity. Pediatr Obes. 2012;7:284-94. 43. Kuczmarski RJ, Ogden CL, Guo SS, Grummer-Strawn LM, Flegal KM,
Mei Z, et al. 2000 CDC Growth Charts for the United States: methods and development. Vital Health Stat 11. 2002:1-190.
44. Cole TJ, Bellizzi MC, Flegal KM, Dietz WH. Establishing a standard definition for child overweight and obesity worldwide: international survey. BMJ. 2000;320:1240-3.
45. de Onis M, Onyango AW, Borghi E, Siyam A, Nishida C, Siekmann J.
Table 6 - Distribution of overweight prevalence (including obesity) by the 14 School Clusters (Agrupamentos de Escolas), according to the WHO references
Agrupamento António Sérgio
n = 329
Agrupamento Canelas n = 1 112
Agrupamento Carvalhos
n = 824
Agrupamento D. Pedro
n = 852
Agrupamento Diogo Macedo
n = 273
Agrupamento Dr. Costa Matos
n = 932
Agrupamento Escultor Fernandes Sá
n = 434
Agrupamento Gaia Nascente
n = 152
Agrupamento Júlio Dinis
n = 693
Agrupamento Madalena
n = 254
Agrupamento Soares Reis
n = 68
Agrupamento Sophia Mello
Breyner n = 1 281
Agrupamento Valadares
n = 1 286
Agrupamento Vila d’Este
n = 484
Percentage of overweight children
(including obesity) WHO references41,45
40.42%
(n = 133) (n = 443)39.83% (n = 371)45.02% (n = 321)37.68% (n = 99)36.26% (n = 310)33.26% (n = 186)42.86% 32.89%(n = 50) (n = 269)38.82% (n = 85)33.46% 54.41%(n = 37) (n = 436)34.04% (n = 437)33.98% (n = 183)37.81%
WHO: World Health Organization
Development of a WHO growth reference for school-aged children and adolescents. Bull World Health Organ. 2007;85:660-7.
46. European Childhood Obesity Group. Endorsement of the new WHO Growth Standards for Infants and Young Children By the European Childhood Obesity Group. Brussels: ECOG; 2009.
47. International Pediatric Association. International Pediatric Association Endorsement: The New WHO Growth Standards for Infants and Young Children. Geneva: IPA; 2006.
48. Cordinhã A, Paúl A, Fernandes L. Obesidade infantil e hipertensão arterial: a realidade de uma população pré-escolar. Acta Pediatr Port. 2009;40:145-9.
49. Lourenço M, Santos C, Carmo I. Estado nutricional e hábitos alimentares em crianças de idade pré-escolar. Rev Enf Ref. 2014;IV:7-14. 50. Gonzalez-Casanova I, Sarmiento OL, Gazmararian JA, Cunningham
SA, Martorell R, Pratt M, et al. Comparing three body mass index classification systems to assess overweight and obesity in children and adolescents. Rev Panam Salud Publica. 2013;33:349-55.
51. Ahrens W, Pigeot I, Pohlabeln H, De Henauw S, Lissner L, Molnar D, et al. Prevalence of overweight and obesity in European children below the age of 10. Int J Obes. 2014;38:S99-107.
52. Cattaneo A, Monasta L, Stamatakis E, Lioret S, Castetbon K, Frenken F, et al. Overweight and obesity in infants and pre-school children in the European Union: a review of existing data. Obes Rev. 2010;11:389-98. 53. Nogueira H, Ferrão M, Gama A, Mourão I, Rosado Marques V, Padez
C. Perceptions of neighborhood environments and childhood obesity: Evidence of harmful gender inequities among Portuguese children. Health Place. 2013;19:69-73.
54. OECD. Overweight and obesity among children. In Health at a Glance: Europe 2012. Paris: OECD; 2012.
55. Rito A. Estado nutricional de crianças e oferta alimentar do pré-escolar do município de Coimbra, Portugal, 2001. Rio de Janeiro: Escola Nacional de Saúde Pública Sérgio Arouca da Fundação Oswaldo Cruz; 2004.
56. Rito A, Wijnhoven TM, Rutter H, Carvalho MA, Paixão E, Ramos C, et al. Prevalence of obesity among Portuguese children (6–8 years old) using three definition criteria: COSI Portugal, 2008. Pediatr Obes. 2012;7:413-22.
57. World Health Organization. Vienna Declaration on Nutrition and Noncommunicable Diseases in the Context of Health 2020. Viena: WHO; 2013.