ISSN: 2347-7474
International Journal Advances in Social Science and Humanities
Available online at: www.ijassh.com
RESEARCH ARTICLE
Building the Customer Satisfaction Forecasting Model for Coffee Chain
Stores:
A View
from Service Quality, Customer Value and Brand Equity
Shih-Chien Chien*
Department of International Business and Trade, Shu-Te University, Taiwan.
*Corresponding Author: Email: [email protected]
Abstract
This paper tries to propose an ANN model to predict the customer satisfaction for Taiwan’s coffee chain stores. To foreshadow our arguments and highlight our contribution, our findings confirm both the service quality, customer value, and brand equity are the three input variables, while customer satisfaction is the output variable for the model. Together, the comparison of the results from ANN and statistical techniques show the effectiveness of different forecasting models in this study. Our find points to that model based on the neural network can achieve better results than the statistical techniques.
Keywords: Service quality, Customer value, Brand equity, Customer satisfaction, Neural network.
Introduction
Taiwan food’s culture had been changed with the westernization, and the market share of coffee has growth rapidly in food market. Many coffee shops have to confront the competitive environment in order to maintain their market share. Especially, some international coffee chain stores had invested into the local market. In addition, the
growth of internationalization, many
international renowned enterprises as well as domestic enterprises invest capital into coffee
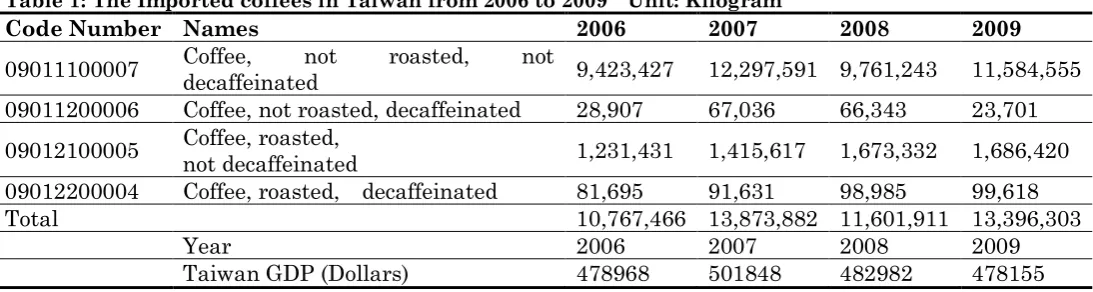
market after year of 1997 and create a fad of coffee chain store. Therefore, driven by the popular of coffee culture, the amounts of imported coffee have significant growth (listed in Table1). This survey discovered that the amounts of the imported coffee continue to grow between year of 2006 and 2009 in Taiwan, despite the fact that the GDP had decline from year of 2006 to 2009.
Table 1: The Imported coffees in Taiwan from 2006 to 2009 Unit: Kilogram
Code Number Names 2006 2007 2008 2009
09011100007 Coffee, decaffeinated not roasted, not 9,423,427 12,297,591 9,761,243 11,584,555
09011200006 Coffee, not roasted, decaffeinated 28,907 67,036 66,343 23,701
09012100005 Coffee, roasted, not decaffeinated 1,231,431 1,415,617 1,673,332 1,686,420
09012200004 Coffee, roasted, decaffeinated 81,695 91,631 98,985 99,618
Total 10,767,466 13,873,882 11,601,911 13,396,303
Year 2006 2007 2008 2009
Taiwan GDP (Dollars) 478968 501848 482982 478155
Source: 1. The data is derived from 2010 Directorate General of Customs, Ministry of Finance, R.O.C. (Taiwan).
2. The data is derived from 2010 Directorate General of Budget, Accounting and Statistics, Executive Yuan, R.O.C. (Taiwan).
There are several famous coffee chain shops in Taiwan, such as Japanese style of MANABE, American style of Starbucks, convenient of Dainty, inexpensive of E coffee, Crown, and 85 Café. Recently, follow by the City Café of convenience
competition of market is most importance. In order to create value for the enterprise, they have to not only catch customer insight but improve customer satisfaction and repeated consumption. Therefore, enterprise should maintain a good relationship with customers and pursue the customer satisfaction in the highly competitive market [1,2].
Generally speaking, coffee chain store is a kind of a service industry. Despite of the good market segmentation, setting the target market, and positioning the products, good service quality will be the important factors to influence customers and change the purchasing behavior of customer [3]. Moreover, good service quality will also promote the customer satisfaction [4]. However, the cost of attracting a new customer is much higher than retaining an old customer. Therefore, enterprise can add value to customer through good service quality. Day [5] further pointed out that enterprise can sustain the competitive advantage if they understand customer requirements and create customer values. However, enterprise also needs to build up powerful brand equity to sustain their competitive advantage. The higher of brand equity exists in customer, the more of the purchase intention will be occurred [6, 7].
In the past, the researchers mostly focus on using regression analysis and statistical methods to explore the relationship between customer satisfaction and other constructs, such as service quality. However, there is few of the researchers used neural network to forecast the customer satisfaction. Therefore, this research tries to use neural network method to set up a prediction model and use it to forecast the level of customer satisfaction.
This remainder of this article begins with a brief overview of the concept of service quality,
customer value, brand equity, customer
satisfaction followed by a discussion of the neural network model and its links with above constructs. Next, the quantitative methodology is described and discussed, before the findings are compared the variances with regression method. The article concludes with a discussion of the implications of the study for academics and practitioners.
Literature Review
The definition of service quality was derived from Levitt [3] that the service quality refers to whether the service performance meets the original standards;Juran [8] recognized that the service quality is the combination of the internal quality, the quality of the hardware, the software quality, and the psychological quality. However,
Sasser, Olsen, and Wyckoff [9] mentioned that service quality not only contains the final results, but includes the mode of service delivery. The nature of service, intangibility, perishable and customer involvement, will affect the service quality. Not be stored by the intangibility of the service industry output, characteristics of service process and the degree of customer participation, will affect quality. There are many scholars believe that most of the service is invisible, because the service is a performance rather than objects [10-13]. Furthermore intangible services generally are not eased to understand the feeling of customer and to assess the quality of service for enterprise [14].
Parasuraman, Zeithaml, and Berry [15] referred that service quality is the difference between customer expectations of service and perceived service. Furthermore, Parasuraman et al. [16] proposed a conceptual model to measure the service quality, referred to as PZB service quality model. They proposed five gaps, each of them stand for the reason that service quality does not meet customer needs or expectations. Previous four gaps are the major barriers when the service quality provided, and the last is the difference between the customer perception of service and desired service. We have to reduce the distance between gaps so as to make customer satisfied. Parasuraman et al. [17] reported that consumers
evaluated service quality by comparing
expectations of the service to be received with the perceptions of actual received service. They developed the SERVQUAL scale and had conducted exploratory investigation in four service categories which are retail banking, credit card, securities brokerage and product repair and maintenance. At the first, it is ten dimensions and then reduced into five dimensions (reliability,
responsiveness, Assurance, Empathy, and
Tangibles) [15].
There are some famous scales be developed from SERVQUAL, such as SERVPERF develop by Cronin and Taylor [18] and Non-Difference develop by Brown, Churchill, and Peter [19]. SERVPERF scale is a variant of the SERVQUAL scale and containing perceived performance component alone, but still comprised of 22 items. And Non-Difference is evaluating the difference between consumer expectations of ‘what they want’ and their perceptions of ‘what they get’. Some scholars believed that the SERVPERF scale is different from their cognition, they thought the gap between perception and expectation is customer satisfaction [2,20,21].
al. [16] had used SERVQUAL scale to measure and discovered a very high reliability (between
0.87 ~ 0.94). Therefore, this study uses
SERVQUAL scale as the measurement items for service quality.
2.2 Customer Value
Ohmae [22] mentioned that the main purpose of the strategy is not to against the rivals, but to provide the value of customer needs; Gale [23] believed that it is the only way to make customer value as a main competitive strategy in order to sustain the competitiveness advantage; Albrecht [24] considered that the most important work for business is to create and provide customer value with the customer's point of view [25] and the goal of customer perception will reach desired goal by product or service [26]. Therefore, customer value is used as a main measurement item of product attributes [26]. Furthermore, Kotler, Ang, Leong, and Tan [27] pointed out that the customer value is the whole value that gains from the product or service, not limits the function of product or service that provided to customer. In addition, the customer need is the key factor of customer value [28] and the customer will constantly assess which products or services will bring the greatest value and meet the expectation value [29]. Customer perception will affect the level of value proposition. Therefore, enterprises have to catch the customer insight and offer a flexible marketing mix to meet customer requirement in order to sustain competitiveness advantage. Regarding that customer is the valuable resource for enterprise; any decision-making should be considered the rate of return of this resource [28].
From the view of compositions of customer value, Gale [23] proposed that the market perceived quality; the market perceived value and the market perceived quality is the most important indicator for enterprise judgments and the measure:Naumann [30] discussed that the customer value can be measured by product quality, service quality, and price;Mathwick [31] recognized that customer value can divide into the economic value and experience value; Woodruff [32] divided value into desire for value and obtains the value and form the hierarchy model for customer value. Sweeney and Soutar [33] conducted that the customer value can be divided by quality value, emotional value, price value, and social value.
This study employs the value conceptual proposed by Sweeney and Soutar [33] and divides the customer value into quality value, emotional value, price value, and social value.
Brand Equity
Some scholars believe that brand equity is the adding value that brand gives the product, thus creating financial interests [34-38] considered that brand equity is a collection of assets and liabilities connecting to the brand, product name and symbol, it may increase or decrease the value of products or services for companies and consumers;Keller [39] defined that customer-based brand equity as the differential effect of brand knowledge on consumer response to the marketing of the brand.
From The brand value is abstract and intangible, there is no uniform way to measure brand equity. Aaker [38] composed a brand equity model which identifies five components of brand equity, brand loyalty, brand awareness, perceived quality, brand associations, and other proprietary assets; Keller [39] thought that brand equity is subject to the influence of brand knowledge. And the brand knowledge made up by two components, brand awareness and brand image.
In this study, we employ Aaker’s proposed and built the brand equity as brand loyalty, brand awareness, perceived quality, and brand associations. The dimension of the other proprietary assets is not included.
2.4 Customer Satisfaction
Customer satisfaction is the key factor that affects repeat purchasing behavior and other buying behavior [40]. Usually the three factors of satisfaction are expectation, performance, and disconfirmation. The customer satisfaction is the combination of the feelings of quality value, cost value, and feel performance. It will affect the subjective emotion and the repeat purchasing behavior of customers [41].
Customer satisfaction will be the critical factor for enterprise due to whether the customer is satisfied or not directly affected by the brand loyalty, word of mouth, complaining, corporate image, and market share. It will influence the enterprise's competitive environment and bring the impact on enterprise profit [42].
attendants [44]. There are two principal interpretation of satisfaction within the literature of satisfaction as a process a satisfaction as an outcome [45]. Transaction-specific satisfaction is a customer's evaluation of his or her experience and reactions [46].
From the measurement view of customer satisfaction, satisfaction is an overall assessment to different attributes of the products or services. We can use single conceptual to understand the customers’ overall evaluation for the product or service. The American Customer Satisfaction Index (ACSI) research uses single conceptual with three items to measure customer satisfaction. It includes the overall customer satisfaction for this company, the distance for products or services to meet clients' expectations, and the difference between the enterprise actual performances of this company and the customers’ ideal [47].
Overall, the satisfaction measure is based on overall basis, and then conducted an extension of the other measured dimensions. In this research, we employed from Fornell et al.’s model and built the scale of customer satisfaction.
Constructing the Neural Networks
Research design
In the past, most researches used the regression and correlation analysis to explore the affection between customer satisfaction and related variable. However, it is hard to predict the
nonlinear relationship between customer
satisfactions. Recently, the enterprises usually use the neural network to decision support and financial forecast related research and always have satisfied result. The neural networks can solve non-linear and predictable characteristics by fast learning ability and adaptability. This research constructs a model for predicting customer satisfaction. The following will introduce the basic rules and algorithms.
This research attempts to build customer satisfaction forecasting model, the input variables are service quality, customer value, brand equity and the output variable is customer satisfaction. Furthermore the study does the pattern analysis and compare with the traditional regression model by assessing the prediction error and efficiency. The research model was shown in Figure 1:
The data we collect for the severice quality, customer value, and brand equity are designed to use five-point Likert scales (1 representing very disagreement and 5 representing very agreement).
Figure 1: Forecasting Model
The output variables are customer satisfaction. All of
the data surveyed are collected from the 85℃
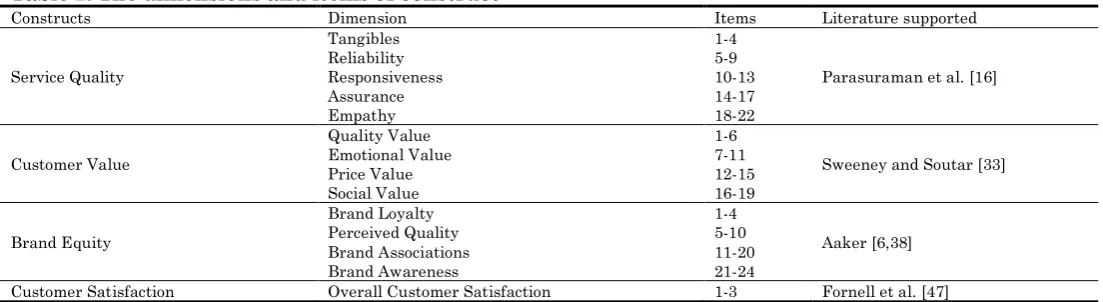
coffee chain. In addition, the dimensions and items of construct are listed in Table.
Table 2: The dimensions and items of construct
Constructs Dimension Items Literature supported
Service Quality Tangibles Reliability Responsiveness Assurance Empathy 1-4 5-9 10-13 14-17 18-22
Parasuraman et al. [16]
Customer Value Quality Value Emotional Value Price Value Social Value 1-6 7-11 12-15 16-19
Sweeney and Soutar [33]
Brand Equity Brand Loyalty Perceived Quality Brand Associations Brand Awareness 1-4 5-10 11-20 21-24 Aaker [6,38]
Customer Satisfaction Overall Customer Satisfaction 1-3 Fornell et al. [47]
Training Algorithm
The NNs are massive, parallel computing mechanisms patterned on the operations of the human brain. These networks are composed of a number of interconnected processing elements (PEs), called neurons, which are usually organized into a sequence of layers linked by weights. The networks are trained in advance stages to execute a desired behavior by iterating through a large number of input-output vectors and adjusting weights. There are several NN models, all of which depend on neurons and the training algorithm. They are also used to find weight values for transforming input values into desired output values. The fundamentals of NNs can be found in Zurada [48]. The NNs model chosen for this research is a multi-layer, fully connected feed-forward network with a back-propagation training rule as proposed by Rumelhart et al. [49]. Training and Generalization
There are two modes possible when using the back propagation network. The first mode is the training mode. This mode begins with arbitrary values of the weights (they might be generated randomly) and proceeds iteratively. Each cycle of the complete training set is called an epoch. In each epoch, the network adjusts the weights in the direction of reducing error between desired and actual output. As the iterative process continues, the weights gradually converge to the optimal set of values.
In prediction mode (the second mode), information flows through the network from input to outputs. After serial computations, the predicted values are then obtained. The resulting error between the predicted values and actual values in the test pattern set is used as the index of network quality. 3.4 Network topology
Network topology refers to both the number of hidden layers and the number of neurons in each layer. Ward Systems Group [50] proposed a formula to calculate the number of nodes in the hidden layer. For a network to be generalized, it should have fewer parameters than data points in the training set. In neural networks, as in all
modeling problems, we want to use the simplest network that can adequately represent the training set. It is not recommended to use a bigger network when a smaller network will work. Thus, there is no exact way to determine a good network topology just from the number of inputs and outputs.
In this methodology, we construct the NNs using Ward Systems Group's formula and use the trial and error rules to monitor the suitable training network.
3.4 Activation function
The activation function has played an important role in the training stage. The most widely used back-propagation algorithm is the sigmoid function, with output values ranging from 0 to 1. Another commonly used activation function is the hyperbolic tangent function with output values in the interval [-1, 1]. In this paper we choose the following hyperbolic tangent function:
x x
x x
e e
e e x
F
) (
Data Analysis
Constructing the Training and Testing Sets In this research, we redesign the sample of 226 consumer’s opinions into eight groups by means of rotation method, where only case eight has thirty samples, and the other seven cases have twenty-eight. Furthermore, all the groups are considered to be testing set, in turn, with the other groups used as the training set. Admittedly, eight-fold cross validation cases can increase the reliability of the sampling process. As a result, this is the most popular method in practice, specifically for problems where the number of samples is relatively small [52]. The samples are separated into training data sets and testing data sets as shown on Table 3 and Table 4.
Performance Indices
We specifically designed the performance indices (mean square error (MSE) and mean absolute percentage error (MAPE)) to measure the
Table 3: Sample differentiated set
Total sample size Sample group Sample size
226
① 28
② 28
③ 28
④ 28
⑤ 28
⑥ 28
⑦ 28
Table 4: Training and testing data set
Sequence Training data Testing data
Test data 1 ① ② ③ ④ ⑤ ⑥ ⑦ ⑧
Test data 2 ② ③ ④ ⑤ ⑥ ⑦ ⑧ ①
Test data 3 ① ③ ④ ⑤ ⑥ ⑦ ⑧ ②
Test data 4 ① ② ④ ⑤ ⑥ ⑦ ⑧ ③
Test data 5 ① ② ③ ⑤ ⑥ ⑦ ⑧ ④
Test data 6 ① ② ③ ④ ⑥ ⑦ ⑧ ⑤
Test data 7 ① ② ③ ④ ⑤ ⑦ ⑧ ⑥
Test data 8 ⑦ ② ③ ④ ⑤ ⑥ ⑧ ⑦
variation of each model. Herewith, we estimated
i
Act
is thei
thactual andx
i is thei
th predictedvalue for the nine testing cases. The equations are presented as follows:
n ) x -(Act M SE
2 n
1 i
i i
(1)
n
1
i i
i i
%) 100 * ) Act
| x -Act | (( n 1
M APE (2)
Equation (1) presented here, is used to examine the mean square error between actual output and forecasting output. In one hand, Equation (2) is used to detect the mean absolute percentage error between actual output and forecasting output. Both equations can evaluate the accuracy of these forecasting models.
Comparison of Dimensions and Questions for Pre-test and Formal Questionnaire
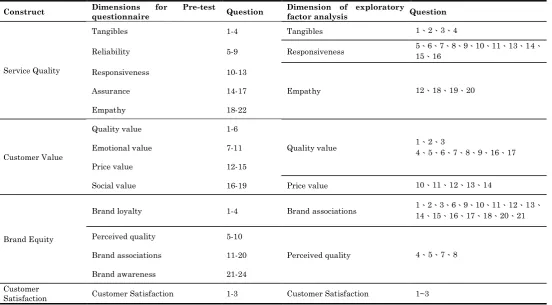
Before calculating the multi-regression equation, we adopt factor analysis with principal components to reduce the input variables. The testing values of the Kaiser-Meyer-Olk Measure of Sampling Adequacy (KMO's MSA) and Bartletts' spherical test on the service quality, customer value, brand equity, and customer satisfaction are 0.935, 0.931, 0.944, and 0.724 respectively, which are also significant (p-value < 0.05). Thus, we conclude the results of this study are claimed to further analysis. In addition, the comparison for
question between pre-test and formal
questionnaire is shown on Table 5.
Table 5: The comparison for question between pre-test and formal questionnaire Construct Dimensions questionnaire for Pre-test Question Dimension of exploratory factor analysis Question
Service Quality
Tangibles 1-4 Tangibles 1、2、3、4
Reliability 5-9 Responsiveness 155、6、7、8、9、10、11、13、14、
、16 Responsiveness 10-13
Empathy 12、18、19、20 Assurance 14-17
Empathy 18-22
Customer Value
Quality value 1-6
Quality value 14、2、3
、5、6、7、8、9、16、17 Emotional value 7-11
Price value 12-15
Social value 16-19 Price value 10、11、12、13、14
Brand Equity
Brand loyalty 1-4 Brand associations 141、2、3、6、9、10、11、12、13、
、15、16、17、18、20、21
Perceived quality 5-10
Perceived quality 4、5、7、8 Brand associations 11-20
Brand awareness 21-24 Customer
Satisfaction Customer Satisfaction 1-3 Customer Satisfaction 1~3
Multi-regression Analysis
Table 5 presents the dimensions of exploratory factor analysis, where it has 7 input variables (X1, X2, X3, X4, X5, X6 and X7) and 1 output variables (Y). Following factor analysis, we employ multiple-regression by means of SPSS software to
simulate the suitable linear regression equation for eight different cases. The regression analysis model was shown as following:
Y=α0+α1 X 1+α2 X2+α3 X3+α4 X4+α5 X5+α6 X6+α7 X7
(3)
Table 6: The coefficients of each testing regression equation
Sequence Standardized coefficients Adjust
R2value F value
Test data 1 0.046 -0.027 0.052 0.293 0.055 0.413 0.113 0.727 75.34 Test data 2 -0.062 -0.666 0.681 1.067 -0.453 0.265 -0.495 0.053 1.216 Test data 3 0.083 -0.032 0.361 -0.413 0.040 0.909 -0.182 0.516 5.117 Test data 4 0.256 -0.134 -0.142 0.212 -0.255 0.104 0.749 0.632 7.610 Test data 5 -0.295 -0.335 0.301 0.593 -0.090 0.740 -0.249 0.506 4.596 Test data 6 0.135 0.182 0.140 0.073 -0.015 0.467 0.006 0.730 11.406 Test data 7 0.028 0.215 -0.493 0.326 0.255 0.939 -0.573 0.732 11.521 Test data 8 -0.118 -0.040 -0.264 0.557 -0.070 0.466 0.215 0.609 7.004
Table 6 provides the positive relationship between Brand Associations and Quality Value with Customer Satisfaction. However, the Price Value has a negative relationship with Customer Satisfaction.
Adaptive Neural Network Analysis
We present an experimental comparison of one and two hidden layers neural networks and found that neural network with two hidden layers has better result. Furthermore, the learning ability of network has something to do with the number of neurons in hidden layer. If many hidden neurons are used, then training will get better learning result but need more time to train. If too few hidden neurons are used, the network will get worse result. Generally, if there is no input variable the number of neurons should between 2n-2 to 2n+2. However, there is no fixed rule for determining the number of neurons in hidden layer and the optimal number could only determine by several tests [53]. This research tries architectures with varying number of neurons in hidden layer and finds the best result. Neural network analysis is constructed with 7–6–2–1 four layers model.
With too few training epochs, the network will result in a poor fit. With too many training epochs, then the network may over fit. Actually, more epochs can only improve the performance of a
model up to a certain level; one do not need to set the maximum epochs really high, we set epochs equal to 5000. However, in order to get best result, the epoch should be raised to 15000 times on sixth forecast.
Furthermore, bias and weights are generated randomly by MATLAB software and are tuned to the value at each epoch before the learning cycle is ended.
Comparison of Neural Network and
Regression Method
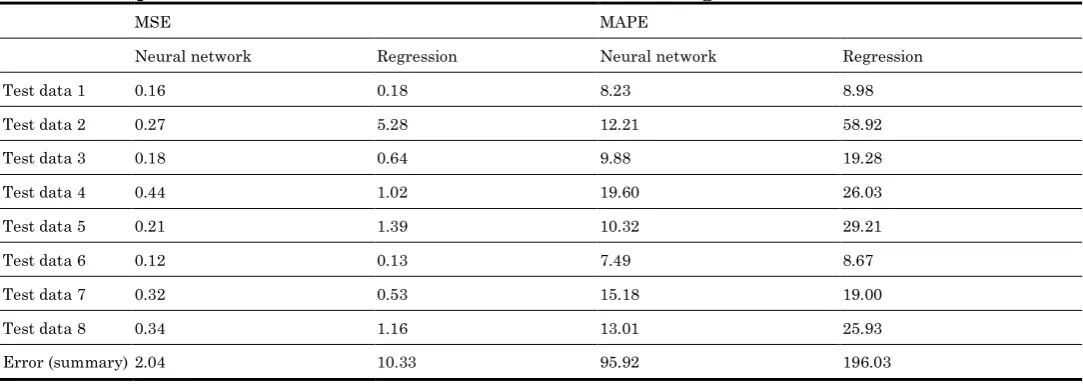
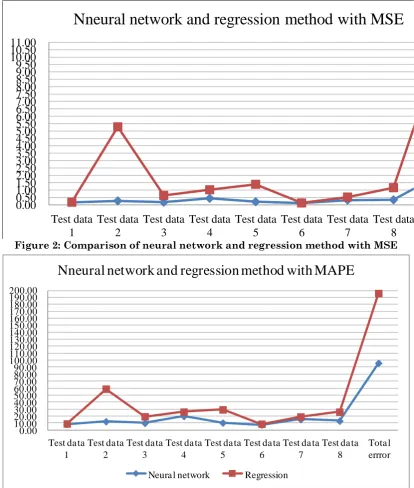
Table 6 presents the forecasting results of the Multi-Regression and ANN. Together, the comparisons of MSE and MAPE between the eight testing data are depicted in Figures 2 and 3 The results show that ANN has a lower MSE and MAPE value than the regression techniques of the eight testing data sources, and, in one hand, the total MSE value of ANN is only one-fifth and the total MAPE value only one-second of the other method. In addition, the performance of the ANN method outperforms the Multi-Regression method in testing data 2, 4, 5 and 8, and has nearly equal performance to the Multi-Regression method in testing data 1, 3, 6, and 7. Moreover, the total MSE of ANN is also lower than the
Multi-Regression method. Accordingly, we can conclude the ANN model performs well in predicating innovation performance.
Table 7: Comparison of MSE and MSPE with neural network and regression
MSE MAPE
Neural network Regression Neural network Regression
Test data 1 0.16 0.18 8.23 8.98
Test data 2 0.27 5.28 12.21 58.92
Test data 3 0.18 0.64 9.88 19.28
Test data 4 0.44 1.02 19.60 26.03
Test data 5 0.21 1.39 10.32 29.21
Test data 6 0.12 0.13 7.49 8.67
Test data 7 0.32 0.53 15.18 19.00
Test data 8 0.34 1.16 13.01 25.93
0.00 0.50 1.00 1.50 2.00 2.50 3.00 3.50 4.00 4.50 5.00 5.50 6.00 6.50 7.00 7.50 8.00 8.50 9.00 9.50 10.00 10.50 11.00
Test data 1
Test data 2
Test data 3
Test data 4
Test data 5
Test data 6
Test data 7
Test data 8
Total errror
Nneural network and regression method with MSE
Neural network Regression
Figure 2: Comparison of neural network and regression method with MSE
0.00 10.00 20.00 30.00 40.00 50.00 60.00 70.00 80.00 90.00 100.00 110.00 120.00 130.00 140.00 150.00 160.00 170.00 180.00 190.00 200.00
Test data 1
Test data 2
Test data 3
Test da ta 4
Test da ta 5
Test da ta 6
Test da ta 7
Test da ta 8
Tota l errror
Nneural network and regression method with MAPE
Neural network Regression
Figure 3: Comparison of neural network and regression method with MAPE
Conclusions and Suggestions
A major objective of this paper was to propose an ANN model to predict the customer satisfaction for Taiwan’s coffee chain stores. To foreshadow our arguments and highlight our contribution, our findings confirm both the service quality, customer value, and brand equity are the three input constructs, while customer satisfaction is the output variable for the model. Together, the comparison of the results from ANN and statistical techniques show the effectiveness of different forecasting models in this study.
To face the challenge in the competitive environment, coffee chain stores are training to take care of the service quality, customer value, and brand equity, in order to sustain their competitiveness. Since it is an important lesson
for decision makers aiming to perform the suitable service strategies and resources allocation, our findings elaborate a model of how customer satisfaction was predicted through service quality, customer value, and brand equity.
Furthermore, our results reveal that the ANN model improves customer satisfaction forecasting by using the adaptive neural network, as well as a rotation method of training and testing data selection which is designed to enhance the reliability of the sampling process before constructing the training and testing model. Moreover, our find points to that model based on the neural network can achieve better results than the statistical techniques.
model, for instance, explaining the training procedure of outcome and how to simulate the rules for prediction. Meanwhile, it also offers more accuracy on prediction. In our study, the factors of Brand Associations and Quality Value were found to be the key issues that coffee chain stores need to confront environment if they want to sustain a distinctive competency. In other words, the keys to a service industry’s customer satisfaction are for chain stores to calibrate their effective variables on customer satisfaction and adjust their service quality, customer value, and brand equity through coordinated and collaborative relationships with alliances. Accordingly, our result, then suggests a
chain store has a better and effective forecasting model is extremely needed.
Clearly, additional research is needed to help
organizational decision makers not only
understanding and comparing the influence factors in service industry, considering the influences of customer satisfaction with different factors as but also monitoring a long term project to examine the long term effects. Also, a cross service industry study may discover the factors influencing customer satisfaction in different domains and their contributions to the customer satisfaction of specific service domains.
References
1. Berry, L. L. & Parasuraman, A. (1991). Marketing services. New York: Free Press.
2. Fornell, C. (1992). A national customer satisfaction barometer: The Swedish experience. Journal of Marketing, 56 (1), 6-21. 3. Levitt, T. (1972). Production-line approach to service. Harvard
Business Review, 50(5), 41-52.
4. McAlexander, J. H., Kaldenberg, D. O. & Koenig, H. F. (1994). Service quality measurement: Examination of dental practices sheds more light on the relationships between service quality, satisfaction, and purchase intentions in a health care setting. Journal of Health Care Marketing, 14(1), 34-39.
5. Day, G. S. (1990). Market driven strategy: Processes for creating value. The Free Press, New York, NY.
6. Aaker, D. A. (1996). Measuring brand equity across products and markets. California Management Review, 38(3), 102-120. 7. Keller, K. L. (2001). Building customer-based brand equity.
Marketing Management, 10(2), 14-20.
8. Juran, J. M. (1986). A Universal Approach to Managing for Quality. Quality Progress, 13(4), 19-24.
9. Sasser, W. E., Olsen, R. P., & Wyckoff, D. D. (1978). Management of service operations: Test, cases, and readings. Boston, MA: Allyn & Bacon, Inc.
10. Bateson, J. E. G. (1977). Do we need service marketing? Marketing Consumer Services: New Insights, Cambridge, MA. 11. Shostack, G. L. (1977). Breaking free form product marketing.
Journal of Marketing, 41(2), 73-80.
12. Berry, L. L. (1980). Services marketing is different. Business, 30(3), 24-29.
13. Lovelock, C. H. (1996). Service Marketing, 3rd Eds., International Editions, Upper Saddle River N. J.: Prentice Hall. 14. Zeithaml, V. A. (1981). How consumer evaluation processes differ between goods and services. In J. H. Donnelly and W. George (Eds.), Marketing of services, 186-190, American Marketing Association, Chicago, IL.
15. Parasuraman, A., Zeithaml, V. A., & Berry, L. L. (1994). Reassessment of expectations as a comparison standard in measuring service quality:Implications for further research. Journal of Marketing, 58(1), 111-124.
16. Parasuraman, A., Zeithaml, V. A., & Berry, L. L. (1988). SERVQUAL: A multiple item scale for measuring consumer perceptions of service quality. Journal of Retailing, 64(1), 12-40.
17. Parasuraman, A., Zeithaml. V. A., & Berry, L. L. (1985). A conceptual model of service quality and its implication for future research. Journal of Marketing, 49(3), 41-50.
18. Cronin, J. J. & Steven, A. T. (1992). Measuring service quality: A seexamination and extension. Journal of Marketing, 56 (July), 55-68.
19. Brown, T. J., Churchill, G. A., & Peter, J. P. (1993). Research note: Improving the measurement of service quality. Journal of Retailing, 69(1), 127-139.
20. Tse, D. K. & Wiltion, P. C. (1988). Model of consumer satisfaction formation: An extension. Journal of marketing research, 25(May), 204-212.
21. Hempel, D. J. (1977). Consumer satisfaction with the home buying process: conceptualization and Measurement. In H. K. Hunt, H., The conceptualization of consumer satisfaction and dissatisfaction. Cambridge, Mass: Marketing Science Institute. 22. Ohmae, K. (1989). Managing in a borderless world. Harvard
Business Review, 67(3), 52-61.
23. Gale, B. T. (1994). Managing Customer Value. The Free Press, New York.
24. Albrecht, K.(1992). The only thing that matters. Harper Collins Publishers Inc., 1st Ed.
25. Slywotzky, A. J. (1996). Value migration: How to think several moves ahead of the competition. Harvard Business School Press.
26. Woodruff, R. B. (1997). Customer value: The next source of competitive advantage,” Journal of the Academy of Marketing Science, 25(2), 139-153.
27. Kotler, P., Ang, S. H., Leong, S. M., & Tan, C. T. (1999). Marketing management: An Asian perspective. Englewood Cliffs, NJ: Prentice-Hall.
York.
29. Kotler, P. (2002). Marketing management, Millennium (10th) Ed, New Jersey: Prentice Hall.
30. Naumann, E. (1995). Creating customer value: The path to sustainable competitive advantage. International Thomson Publishing, Cincinnati, OH.
31. Mathwick, C. (1997). A model of contextual antecedents and exchange outcomes of customer value: An empirical investigation into the catalog and internet shopping context. Ph.D, Georgia Institute of Technology.
32. Woodruff, R. B. & Gardial, S. F. (1996). Know your customer:
New approaches to understanding customer value and satisfaction. Cambridge, MA:Blackwell Business, 1996.
33. Sweeney, J. C. & Soutar, G. N. (2001). Consumer perceived value: The development of a multiple item scale. Journal of Retailing, 77(2), 203-220.
34. Marketing Science Institute(MSI). Research topics 1988-1990. Cambridge, MA: Marketing Science Institute.
35. Farquhar P. H., Han J. Y., & Ijiri Y. (1991), Recognizing and measuring brand assets, MSI Report 91-119, Cambridge. Marketing Science Institute.
36. Srivastava, Rajendra K., & Shocker A. D. (1991). Brand equity: A perspective on its meaning and measurement. Cambridge Mass: Marketing Science Institute.
37. Barwise, P. (1993). Brand equity: Snark or boojum? International Journal of Marketing Research, 10 (March), 93-104.
38. Aaker, D. A. (1991). Managing brand equity: Capitalizing on the value of a brand name. The Free Press, N.Y.
39. Keller, K. L. (1993). Conceptualizing, measuring, and managing consumer-based brand equity. Journal of Marketing, 57(1), 1-22.
40. Cardozo, R. (1965). An experimental study of customer effort, expectation, and satisfaction. Journal of Marketing Research, 2(8), 244-249.
41. Oliver, R. L. (1999). Whence customer loyalty? Journal of Marketing, 63, 33–44.
42. Muller, W. (1991). Gaining competitive advantage through customer satisfaction. European Management Journal, 9(2), pp.201-221.
43. Ostrom, A. & Iacobucci, D. (1995). Consumer trade-Offs and the evaluation of services. Journal of Marketing, 59(1), 17-28. 44. Hernon, P., Nitecki, D. A., & Altman, E. (1999). Service quality
and customer satisfaction: An assessment and future directions. The Journal of Academic Librarianship, 25(1), 9-17.
45. Parker, C. & Mathews, B. P. (2001). Customer satisfaction: Contrasting academic and consumers’ interpretations. Marketing Intelligence & Planning, 19 (1): 38-46.
46. Boshoff, C. & Gray, B. (2004 ). The relationships between service quality, customer satisfaction and buying intentions in the private hospital industry. South African Journal of Business Management, 35 (4), 27-37.
47. Fornell, C., Johnson, M. D., Anderson, E. W., Cha, J., & Bryant, B. E. (1996). The American customer satisfaction index: Nature, purpose, and findings. Journal of Marketing, 60(4), 7-18. 48. Zurada, J. M (1992). Introduction to artificial neural systems.
1st Ed., West Publishing Co, Paul, MN, USA, pp: 683.
49. Rumelhart, D. E., Hinton, G. E., & Williams, R. J. (1986). Learning internal representations by error propagation. In: D. E. Rumelhart, J. L. McClellan (eds) Parallel distributed processing. Exploration in the microstructure of cognition, vol 1. Foundations. MIT Press, Cambridge
50. Ward Systems Group (1998). NeuroShell 2 User Manual. 51. Hagan, M. T., Demuth, H. B., & Beale, M. H. (1996). Neural
network design. 1st Eds., PWS Publishing Co., Boston, MA, USA.,
52. Kantardzic, M. (2002). Data mining: Concepts models methods and algorithms. Hoboken, NJ: Wiley-IEEE Press.