Database Load Balancing
MySQL 5.5 vs PostgreSQL 9.1 Authors GerrieVeerman RoryBreuk [email protected] [email protected]Universiteit van Amsterdam
System & Network Engineering April 2, 2012
Abstract
Load balancers for databases can be used to offer high availability and performance gain with read requests. This project focuses on a comparison between MySQL 5.5 and PostgreSQL 9.1 regarding load balancing. The project stems from the fact that currently no comparisons exists regarding load balancing, also older comparison benchmarks are out-dated. This project gives a comparison between the two database systems using the same topologies and with similar configurations. We used MySQL Proxy for MySQL and PGpool-II for PostgreSQL as load balancers. As a benchmarking tool for both database systems we used Sysbench. After sending read, write, complex read and a combination of read/write queries we got a number of results. We can conclude that load balancing in MySQL Proxy works very well and can even double its speed with read queries. However, PGpool behaves very strange and loses almost half of its speed as pertains to directly sending queries to a single PostgreSQL server. For the write and combination queries, we don’t see big performance changes, except for the bad performance of PGpool. PGpool has either a lot of overhead or does some extra data integrity checks we are not aware of, which slows down the program. We are not the only ones noticing the bad performance of PGpool, chances are big the problems are caused by the software itself.
Contents
1 Introduction 1
1.1 Motivation & Goal . . . 1
1.2 Research Question . . . 3
1.3 Time and Approach . . . 3
2 Theoretical Research 4 2.1 Database Load balancing . . . 4
2.2 Database Redundancy . . . 5
2.3 Database High-Availability . . . 6
2.4 Known Differences Between MySQL and PostgreSQL . . . 7
3 Research 8 3.1 Load Balancer Selection . . . 8
3.2 Benchmarking Tool Selection . . . 9
4 Methods 11 4.1 Project Setup . . . 11
4.2 Query Test For Benchmark Results . . . 14
5 Results 16 5.1 Transaction Test Results . . . 16
5.2 Additional test for PGpool . . . 26
6 Conclusion 27 6.1 Load Balancer . . . 27 6.2 Benchmarking . . . 27 6.3 Queries . . . 27 6.4 MySQL vs PostgreSQL . . . 27 6.5 PGpool . . . 28 6.6 Final judgement . . . 29 7 Future Work 30
Appendices 31
A Acronyms 31
B Configuration MySQL Proxy 32
C Configuration PGpool 33
D Configuration MySQL 36
E Configuration PostgreSQL 38
F Script MySQL Benchmarks 39
G Script PostgreSQL Benchmarks 43
Introduction Chapter
1
1
Introduction
Internet services running on multiple servers often have problems with resource utilization, which leads to suboptimal performance regarding throughput, response time and availability. Load bal-ancers are used to solve these problems, by balancing requests to a service between the servers. Balancing is typically done by using different rules depending on the service, hardware and prefer-ences of the system administrator.
A large amount of systems use load balancing to optimize performance, including large websites, DNS servers and FTP services. It was only recently that load balancing got full support in databases as well. Database load balancing is relatively easy for read queries, but there is great complexity in keeping the database consistent on different servers with write queries.
In this research, we want to investigate differences of load balancers in widely used database man-agement systems. Due to the time constraints for this project, we chose two systems: MySQL and PostgreSQL. The open-source nature and wide usage of these systems make these systems fit very well in this research.
1.1 Motivation & Goal
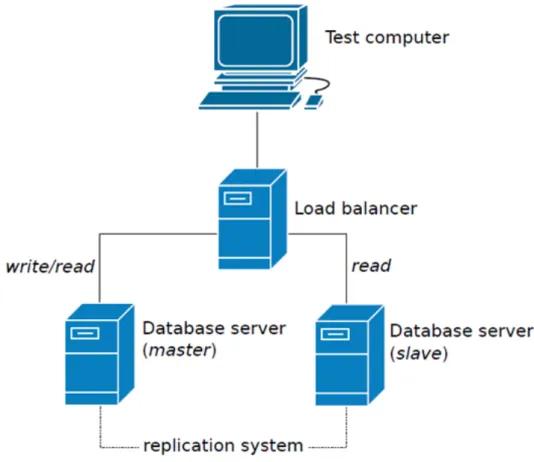
After some initial research in the topic, we came to the conclusion that this was a suitable project. The topic hasn’t been researched lately and new software versions can give new benchmark perfor-mances and practices. Our research will also focus on the performance of load balancing and how well this is handled. In figure 1 a setup is shown of an intensively used website to give a basic view of what we are focusing on - the load balancing and replication mechanisms in the current software versions. Beneath a quotate can be found which illustrates why we are doing this project.
MySQL vs PostgreSQL is a decision many must make when approaching open-source relational databases management systems. Both are time-proven solutions that compete strongly with proprietary database software. MySQL has long been assumed to be the faster but less full-featured of the two database systems, while PostgreSQL was assumed to be a more densely featured database system often described as an open-source version of Oracle. MySQL has been popular among various software projects because of its speed and ease of use, while PostgreSQL has had a close following from developers who come from an Oracle or SQL Server background.
These assumptions, however, are mostly outdated and incorrect. MySQL has come a long way in adding advanced functionality while PostgreSQL dramatically improved its speed within the last few major releases. Many, however, are unaware of the convergence and still hold on to stereotypes based on MySQL 4.1 and PostgreSQL 7.4. The current versions are MySQL 5.5 and PostgreSQL 9.1. [2]
We could not find much research being done in the field of load balancers for databases. Most papers related to this topic are quite old and only offer theoretical ideas but not best practices.
Introduction Chapter
1
Figure 1: Load-balancing architecture for read-intensive web site [1]
We can’t use most of those papers since newer versions of the database systems are available which have many changes from the old ones. Newer database versions implement ways of clustering and replication. There are some comparison sites which compare MySQL and PostgreSQL with simple benchmarks, but those comparisons are more focused on normal read and write operations instead of load balancing.
Introduction Chapter
1
1.2 Research Question
We try to answer the following research question in this report:
What are the differences between database load balancing in MySQL 5.5 and PostgreSQL 9.1?
A number of sub questions have been defined to help answer the research question: • Can load balancing in databases be useful?
• Is load balancing in databases difficult?
• What database load balancing algorithms do MySQL and PostgreSQL implement? • How can database load balancing be properly measured?
• What is the performance of both applications?
1.3 Time and Approach
For this project we only had a limited time frame of four weeks. We looked at both database systems the best way we could and compared them in a equal setup. We try to make the configurations as similar as possible. For the load balancer and benchmarking tools we only look for open-source and free of charge solutions.
Theoretical Research Chapter
2
2
Theoretical Research
In this chapter we will give a small overview of important theory and concepts used in database load balancing. This can be used to get a clearer understanding of the material we cover in the rest of the report. A part of the theory described in the next sections will also illustrate the advantages that database load balancing can give for databases.
2.1 Database Load balancing
Load balancing is dividing work between multiple systems. For databases this is not any different. In database load balancing, multiple database servers are running behind a load balancer, which divides queries between the database servers. Database load balancing is different than other types of load balancing, in a sense that it is focused on data storage and retrieval rather than running applications.
A big problem in database load balancing is that the data on each server needs to be the same. In other load balancing systems, the data is often stored on a different level (usually a database, which can be called by each server behind the load balancer), or the problem can even be partially neglected. It is clear that in database load balancing this is no option. We describe how MySQL and PostgreSQL keep the databases on each server redundant in section 2.2. A direct consequence of this, is that queries with write operations can’t be handled the same way as read-only queries. Next, we will describe a number of load balancing algorithms.
2.1.1 Round Robin
Round robin is the simplest type of load balancing. It sends requests to each server, one after each other. The advantage of this type of load balancing is that it is very simple, and therefore it is fast in its behaviour is easy to predict. All servers behind the load balancer get an equal amount of requests, making it very suitable when similar servers are used.
2.1.2 Weight-based Load Balancing
Weight-based load balancing is also a very simple algorithm; requests are divided between servers on a pre-defined ratio. This type of load balancing is particularly beneficial when the speed of one of the servers is significantly higher than the other server.
2.1.3 Least Connections
In least connections load balancing, requests are sent to the server with the smallest amount of active requests. In particular situations in which the complexity of requests change a lot, this type of load balancing could theoretically give an advantage. This type of load balancing, however, does require active monitoring of requests on the load balancer’s side.
Theoretical Research Chapter
2
2.2 Database Redundancy
In order for database load balancing to work, the database needs to be duplicated over multiple database servers. MySQL and PostgreSQL use different methods of creating redundant databases. In this research we will use master/slave replication for MySQL, because this is the default replication setup in MySQL. For PostgreSQL we will use streaming, which is a new replication method for PostgreSQL 9.1.
2.2.1 Master/slave Replication
In MySQL, redundancy can be established using a master/slave model; a master server receives all updates to the databases, then all actions done by the master are replicated by the slave.
The master server keeps a binary log file, which contains a complete history of all updates to its databases. Whenever a slave server connects to its master, it communicates the position on the master’s binary log file of the last successful update. The master then sends all updates from that point on. These updates are all stored in a relay binary log file, of which the slave server will perform all updates on its own databases. After the initial updates the slave blocks and waits for the master to push new updates [3]. An illustration of this can be seen in figure 2.
It is also possible to have multi-master replication in MySQL, but this is done by configuring each server both as a master and a slave to all other masters.
Theoretical Research Chapter
2
2.2.2 Streaming ReplicationAs already stated PostgreSQL makes us of streaming. Their are two different kind of streaming a-synchronous and synchronous, this last one is new available in PostgreSQL 9.1. The differences are explained below briefly.
Streaming in PostgreSQL makes use of a so called Write-Ahead Logging (WAL). This WAL is a log file with all write changes to the master server. This file is streamed using fsync to every slave connected to this master. When a database writes the changes from theWALfile the change moves to permanent storage. If a slave fails he can recover when it starts up again and check where it was left inWAL file and continues executing write actions. This is used to ensure data integrity. 2.2.3 A-synchronous
A-synchronous streaming was implemented in PostgreSQL version 9.0. With A-synchronous stream-ing there is still a little drawback. When a database write action is send to the master database changes are written faster to disk then changes are written on the slave side. This change is usual still under one second but can cause a problem when the master crashes at exactly that moment and changes have not yet been made to the slaves. However an advantage is that transactions complete more quickly since the master does not care about the slaves database.
2.2.4 Synchronous
Synchronous streaming is new in version 9.1 and is a little bit different. When a master has to write something to disk he first waits on at least one slave to respond that his actions has been written to disk before it preforms the actual change itself. By doing this you ensure data integrity. Data loss can only happen in a very unlikeable scenario that both the master and all slaves fail but you only lose the data send at that time and data always holds its integrity. Another nice feature what can be used by doing this is the change from slave to master server. When a master server fails one of the slaves can act and become the new master, since the slave always has all the changes written to disk. When the old master may recover later it can act either as a slave or change back to the master again.
2.3 Database High-Availability
An important area in network services is high-availability. When a system fails, this may not cause the entire service to fail. Failover is a method of automatic switching to redundant systems, whenever one of the systems fails. It is often taken care of in load balancers. Traffic is routed to multiple redundant systems, so the implementation of failover in load balancers is a matter of monitoring the systems and to stop routing to a system when it fails.
Theoretical Research Chapter
2
2.4 Known Differences Between MySQL and PostgreSQL
2.4.1 MySQL 5.5
MySQL is the most widely used open-source relational database management system Relational Database Management System (RDBMS) [5]. It uses a client-server model, in which the MySQL Server manages all databases, and clients issue commands to the MySQL Server. The server uses a storage engine for data storage.
Multiple storage engines are supported in MySQL, and can even be loaded at runtime. Since version 5.5, InnoDB is the default storage engine of MySQL. InnoDB is optimized for reliability and large transactions [6].
2.4.2 PostgreSQL 9.1
While MySQL is by far the most used open-source database PostgreSQL is in place 2-4 now a days together with MariaDB and MongoDB which are gaining a bigger marked share recently [7]. PostgreSQL is a object-relational database. It is popular for its reliability and data integrity and data correctness. Since version 9.0 it makes use of streaming for its replication technique in a master-slave setup. Version 9.1 adds other new features like smart query handling which performs better with long/difficult queries.
2.4.3 Known Differences
Previous benchmarking tests show that PostgreSQL is a little bit faster than MySQL but they are still close to each other. Their must be said that those benchmarks are out-dated and not at all regarding load balancing what this project is focusing on [8]. We expect that by using a load balancer the reads should be almost double as fast with two server with only a little overhead. While write requests will be the same since no performance can be gain in that field, because everything has to be written to disk.
Below a quotation from a blog by Carla Shroder is shown which compares the two databases : Despite their different histories, engines, and tools, no clear differentiator distinguishes either PostgreSQL or MySQL for all uses. Many organizations favor PostgreSQL because it is so reliable and so good at protecting data, and because, as a community project, it is immune to vendor follies. MySQL is more flexible and has more options for being tailored for different workloads. Most times an organization’s proficiency with a particular piece of software is more important than differences in feature sets, so if your organization is already using one of these, that is a good reason to stick with it. If you held my dogs hostage and forced me to choose a database for a new project, I would pick PostgreSQL for all tasks, including Web site backends, because of its rock-solid reliability and data integrity. [9]
Research Chapter
3
3
Research
This chapter will focus on the research part of this project. We are going to make a selection for the load balancer to use for both databases. We will also look for a benchmarking tool which we can use to get benchmark results.
3.1 Load Balancer Selection
In this section we make our decision on what load balancer we are going to use for each database. We only look for load balancers which are open-source and free of usage. Because of the short time frame for this project we only select one for both databases.
3.1.1 MySQL
Below we will describe a number of programs capable of load balancing MySQL servers. MySQL Proxy
MySQL Proxy is a very flexible program and forms a layer between a client and one or multiple MySQL servers. The program is an official part of the MySQL project, making it the mostly documented solution for MySQL. At the time of writing, the newest official release is 0.8.2 alpha. The goal of MySQL Proxy is to monitor, analyze or transform their communication.[10]. The program’s behaviour is fully scriptable, making it suitable for much more than only load balancing.
MySQL Load Balancer
As the name suggests, MySQL Load Balancer is fully focussed on load balancing between MySQL servers. It is a combination of a monitoring program and a script running on MySQL Proxy. [11]. 3.1.2 PostgreSQL
PostgreSQL has a couple of load balancer a couple of them are described below with a conclusion about which one we pick for our project. There is a website which compares different replication tools for PostGreSQL, some of them are load balancers [12].
PGpool
PGpool is a middle-ware layer. Its current version is pgpool-II 3.1.2 which is released on 31/1/2012 it can work with synchronous streaming. PGpool has support for connection pooling, replication and sending of parallel queries. It was surprising to see that the download count was just over one thousand, which indicates that is not used that much. PGpool can check if databases are still available. It has support for round robin and weight-based load balancing explained in section 2.1. Another nice feature is what they call ’Online Recovery’ when a database fails and the database
Research Chapter
3
checks can’t be preformed anymore a failover script can be run on the load balancer. This script may can recover a database on the failed server by for example restarting or. But the script way also notify you by e-mail that a database went down [13].DBbalancer
DBbalancer is a very old loadbalancer for PostgreSQL the last update was in 2001. Its version is DBbalancer-0.4.4 and only supports simple round robin load balancing. The DBbalancer project is very old and is not looked into deeper regarding this project [14].
Django-Balancer
Django-Balancer is currently a github project its current software version is 0.3. The last update to this project was in December 2010 [15]. It is most likely a very simple and small load balancer not much information can be found about it.
PGcluster
PGcluster is an old load balancer and probably does not support the newer version of PostgreSQL. The last software update was in 2005, what indicates that their is probably no development anymore [16].
3.1.3 Conclusion
We decided to use MySQL Proxy as a load balancer for MySQL servers. The deciding factors for this are that the program is a part of the MySQL project and the large amount of documentation available.
The decision was made to use PGpool for PostgreSQL. All other load balancers are very simple projects or very old and not developed anymore. The only one that does seem interesting and has some extra features is PGpool.
3.2 Benchmarking Tool Selection
For our project we need a benchmarking tool which can send test queries to the databases. With the result of those test queries we can compare the databases to each other. This section focuses on different Structured Query Language (SQL) benchmarking tools and which one we select for our project.
3.2.1 PGbench
PGbench is the main benchmarking tool used for PostgreSQL. It has options to fill the database with test input and test with a number of clients and transactions to the database. The output
Research Chapter
3
result is a amount of transactions per second performed. It states that is very easy to use. PGbench can only be used with PostgreSQL [17].3.2.2 OSDB
OSDB stands for The Open Source Database Benchmark. It is a project which grew at Compaq Computer Corporation. It can work with Informix, MySQL and PostgreSQL. The current version is 0.90 and was released or modified on 22/12/2010. It is unclear if it has support for the newest versions of both databases [18].
3.2.3 Sysbench
Sysbench is an open-source program for benchmarking a large amount of system parameters. This includes evaluation of database performance. Sysbench supports multiple workerthreads, which can be used to imitate multiple concurrent clients. The program supports both MySQL and PostgreSQL, although support of the latter needs Sysbench to be recompiled with PostgreSQL support. It allows a number of different tests, all focussed on testing speed [19].
3.2.4 MySQL Benchmark Suite
The MySQL Benchmark Suite is a set of benchmarking tools supported by the MySQL project. It has a large amount of possibilities for tests including speed, maximum size and support of different datatypes. The suite only has support for MySQL. [20]
3.2.5 Conclusion
We attach great value in keeping the environments for each tests as similar as possible. Running exactly the same tests on the different database system configurations is one of the most important factors for ensuring this. Therefore, we consider using the same benchmarking tool for all tests as a necessity. This means that benchmarking tools with only support for one database system are no suitable candidates. Sysbench is a very widely used and well documented benchmarking tool, as opposed to our last candidate (OSDB). This was decisive for choosing Sysbench for our benchmarks.
Methods Chapter
4
4
Methods
In this chapter we describe what our setup looks like, we describe the hardware and software used and illustrate how our topology is setup. This chapter follows with a description of the queries we have used for benchmarking the databases.
4.1 Project Setup
This section describes what we have used as hard- and software. What change we have made and eventually how our topology looks like.
4.1.1 Software & Hardware
For our setup we used three servers. One load balancer, one master and one slave.The hardware for both the master and slave is the same. The hardware for the load balancer is better and this server also acts as the server for the benchmarking, this to reduce the latency which you would otherwise get when using another server.
Load Balancer Hardware:
Manufacturer: Dell Inc.
Product Name: PowerEdge R210
CPU: 8 * Intel(R) Xeon(R) CPU L3426 @ 1.87GHz HDD: 2 * 250GB harddisk
RAM 2 * 2GB
Software: We configured the load balancer in such a way that they would work in our setup and made them as optimized as we thought possible. The configurations can be found in appendices: B and C.
OS: Debian 6.0.4 64bit
Load balancer PostgreSQL: PGpool-II 3.1.2 Load balancer MySQL: MySQL Proxy 0.8.2
Methods Chapter
4
DatabaseHardware:
Manufacturer: Dell Computer Corporation Product Name: PowerEdge 850
CPU: 2 * Intel(R) Pentium(R) D CPU @ 3.00GHz RAM: 256MB
HDD: 80GB
Software: We tried to make the configuration for both databases as much the same as possible. For example using the same sizes for the cache and buffers. We also disabled logging for a better performance. The configuration files can be found in appendices: D and E.
OS: Debian 6.0.4 32bit Database: MySQL 5.5 Database: PostgreSQL 9.1
Methods Chapter
4
4.1.2 TopologyA more graphical representation of our setup is shown in figure 3. You see the load balancer connected to both database servers. One of the servers is a master the other one a slave. Between them a replication technique is running to keep data integrity. The master can perform read and write actions while the slave only can perform read actions.
Methods Chapter
4
4.2 Query Test For Benchmark Results
Databases make use of so called queries which is a call to a database for a particular operation. Some examples of operations are read, add modify and delete. Those last three are also referred to as write operations since something on disk has to be written. We have selected four kind of queries to run against our databases. We believe that those four are the most used queries performed against databases and should give a good comparison between the databases. All queries have been put inside a script which automatically returns the results in a file, the script increases the amount of clients it should use every time.
We tested with a thread range from 1 till 65 a thread can be seen as client. Every test can send a amount of queries we first tested this with 20.000, 50.000 and 100.000 simple read transactions. The results of those where more or less the same so we decided to do the rest of the tests with a amount of 20.000 queries. Below the queries are shown in detail. The queries for both database differ a bit with the parameters for both databases, the ones for MySQL can be found in the script in appendix: F and the script for PostgreSQL can be found in appendix: G. Later we decided to send more queries (200.000) for the write transactions to get more constant results.
The test has been run against the load balancer but also against the database directly without load balancing. By doing this we can make a comparison on how much improvement we gain or lose by using the load balancer.
4.2.1 Simple Read
With the simple read we want to send a read query as simple an fast as possible to the databases. The below Sysbench command sends one random selectSQLquery to the test database.
PostgreSQL:
sysbench –test=oltp –pgsql-host=<IP> –pgsql-port=<PORT> –pgsql-user=<DBUSERNAME> –pgsql-password=<DBPASSWORD> –oltp-read-only=on –oltp-table-size=100000
–num-threads=<THREADS> –max-requests=20000 –db-driver=pgsql –oltp-test-mode=simple –oltp-nontrx-mode=update_key –oltp-non-index-updates=10 run
4.2.2 Complex Read
While in practice simple reads are not used a lot and queries are more complex we also test with a more complex read query. The below Sysbench command sends 14 random read SQL queries to the test database in one transaction.
PostgreSQL:
sysbench –test=oltp –pgsql-host=<IP> –pgsql-port=<PORT> –pgsql-user=<DBUSERNAME> –pgsql-password=<DBPASSWORD> –oltp-read-only=on –oltp-table-size=100000
–num-threads=<THREADS> –max-requests=20000 –db-driver=pgsql –oltp-test-mode=complex –oltp-nontrx-mode=update_key –oltp-non-index-updates=10 run
Methods Chapter
4
4.2.3 WriteLoad balancing should only improve read queries in theory but since we already have the setup ready it would also be interesting to see how it would behave with only write queries. The below Sysbench command sends one random writeSQLquery to the test database.
PostgreSQL:
sysbench –test=oltp –pgsql-host=<IP> –pgsql-port=<PORT> –pgsql-user=<DBUSERNAME> –pgsql-password=<DBPASSWORD> –oltp-read-only=off –oltp-table-size=100000
–num-threads=<THREADS> –max-requests=200000 –db-driver=pgsql –oltp-test-mode=nontrx –oltp-nontrx-mode=update_key –oltp-non-index-updates=10 run
4.2.4 Combination
As a final test we send a combination of both read and write queries to see how the database behaves when a combination of the two are send. The below Sysbench command sends 14 random readSQL queries and 4 write queries to the test database in one transaction.
PostgreSQL:
sysbench –test=oltp –pgsql-host=<IP> –pgsql-port=<PORT> –pgsql-user=<DBUSERNAME> –pgsql-password=<DBPASSWORD> –oltp-read-only=off –oltp-table-size=100000
–num-threads=<THREADS> –max-requests=20000 –db-driver=pgsql –oltp-test-mode=complex –oltp-nontrx-mode=update_key –oltp-non-index-updates=0 run
Results Chapter
5
5
Results
In this chapter we show and discuss the results which came out of the test scripts we have created. With those results we can finally compare MySQL 5.5 and PostgreSQL 9.1 with the selected load balancers: MySQL Proxy and PGpool. The chapter ends with an additional section for PGpool, this because of unexpected test results we ran into.
5.1 Transaction Test Results
5.1.1 Simple Read Transaction
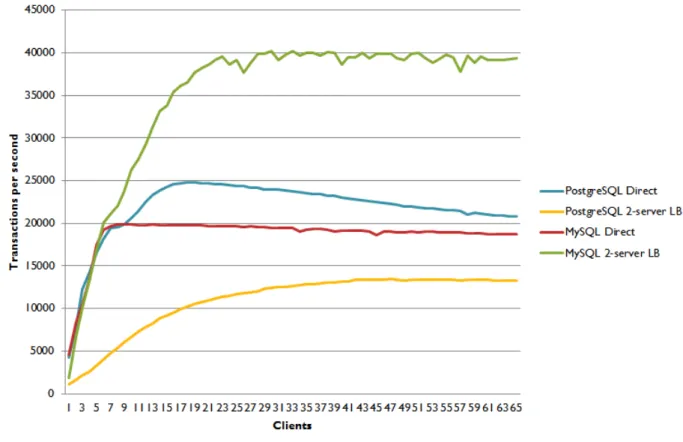
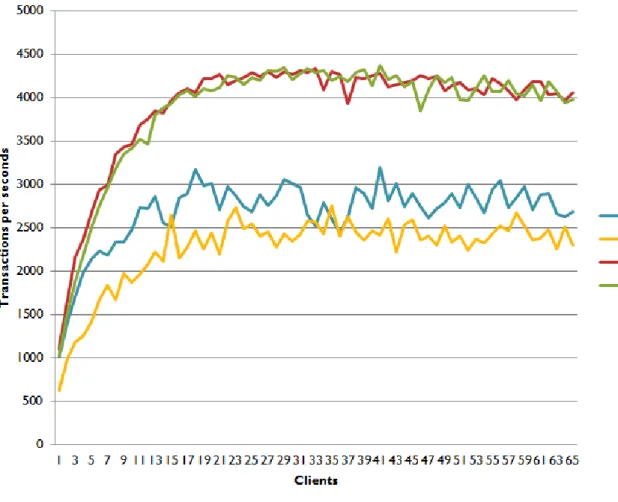
Below in figure 4 the ’simple read’ transaction is shown. The graphs show that with direct sending queries to the database systems PostgreSQL is a bit faster, but moving more to MySQL when the number of clients increases. Regarding the load balancers, it is shown that MySQL performs twice as fast when 26 clients are connected. MySQL Proxy handles around 40,000 transaction per second. We were very surprised about the bad performance of PGpool. In an additional test in section 5.2 we hope more measurements will help to find reasons for this behavior.
Results Chapter
5
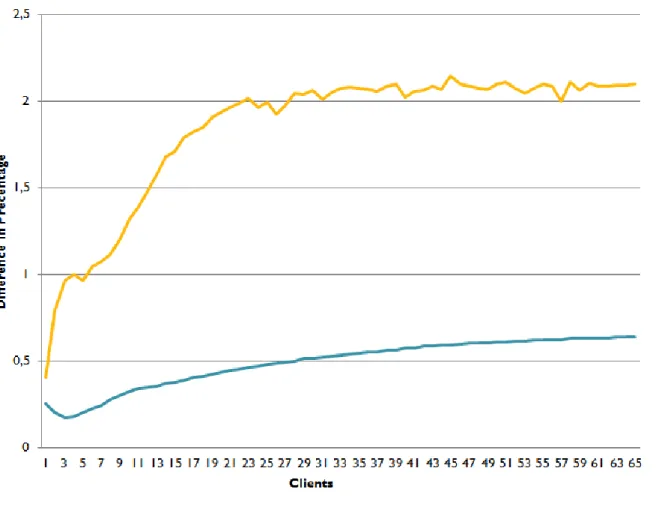
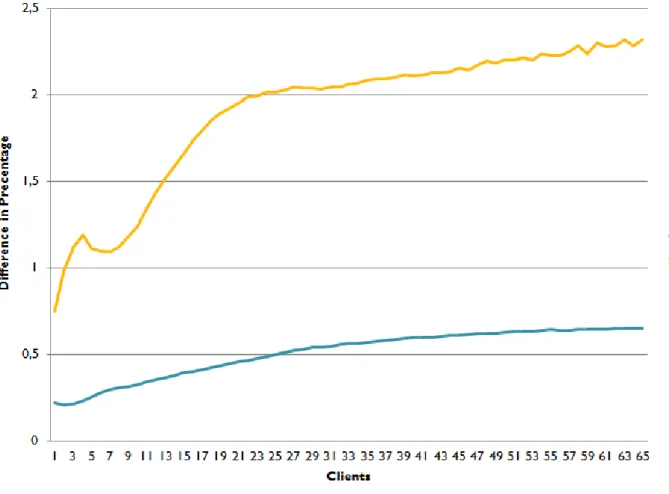
In figure 5, the difference between single writes and load balancing is shown for ’simple reads’. The graph shows nicely that the speed for MySQL more than doubles with many clients when using MySQL proxy. The average of all transactions for PostgreSQL direct is 21,751 per second while for PGpool we only reach 10,907 transactions per second, which is a performance loss to 50.1%. MySQL Proxy performs better with 18,643 transactions direct and 34,994 with MySQL Proxy, which is a gain of performance of 87.7%.Results Chapter
5
5.1.2 Complex Read TransactionWith the ’complex read’ queries, shown in figure 6, we see a change for the direct queries. This time MySQL performs better at first and after 57 clients PostgreSQL performs better. We still can see that MySQL Proxy performs very well as a load balancer, whilst PGpool’s performance is way less than when direct sending queries to a PostgreSQL server.
Results Chapter
5
The difference of speed for ’complex reads’ is shown in figure 7 in percentages. This shows that MySQL Proxy keeps getting better performance when more clients are used. For direct PostgreSQL, the average is 651 transactions per second while for with PGpool the average is 338 transactions, which is a performance loss to 51.9%. The average for MySQL direct is 686 transactions per second and with the load balancer 1,321 transactions, this is a average performance gain of 92.5%.Results Chapter
5
5.1.3 Write TransactionIn figure 8 the ’write transactions’ are shown. MySQL performs better than PostgreSQL with writes. For MySQL, it does not matter much whether queries are sent directly or to the load balancer. However, with PostgreSQL you can see a clear performance drop when PGpool is being used.
Results Chapter
5
For a better comparison between the direct and load balancer regarding ’write transactions’ take a look at figure 9. Shown is that MySQL performs the same for direct and with a load balancer. PGpool does improve when more clients are used, but it’s still slower than sending the queries directly. The average of direct sending write transaction to PostgreSQL is 2,685 and with PGpool it is 2,264, which means a performance loss to 84.3%. With MySQL direct 3,907 transactions can be handled per second and with MySQL Proxy this number is 3,868, which is a very small drop of 1%.Results Chapter
5
5.1.4 Combination TransactionWhen setting a ’combination transaction’ shown in figure 10 you can see that they all preform more or less the same, except for PGpool which performs badly. The small amount of writes in the transaction already show that load balancing has no positive effect for this kind of transaction.
Results Chapter
5
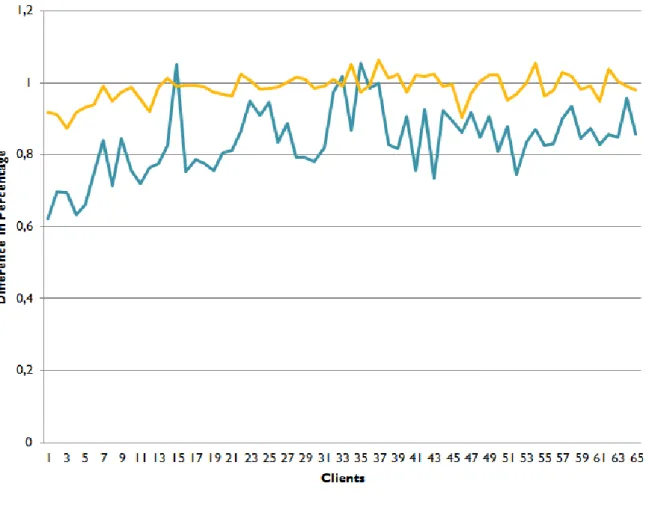
In figure 11, the difference in percentage is shown for a ’combination transaction’. Shown is that the performance for MySQL stays basically the same. For PGpool it is still lower, but increasing while more clients are connected. PostgreSQL can perform 473 transactions per second directly and with PGpool 277 which is a loss of performance to 58.5%. MySQL has an average of 487 transactions direct and 480 with MySQL Proxy which is a small performance loss to 98.6% of the speed of directly sending transactions.Results Chapter
5
5.1.5 Summary of the ResultsIn this section we compare all tests. We take the average of the results from 20 till 65 clients, we do this because we are focusing on load balancing in the first place and so are only concerned when many clients are connected to the database.
Below in figure 12 the difference in percentage is shown from direct to using the load balancer. You can see that PGpool preforms very bad and has performance loss with every test. While MySQL Proxy has over 100% performance gain for read queries and only a very small overhead when using write transactions or a combination of both.
Figure 12: Summary table with performance gain from Direct to using the Load Balancer (average from 20-65 clients)
Results Chapter
5
A summary average with clients from 20 till 65 of all test results is shown in figure 13. You see that PostgreSQL for direct requests is faster with simple reads than MySQL. However, when using the load balancer MySQL Proxy has a enormous performance, gain while PGpool an enormous performance drop. With a complex read MySQL outperforms PostgreSQL a little and we see the same effect with using load balancers as with simple reads. With writes, MySQL outperforms PostgreSQL by far, when using a load balancer only a little overhead is shown. With a combination of write and read queries the transactions per second are almost the same, only PGpool falls behind.Results Chapter
5
5.2 Additional test for PGpool
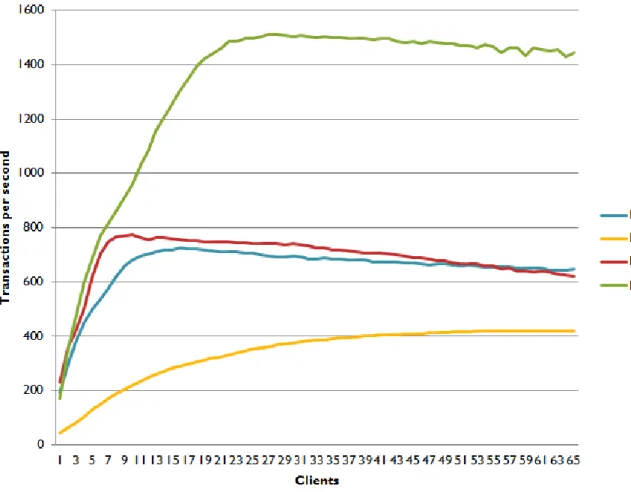
Since we were very surprised about the results from PGpool, we tried almost anything in the con-figuration and setup to find how to improve the performance of PGpool. We did an additional test which send queries to PGpool configured with only one server and two servers. This way we could see if the performance of PGpool increases when using two servers instead of one. This test is shown in figure 14. The graphs show that when using two server we indeed do get a increase in performance, but still not a lot.
Figure 14: Read Transactions
After more researching for what we can have done wrong we noticed that more people have per-formance issues with PGpool [21] [22]. Nobody knows why the enormous performance drop is happening. We read that the older version should preform better, but when using older versions (3.1.1 and 2.3.3), the performance dropped even more. Because of the small time frame for this project we unfortunately could not look deeper into this issue.
Conclusion Chapter
6
6
Conclusion
We researched load balancing in MySQL 5.5 and PostgreSQL 9.1, in order to get a picture of the differences in operation and performance.
This project aimed to answer the following research question:
What are the differences between database load balancing that can be used in MySQL 5.5 and PostgreSQL 9.1?
6.1 Load Balancer
We investigated a number of different load balancers for either MySQL 5.5 and PostgreSQL. We chose MySQL Proxy and PGpool as the most suitable solutions, for the reasons described in section 3.1.3.
6.2 Benchmarking
We investigated a number of different benchmarking tools, in order to find which tool is best suited for our research. There are benchmarking tools, which exclusively aim at a single RDBMS. For a proper comparison between different RDBMS it is very important that the test setup for both systems are very similar, therefore we decided not to use these benchmarking tools in our research. Putting extra care in creating similar test setups reduces unbalanced test results due to difference in overhead in either one of the setups. We eventually chose for Sysbench why can be written in section 3.2.
6.3 Queries
We made a distinction between four different query types in our tests, aimed to highlight different aspects of the load balancer. These were: simple reads, simple writes, complex reads and a complex combination of reads and writes this was described in section 4.2.
6.4 MySQL vs PostgreSQL
Looking at the results of all the tests that we did in section 5, we can draw a number of conclusions: A first interesting observation in the "simple read transaction" graphs, is that each of the graphs quickly go towards a maximum amount of transactions per second, and after this maximum, the speed slowly decreases. The maximum is due to the amount of concurrent connections the servers can handle. After this point, clients need to wait for a previous client to get an answer, before its request starts being handled. The decrease of speed after the maximum can be explained by the increasing stress that comes with each extra client.
Conclusion Chapter
6
In the graphs, we see a big degradation in speed when using PostgreSQL with load balancing, as pertains to direct PostgreSQL. We expected to have better speed performance when a load balancer is used, because the transactions are handled by multiple servers. This turned out to not be the case for PGpool. In the next section, we will try to explain this behavior.MySQL does show a great increase in speed when the amount of clients grows. The speed gain is easily explained, because the load balancing allows for multiple servers to simultaneously handle queries. The speed gain even slightly exceeds a factor 2, while we only have two servers behind the load balancer. We expect the reason for this is that the stress of multiple connections is divided over the servers behind the load balancer. The speed of load balanced MySQL servers exceeds the speed of direct queries to one MySQL server after about four clients. This is because MySQL can very easily handle a small amount of concurrent requests and therefore the overhead of the load balancer dissolves the speed gain of using multiple servers.
The results of "complex read transaction" tests show, except for the slowdown caused by the high complexity, similar results as the "simple read query" graphs. One remarkable difference is that the tests directly to one MySQL server are mostly faster than PostgreSQL direct, while the opposite was the case in the "simple read transaction" tests. This is probably due to the fact that InnoDB has been optimized for complex transactions.
Looking at the "write transaction" tests, we see that both tests for MySQL show better results than the PostgreSQL tests. The similarity in both tests for MySQL is explained by the fact that write transactions can only be sent to the master, in order to keep the MySQL servers redundant. Again, we see that the use of PGpool greatly reduces the speed, in comparison to directly sending the transactions to one PostgreSQL server.
The "combination transaction" tests show similar results between transactions directly to one MySQL server and to MySQL proxy. This is because all transactions contain a write operation, meaning the entire transaction can only be sent to the master. The PostgreSQL direct tests show almost equal performance as the MySQL tests. Performance of PGpool, again, is really bad.
6.5 PGpool
Due to the unexpected big speed loss when using PGpool, we did an additional test on PGpool to get a cleared understanding of the source of the speed loss. We did simple read requests on either one server or two servers behind PGpool 5.2. This test showed that there is some improvement of performance with two servers behind PGpool, as compared to one server. We can conclude from this, that load balancing PostgreSQL 9.1 databases theoretically works, but that the overhead of PGpool is so big that PGpool as a load balancer performance worse than sending the queries directly. Maybe PGpool does some extra data integrity checks or something is very wrong in our configuration. However we are not the only one noticing the slow performance of PGpool and may be a bug in the software, although while even using older version we had worse performance.
Conclusion Chapter
6
6.6 Final judgement
The previous observations show that MySQL proxy works very well in systems in which many clients concurrently send requests. When only a small amount of concurrent requests is likely, using just a single MySQL server is best practice. It is hard to give a good judgement about load balancing PostgreSQL servers in general, but we showed that the overhead of PGpool is too large to be usable as a load balancer. PGpool and MySQL proxy both use very simple load balancing methods, but both allow for expansion in features.
Future Work Chapter
7
7
Future Work
As we only had a little time frame for this project, we could not test multiple load balancers and focused on the most applicable one. We only tested load balancing over two servers. It would be nice to see how the performance would change when using 5, 10 or even 20 servers. We did our best on optimizing the configuration files for both the databases and load balancers, however maybe experts in the field can optimize them even more. Finally we want to know why PGpool is so slow and behaving so badly on load balancing, if you may know the answer to this drop us a e-mail, we are eager to know. As a sum the following topics can be further looked at in the future:
• Benchmarking with more slaves. • Optimization of the database systems. • Try other load balancer software. • Try other load balance methods.
Acronyms Appendix
A
A
Acronyms
RDBMS Relational Database Management System SQL Structured Query Language
UvA University of Amsterdam WAL Write-Ahead Logging
Configuration MySQL Proxy Appendix
B
B
Configuration MySQL Proxy
[mysql-proxy] proxy-backend-addresses = 145.100.104.15 admin-lua-script=/usr/lib/mysql-proxy/lua/admin.lua admin-username = XXX admin-password = XXX proxy-skip-profiling = false event-threads = 4 daemon = true
Configuration PGpool Appendix
C
C
Configuration PGpool
listen_addresses = ’’ port = 9999 pcp_port = 9898 socket_dir = ’/var/run/postgresql’ pcp_socket_dir = ’/var/run/postgresql’ backend_socket_dir = ’/var/run/postgresql’ pcp_timeout = 10 num_init_children = 80 max_pool = 20 child_life_time = 0 connection_life_time = 0 child_max_connections = 0 mem = 1GB shared_buffers=1GB client_idle_limit = 0 authentication_timeout = 60 logdir = ’/var/log/pgpool’ pid_file_name = ’/var/run/postgresql/pgpool.pid’ replication_mode = false load_balance_mode = true replication_stop_on_mismatch = false failover_if_affected_tuples_mismatch = false replicate_select = falsereset_query_list = ’ABORT; DISCARD ALL’ white_function_list = ”
black_function_list = ’nextval,setval’ print_timestamp = false
master_slave_mode = true
Configuration PGpool Appendix
C
delay_threshold = 10000 log_standby_delay = ’if_over_threshold’ connection_cache = true health_check_timeout = 10 health_check_period = 0 health_check_user = ’postgres’ failover_command = ’/etc/pgpool2/failover.sh %d "%h" %p %D %m %M "%H" %P’ failback_command = ” fail_over_on_backend_error = true insert_lock = true ignore_leading_white_space = false log_statement = false log_per_node_statement = false log_connections = false log_hostname = false parallel_mode = 0 enable_query_cache = 0 pgpool2_hostname = ” # system DB info system_db_hostname = ’127.0.0.1’ system_db_port = 9999 system_db_dbname = ’postgres’ system_db_schema = ’postgres_catalog’ system_db_user = ’postgres’ system_db_password = ’xxx’ backend_hostname0 = ’145.100.xxx’ backend_port0 = 5432 backend_weight0 = 1 backend_data_directory0 = ’/opt/postgres/9.1/data’ backend_flag0 = ’ALLOW_TO_FAILOVER’ backend_hostname1 = ’145.100.xxx’Configuration PGpool Appendix
C
backend_port1 = 5432 backend_weight1 = 1 backend_data_directory1 = ’/opt/postgres/9.1/data’ backend_flag1 = ’ALLOW_TO_FAILOVER’ enable_pool_hba = false recovery_user = ’postgres’ recovery_password = ’xxx’ recovery_1st_stage_command = ’basebackup.sh’ recovery_2nd_stage_command = ” recovery_timeout = 0 client_idle_limit_in_recovery = 0 lobj_lock_table = ’pgpool_lobj_lock’ ssl = false #ssl_key = ’./server.key’ #ssl_cert = ’./server.cert’ #ssl_ca_cert = ” #ssl_ca_cert_dir = ” debug_level = 0Configuration MySQL Appendix
D
D
Configuration MySQL
#REMOVED ALL DEFAULT VALUES AND INFORMATION [client] port = 3306 socket = /var/run/mysqld/mysqld.sock [mysqld_safe] socket = /var/run/mysqld/mysqld.sock nice = 0 [mysqld] user = mysql pid-file = /var/run/mysqld/mysqld.pid socket = /var/run/mysqld/mysqld.sock port = 3306 basedir = /usr datadir = /var/lib/mysql tmpdir = /tmp skip-external-locking bind-address = 0.0.0.0 key_buffer = 24M max_allowed_packet = 16M thread_stack = 192K thread_cache_size = 8 myisam-recover = BACKUP max_connections = 120 query_cache_limit = 24M query_cache_size = 24M general_log_file = /var/log/mysql/mysql.log general_log = 1 server-id = 1 log_bin = /var/log/mysql/mysql-bin.log
Configuration MySQL Appendix
D
expire_logs_days = 10 max_binlog_size = 100M interactive_timeout=100 wait_timeout=100 [mysqldump] quick quote-names max_allowed_packet = 16M [isamchk] key_buffer = 24M !includedir /etc/mysql/conf.d/Configuration PostgreSQL Appendix
E
E
Configuration PostgreSQL
#REMOVED ALL DEFAULT VALUES AND INFORMATION # CONNECTIONS AND AUTHENTICATION
listen_addresses = ’*’ port = 5432
max_connections = 120
# RESOURCE USAGE (except WAL) shared_buffers = 24MB
# WRITE AHEAD LOG wal_level = hot_standby # REPLICATION
max_wal_senders = 5 wal_keep_segments = 33 hot_standby = on
# QUERY TUNING
# ERROR REPORTING AND LOGGING log_destination = ’stderr’ logging_collector = off log_directory = ’pg_log’ log_filename = ’%A.log’ log_truncate_on_rotation = off debug_pretty_print = on datestyle = ’iso, mdy’
lc_messages = ’en_US.UTF-8’ lc_monetary = ’en_US.UTF-8’ lc_numeric = ’en_US.UTF-8’ lc_time = ’en_US.UTF-8’
Script MySQL Benchmarks Appendix
F
F
Script MySQL Benchmarks
#!/bin/sh
# Simple read for 1 server direct, 1 server through load balancer and for 2 servers, 20000 times # Complex read-only
# Simple write for 1 server direct, 1 server through load balancer and for 2 servers, 10000 times # Complex read and write
killall mysql-proxy
mysql-proxy –defaults-file=mysql-proxy.conf
echo "Simple read, 2 servers through load balancer" for i in $(seq 1 65)
do
sysbench –test=oltp –mysql-host=127.0.0.1 –mysql-port=4040 –mysql-user=root –mysql-password=1234hvp –oltp-read-only=on –oltp-table-size=100000 –num-threads=$i –max-requests=20000 –db-driver=mysql –oltp-test-mode=simple –oltp-nontrx-mode=update_key –oltp-non-index-updates=0 run | grep -i transactions: | cut -d "(" -f 2 >&1 | cut -d "." -f 1 >&2
done
echo "Simple read, 1 server, direct" for i in $(seq 1 65)
do
sysbench –test=oltp –mysql-host=145.100.104.15 –mysql-user=root –mysql-password=1234hvp –oltp-read-only=on –oltp-table-size=100000 –num-threads=$i –max-requests=20000 –db-driver=mysql – oltp-test-mode=simple –oltp-nontrx-mode=update_key –oltp-non-index-updates=0 run | grep -i transactions: | cut -d "(" -f 2 >&1 | cut -d "." -f 1 >&2
done
killall mysql-proxy
mysql-proxy –defaults-file=mysql-proxy-1.conf echo "Simple read, 1 server through load balancer" for i in $(seq 1 65)
do
sysbench –test=oltp –mysql-host=127.0.0.1 –mysql-port=4040 –mysql-user=root –mysql-password=1234hvp –oltp-read-only=on –oltp-table-size=100000 –num-threads=$i –max-requests=20000 –db-driver=mysql –oltp-test-mode=simple –oltp-nontrx-mode=update_key –oltp-non-index-updates=0 run | grep -i transactions: | cut -d "(" -f 2 >&1 | cut -d "." -f 1 >&2
Script MySQL Benchmarks Appendix
F
donekillall mysql-proxy
mysql-proxy –defaults-file=mysql-proxy.conf
echo "complex read, 2 servers through load balancer" for i in $(seq 1 65)
do
sysbench –test=oltp –mysql-host=127.0.0.1 –mysql-port=4040 –mysql-user=root –mysql-password=1234hvp –oltp-read-only=on –oltp-table-size=100000 –num-threads=$i –max-requests=20000 –db-driver=mysql –oltp-test-mode=complex –oltp-nontrx-mode=update_key –oltp-non-index-updates=0 run | grep -i transactions: | cut -d "(" -f 2 >&1 | cut -d "." -f 1 >&2
done
echo "complex read, 1 server, direct" for i in $(seq 1 65)
do
sysbench –test=oltp –mysql-host=145.100.104.15 –mysql-user=root –mysql-password=1234hvp –oltp-read-only=on –oltp-table-size=100000 –num-threads=$i –max-requests=20000 –db-driver=mysql – oltp-test-mode=complex –oltp-nontrx-mode=update_key –oltp-non-index-updates=0 run | grep -i transactions: | cut -d "(" -f 2 >&1 | cut -d "." -f 1 >&2
done
killall mysql-proxy
mysql-proxy –defaults-file=mysql-proxy-1.conf echo "complex read, 1 server through load balancer" for i in $(seq 1 65)
do
sysbench –test=oltp –mysql-host=127.0.0.1 –mysql-port=4040 –mysql-user=root –mysql-password=1234hvp –oltp-read-only=on –oltp-table-size=100000 –num-threads=$i –max-requests=20000 –db-driver=mysql –oltp-test-mode=complex –oltp-nontrx-mode=update_key –oltp-non-index-updates=0 run | grep -i transactions: | cut -d "(" -f 2 >&1 | cut -d "." -f 1 >&2
done
killall mysql-proxy
mysql-proxy –defaults-file=mysql-proxy.conf
echo "simple write, 2 servers through load balancer" for i in $(seq 1 65)
Script MySQL Benchmarks Appendix
F
dosysbench –test=oltp –mysql-host=127.0.0.1 –mysql-port=4040 –mysql-user=root –mysql-password=1234hvp –oltp-read-only=off –oltp-table-size=100000 –num-threads=$i –max-requests=200000 –db-driver=mysql –oltp-test-mode=nontrx –oltp-nontrx-mode=update_key –oltp-non-index-updates=0 run | grep -i transactions: | cut -d "(" -f 2 >&1 | cut -d "." -f 1 >&1
sleep 30s done
echo "simple write, 1 server, direct" for i in $(seq 1 65)
do
sysbench –test=oltp –mysql-host=145.100.104.15 –mysql-user=root –mysql-password=1234hvp –oltp-read-only=off –oltp-table-size=100000 –num-threads=$i –max-requests=200000 –db-driver=mysql –oltp-test-mode=nontrx –oltp-nontrx-mode=update_key –oltp-non-index-updates=0 run | grep -i transactions: | cut -d "(" -f 2 >&1 | cut -d "." -f 1 >&1
sleep 30s done
killall mysql-proxy
mysql-proxy –defaults-file=mysql-proxy-1.conf echo "simple write, 1 server through load balancer" for i in $(seq 1 65)
do
sysbench –test=oltp –mysql-host=127.0.0.1 –mysql-port=4040 –mysql-user=root –mysql-password=1234hvp –oltp-read-only=off –oltp-table-size=100000 –num-threads=$i –max-requests=200000 –db-driver=mysql –oltp-test-mode=nontrx –oltp-nontrx-mode=update_key –oltp-non-index-updates=0 run | grep -i transactions: | cut -d "(" -f 2 >&1 | cut -d "." -f 1 >&1
sleep 30s done
#complex reads and writes killall mysql-proxy
mysql-proxy –defaults-file=mysql-proxy.conf
echo "complex write, 2 servers through load balancer" for i in $(seq 1 65)
Script MySQL Benchmarks Appendix
F
sysbench –test=oltp –mysql-host=127.0.0.1 –mysql-port=4040 –mysql-user=root –mysql-password=1234hvp –oltp-read-only=off –oltp-table-size=100000 –num-threads=$i –max-requests=20000 –db-driver=mysql –oltp-test-mode=complex –oltp-nontrx-mode=update_key –oltp-non-index-updates=0 run | grep -i transactions: | cut -d "(" -f 2 >&1 | cut -d "." -f 1 >&1
done
echo "complex write, 1 server, direct" for i in $(seq 1 65)
do sysbench –test=oltp –mysql-host=145.100.104.15 –mysql-user=root –mysql-password=1234hvp – oltp-read-only=off –oltp-table-size=100000 –num-threads=$i –max-requests=20000 –db-driver=mysql –oltp-test-mode=complex –oltp-nontrx-mode=update_key –oltp-non-index-updates=0 run | grep -i transactions: | cut -d "(" -f 2 >&1 | cut -d "." -f 1 >&1
done
killall mysql-proxy
mysql-proxy –defaults-file=mysql-proxy-1.conf
echo "complex write, 1 server through load balancer" for i in $(seq 1 65)
do
sysbench –test=oltp –mysql-host=127.0.0.1 –mysql-port=4040 –mysql-user=root –mysql-password=1234hvp –oltp-read-only=off –oltp-table-size=100000 –num-threads=$i –max-requests=20000 –db-driver=mysql –oltp-test-mode=complex –oltp-nontrx-mode=update_key –oltp-non-index-updates=0 run | grep -i transactions: | cut -d "(" -f 2 >&1 | cut -d "." -f 1 >&1
Script PostgreSQL Benchmarks Appendix
G
G
Script PostgreSQL Benchmarks
#!/bin/sh #COMBI
for i in $(seq 1 65) do
date
echo "Running $i threads 20.000 combi prague:"
a=‘sysbench –test=oltp –pgsql-host=<IP direct> –pgsql-port=<PORT> –pgsql-user=<DBUSERNAME> –pgsql-password=<DBPASSWORD> –oltp-read-only=on –oltp-table-size=100000 –num-threads=<THREADS> –max-requests=20000 –db-driver=pgsql –oltp-test-mode=simple –oltp-nontrx-mode=update_key –
oltp-non-index-updates=10 run | grep transactions: | cut -d "(" -f 2 | cut -d "." -f 1‘ echo $a
echo "$a" » 2local-20readEXCEL.txt done
for i in $(seq 1 65) do
date
echo "Running $i threads 20.000 combi direct:"
a=‘sysbench –test=oltp –pgsql-host=<IP Local> –pgsql-port=<PORT> –pgsql-user=<DBUSERNAME> –pgsql-password=<DBPASSWORD> –oltp-read-only=on –oltp-table-size=100000 –num-threads=<THREADS> –max-requests=20000 –db-driver=pgsql –oltp-test-mode=simple –oltp-nontrx-mode=update_key –
oltp-non-index-updates=10 run | grep transactions: | cut -d "(" -f 2 | cut -d "." -f 1‘ echo $a
echo "$a" » direct-20readEXCEL.txt done
#COMBI
for i in $(seq 1 65) do
date
echo "Running $i threads 20.000 combi prague:"
a=‘sysbench –test=oltp –pgsql-host=<IP direct> –pgsql-port=<PORT> –pgsql-user=<DBUSERNAME> –pgsql-password=<DBPASSWORD> –oltp-read-only=off –oltp-table-size=100000 –num-threads=$i
Script PostgreSQL Benchmarks Appendix
G
–max-requests=20000 –db-driver=pgsql –oltp-test-mode=complex –oltp-nontrx-mode=update_key –oltp-non-index-updates=0 run | grep transactions: | cut -d "(" -f 2 | cut -d "." -f 1‘echo $a
echo "$a" » 2local-20combiEXCEL.txt done
for i in $(seq 1 65) do
date
echo "Running $i threads 20.000 combi direct:"
a=‘sysbench –test=oltp –pgsql-host=<IP Local> –pgsql-port=<PORT> –pgsql-user=<DBUSERNAME> –pgsql-password=<DBPASSWORD> –oltp-read-only=off –oltp-table-size=100000 –num-threads=$i –max-requests=20000 –db-driver=pgsql –oltp-test-mode=complex –oltp-nontrx-mode=update_key –oltp-non-index-updates=0 run | grep transactions: | cut -d "(" -f 2 | cut -d "." -f 1‘
echo $a
echo "$a" » direct-20combiEXCEL.txt done
#WRITE
for i in $(seq 1 65) do
date
echo "Running $i threads 20.000 write prague:"
a=‘sysbench –test=oltp –pgsql-host=<IP direct> –pgsql-port=<PORT> –pgsql-user=<DBUSERNAME> –pgsql-password=<DBPASSWORD> –oltp-read-only=off –oltp-table-size=100000 –num-threads=$i –max-requests=200000 –db-driver=pgsql –oltp-test-mode=nontrx –oltp-nontrx-mode=update_key –oltp-non-index-updates=10 run | grep transactions: | cut -d "(" -f 2 | cut -d "." -f 1‘
echo $a
echo "$a" » 2local-20writeEXCEL3.txt sleep 30
done
for i in $(seq 1 65) do
Script PostgreSQL Benchmarks Appendix
G
echo "Running $i threads 20.000 write direct:" a=‘sysbench –test=oltp –pgsql-host=<IP Local> – pgsql-port=<PORT> –pgsql-user=<DBUSERNAME> –pgsql-password=<DBPASSWORD> –oltp-read-only=off –oltp-table-size=100000 –num-threads=$i –max-requests=200000 –db-driver=pgsql – oltp-test-mode=nontrx –oltp-nontrx-mode=update_key –oltp-non-index-updates=10 run | grep trans-actions: | cut -d "(" -f 2 | cut -d "." -f 1‘echo $a
echo "$a" » direct-20writeEXCEL3.txt sleep 30 done #COMPLEX READ for i in $(seq 1 65) do date
echo "Running $i threads 20.000 complex read direct:"
a=‘sysbench –test=oltp –pgsql-host=<IP direct> –pgsql-port=<PORT> –pgsql-user=<DBUSERNAME> –pgsql-password=<DBPASSWORD> –oltp-read-only=on –oltp-table-size=100000 –num-threads=$i –max-requests=20000 –db-driver=pgsql –oltp-test-mode=complex –oltp-nontrx-mode=update_key –oltp-non-index-updates=10 run | grep transactions: | cut -d "(" -f 2 | cut -d "." -f 1‘
echo $a
echo "$a" » direct-20com_readEXCEL.txt done for i in $(seq 1 65)
do date
echo "Running $i threads 20.000 complex read local:"
a=‘sysbench –test=oltp –pgsql-host=<IP Local> –pgsql-port=<PORT> –pgsql-user=<DBUSERNAME> –pgsql-password=<DBPASSWORD> –oltp-read-only=on –oltp-table-size=100000 –num-threads=$i –max-requests=20000 –db-driver=pgsql –oltp-test-mode=complex –oltp-nontrx-mode=update_key –oltp-non-index-updates=10 run | grep transactions: | cut -d "(" -f 2 | cut -d "." -f 1‘
echo $a
echo "$a" » 2local-20com_readEXCEL.txt done
Appendix
H
H
Bibliography
[1] D. J. B. Jeremy D. Zawodny, “High performance mysql: optimization, backups, replication and load balancing,” 2004.
[2] Wiki, “Mysql vs postgresql,” 16 March 2012. http://www.wikivs.com/wiki/MySQL_vs_ PostgreSQL#MySQL:NDB_Cluster.
[3] Oracle, “Introduction to replication,” 2011. http://dev.mysql.com/doc/refman/4.1/en/ replication-intro.html.
[4] SecaGuy, “The best way to setup mysql replication,” 2011. http://blog.secaserver.com/ 2011/06/the-best-way-to-setup-mysq-replication/.
[5] Oracle, “Mysql, market share,” 2008. http://www.mysql.com/why-mysql/marketshare/. [6] Oracle, “The innodb storage engine,” 2011. http://dev.mysql.com/doc/refman/5.0/en/
innodb-storage-engine.html.
[7] C. Schroder, “Database marketshare: Mysql, postgresql, mariadb, mongodb,” 8 July 2011. http://olex.openlogic.com/wazi/2011/ postgresql-vs-mysql-which-is-the-best-open-source-database/.
[8] Wiki, “Mysql vs postgresql,” 16 March 2012. http://www.wikivs.com/wiki/MySQL_vs_ PostgreSQL#Benchmarks.
[9] D. Sotnikov, “Postgresql vs. mysql: Which is the best open source database?,” 2011. http://blog.jelastic.com/2011/10/19/ database-marketshare-mysql-postgresql-mariadb-mongodb/.
[10] Oracle, “Mysql proxy,” 2011. http://forge.mysql.com/wiki/MySQL_Proxy.
[11] M. AB, “Mysql load balancer,” 2008. http://forge.mysql.com/wiki/MySQL_Proxy.
[12] P. wiki, “Replication, clustering, and connection pooling,” 2011. http://wiki.postgresql. org/wiki/Replication,_Clustering,_and_Connection_Pooling.
[13] “Pgpool,” 2012. http://www.pgpool.net/mediawiki/index.php/Main_Page. [14] “Dbbalancer.” http://dbbalancer.sourceforge.net/.
[15] B. Konkle, “Django balancer.” https://github.com/bkonkle/django-balancer. [16] A. Mitani, “Pgcluster.” http://pgcluster.projects.postgresql.org/index.html. [17] “Pgbench.” http://wiki.postgresql.org/wiki/Pgbench.
Appendix
H
[18] “Osdb.” http://osdb.sourceforge.net/index.php?page=faq.
[19] “Sysbench: a system performance benchmark.” http://sysbench.sourceforge.net/. [20] “The mysql benchmark suite.”
[21] A. Nesiren, “[pgpool-general] slow pgpool-ii-3.1,” October 2011. http://www.mail-archive. com/[email protected]/msg03326.html.
[22] R. Heisterhagen, “Severe problem with the performance of pgpool-ii,” 12 December 2012. http://pgfoundry.org/tracker/index.php?func=detail&aid=1011133&group_id= 1000055&atid=298.
![Figure 1: Load-balancing architecture for read-intensive web site [1]](https://thumb-us.123doks.com/thumbv2/123dok_us/8676232.2346057/6.892.207.674.198.720/figure-load-balancing-architecture-read-intensive-web-site.webp)
![Figure 2: Master/slave replication in MySQL [4]](https://thumb-us.123doks.com/thumbv2/123dok_us/8676232.2346057/9.892.164.717.651.939/figure-master-slave-replication-in-mysql.webp)