NEUROMECHANICAL CONTRIBUTIONS TO LOWER EXTREMITY STIFFNESS DURING RUNNING AND HOPPING IN HEALTHY RUNNERS
Jonathan (FJ) Stephen Goodwin
A dissertation submitted to the faculty at the University of North Carolina at Chapel Hill in partial fulfillment of the requirements for the degree of Doctor of Philosophy (Biomechanics) in
the Human Movement Science Curriculum in the Department of Allied Health Sciences.
Chapel Hill 2018
Approved by:
J. Troy Blackburn
Darin A. Padua
Eric D. Ryan
Jason R. Franz
ii ©2018
iii
ABSTRACT
Jonathan (FJ) Stephen Goodwin: Neuromechanical contributions to lower extremity stiffness during running and hopping in healthy runners
(Under the direction of J. Troy Blackburn)
Lower extremity stiffness (KLeg) describes how subjects attenuate load during ground
contact while completing dynamic tasks. Alterations in KLeg are associated with increased risk for
lower extremity injury. Previous data suggests that lesser mobility during a clinical exam is
associated with greater KLeg in healthy runners. The purpose of our study was to analyze the
neuromechanical contributions to KLeg during running and hopping in healthy runners.
Additionally we analyzed the relationship between running and hopping while also examining
the feasibility of utilizing a waist-mounted accelerometer to estimate KLeg in a clinical setting.
We analyzed 70 healthy runners with a 2 session cross-sectional study. We collected
musculotendinous stiffness of the ankle plantarflexors and knee extensors in session 1. In session
2, we collected KLeg during self-selected running as well as single leg hopping at 3 frequencies
(1.5 Hz, self-selected, 3.0 Hz). We also collected waist-mounted accelerations as well as muscle
activation of the ankle plantarflexors and knee extensors. We found that at self-selected
frequencies and higher, greater KLeg during single leg hopping is significantly associated with
greater ankle plantarflexor musculotendinous stiffness, greater ankle plantarflexor muscle
activation and greater hopping frequency. Greater KLeg during running is significantly associated
iv
greater running velocity. We found that subjects who demonstrated greater KLeg during single leg
hopping also demonstrated greater KLeg during running however this significant relationship was
only minimal. Finally, our waist-mounted accelerometer significantly overestimated KLeg across
all hopping frequencies. Out study found that active muscle contraction and greater
musculotendinous stiffness of the ankle plantflexors and knee extensors are associated with
greater KLeg during hopping and running, respectively. These may serve as rehabilitative targets
to alter KLeg in the clinical setting. Additionally, assessing KLeg via hopping and with a
waist-mounted accelerometer does not accurately reflect KLeg during running determine via motion
capture. Additional studies should be completed to improve the clinical assessment of KLeg to
v
vi
ACKNOWLEDGEMENTS
There have been numerous mentors who have shaped me throughout my career and this
list will certainly not be exhaustive. Firstly, Dr. Ray Moss at Furman University introduced me
to research, the scientific method and the joy of being a “lab rat.” Additional faculty who
fostered me at Furman include Dr. Bill Pierce, Dr. Tony Caterisano, Dr. Matt Feigenbaum, Dr.
Julian Reed, Dr. Tim Patrick, & Dr. Scott Murr. Following my undergraduate degree, I pursued
my Doctorate of Physical Therapy at East Carolina University. My time at ECU allowed me to
develop my abilities with Dr. Blaise Williams and Dr. Walt Jenkins who pushed me to blend the
clinical and research worlds to create meaningful, impactful discoveries in the lab. Finally, I
would like to acknowledge Dr. Troy Blackburn at the University of North Carolina at Chapel
Hill who has gone above and beyond to ensure I become an independent researcher capable of
developing and sustaining my own research line. I am forever indebted to him as well as my
committee of Dr. Darin Padua, Dr. Eric Ryan, Dr. Jason Franz, & Dr. Todd Schwartz. Their
guidance enabled this project along with additional UNC faculty including Dr. Brian
vii
TABLE OF CONTENTS
LIST OF TABLES ... ix
LIST OF FIGURES ...x
LIST OF ABBREVIATIONS ... xii
Chapter 1: Introduction ...1
Specific Aims: ...4
Potential pitfalls: ...5
Chapter 2: Literature Review ...7
Running injuries ...7
Lower extremity stiffness ...10
Stiffness and injury risk ...18
Neuromuscular contributions to lower extremity stiffness ...22
Muscle Activity ...23
Musculotendinous stiffness ...26
Clinical Application ...32
Accelerometers ...32
Comparing running vs hopping ...34
Chapter 3: Methods ...39
Experimental Design: ...39
viii
Session 1 ...39
Session 2 ...45
Statistical Analysis & Hypothesis ...50
Power Analysis ...53
Chapter 4: Summary Results ...57
Chapter 5: Manuscript 1 ...61
Chapter 6: Manuscript 2 ...82
ix
LIST OF TABLES
Table 2.1 - Representative sample of hopping studies.……….………13
Table 4.1 - Significant variables selected for model inclusion via forward stepwise selection....57
Table 5.1 - KLeg and EMG values from Session 2 categorized via hopping and running………..74
Table 5.2 - Significant variables selected for model inclusion via forward stepwise selection…74
Table 5.3 - Multiple regression model results for the KLeg Hop Self model
containing the 3 predictor variables……….…………..75
Table 5.4 - Multiple regression model results for the KLeg Hop 3.0 model
containing the 4 predictor variables………...75
Table 5.5 - Multiple regression model results for the KVert Run model
containing the 3 predictor variables………...75
Table 5.6 - Multiple regression model results for the KLeg Run model
containing the 3 predictor variables………...76
Table 6.1 - Normalized stiffness values based on hopping and running
x
LIST OF FIGURES
Figure 2.1- Ideal spring mass model for KLeg with the leg orientated in non-vertical position….11
Figure 2.2 - Ideal spring mass model for KVert with the leg orientated vertically………..11
Figure 2.3 - Representative elastic modulus for selected musculoskeletal tissues………19
Figure 2.4 - Representative vertical ground reaction forces between an impulsive runner and a non-impulsive runner………...………21
Figure 3.1 - Experimental set-up for ankle plantarflexion MVIC with ankle joint in neutral position……….………...40
Figure 3.2 - Experimental set-up for ankle plantarflexion MTS………...………41
Figure 3.3 - Vertical ground reaction force oscillations following downward manual perturbation……….41
Figure 3.4 - Experimental set-up for knee extensor MVIC………...43
Figure 3.5 - Experimental set-up for knee extensor MTS……….43
Figure 3.6 - Foot and shank acceleration oscillations following downward manual perturbation……….44
Figure 3.7 - Experimental kinematic marker and electromyography sensors marker set-up for running and hopping protocol………....………..45
Figure 3.8 - Center of mass acceleration during hopping……….….48
Figure 3.9 - Vertical ground reaction force during stance phase of running………...48
Figure 3.10 - Clinical passive range of motion assessments………...49
Figure 3.11 - KLeg assessed during hopping via motion capture and accelerometer data………..54
Figure 3.12 - Vertical stiffness changes scores assessed during bilateral hopping via motion capture and accelerometer data………....55
Figure 3.13 - Stiffnesses for KLeg during hopping, KVert during running and KLeg during running……….55
Figure 4.1 – Stiffness values based on condition and frequency……….………..58
xi
motion capture vs accelerometer………...…59
Figure 5.1 - Clinical passive range of motion assessments………...64
Figure 5.2 - Experimental set-up for ankle plantarflexion MVIC with
ankle joint in neutral position………65
Figure 5.3 - Experimental set-up for knee extensor MVIC with
knee positioned in 30° of flexion………...………66
Figure 5.4 - Experimental set-up for ankle plantarflexion MTS………..….66
Figure 5.5 - Experimental set-up for knee extensor MTS……….... 68
Figure 5.6 - Representative foot and shank oscillations following
downward manual perturbation……….69
Figure 5.7 - Experimental kinematic marker and electromyography
sensors marker set-up for running and hopping protocol…………...…………....……..70
Figure 5.8 - Ideal spring mass model for KVert with the leg orientated vertically….…….………72
Figure 6.1 - Ideal spring mass model for KVert with the leg orientated vertically………..……....86
Figure 6.2 - Stiffness values based on condition and frequency……….………...89
Figure 6.3 - Representative graph of vGRF estimated by motion capture vs accelerometer……93
Figure 6.4 - Representative graph of COM displacement estimated
xii
LIST OF ABBREVIATIONS
KLeg Lower extremity stiffness
KVert Vertical stiffness
1
Chapter 1: Introduction
Running is an increasingly popular mode of exercise with over 48 million participants in
the United States in 2015. 1 Running is associated with reduced mortality and disability 2, 3 but also incurs notable risk for lower extremity injury. Lower extremity injuries occur in up to 79%
of individuals who routinely run more than 5 kilometers, 4 and these injuries lead to reduced activity, prolonged recovery, healthcare utilization, and time away from work. 5, 6 A conservative estimate of a 35% lower extremity injury rate in US runners would incur an annual financial
burden of over $3.8 billion. 7 Current approaches of strength training, stretching, foot wear selection and training alterations are not consistently effective for reducing lower extremity
injury risk. 8 Continued research is necessary to identify individuals at heightened risk of running-related injuries and clinical targets for intervention.
Greater loading rates during dynamic tasks such as running have been linked to greater
risk for bony injury, 9-12 while lesser loading rates have been linked to greater soft tissue injury risk. 13, 14 Lower extremity stiffness (KLeg) quantifies resistance to deformation of the lower limbs (e.g. flexion) during the ground contact phase of dynamic tasks, and can be manipulated by the
neuromuscular system to alter loading rate. 15 Greater KLeg is associated with a shorter ground contact time, 16 thus resulting in greater loading rate and magnitude 17 given the impulse required to decelerate and subsequently accelerate the center of mass during ground contact. Subjects with
2
greater KLeg. 19, 20 These data suggest that excessive or insufficient KLeg is a modifiable
neuromuscular characteristic that is associated with loading rates and subsequent lower extremity
injury risk. As such, KLeg could be a clinical target for identifying individuals at heightened risk
of lower extremity injury and modifiable variable for reducing injury risk.
KLeg is derived from a multitude of neuromechanical and anatomical factors. 21, 22 We previously demonstrated that less passive foot, ankle, and hip mobility identified during a
clinical exam explained 49% of the variance in KLeg during running. However, factors explaining
the remaining variance have yet to be elucidated. KLeg is regulated in large part by lower
extremity muscle activity, 23 and investigation of neural drive to the musculature and the viscoelastic properties of musculotendinous units warrants further evaluation to provide a more
complete understanding of mechanisms of action for changing Kleg, thereby insight into targets
for clinical intervention. 24 For example, musculotendinous stiffness (MTS) quantifies a muscle’s resistance to lengthening and subsequent joint motion, 25 and potentially plays a critical role in determining KLeg.
KLeg is typically evaluated by calculating the ratio of the peak vertical ground reaction
force to the downward displacement of the total body center of mass during hopping via motion
capture, 26 and is synonymous with vertical stiffness (KVert) during hopping. However, KLeg during running requires additional information regarding leg length, running velocity, contact
time and half the arc swept by the leg. 27 Estimating KLeg during running is impractical in the clinical setting given the associated time, cost and expertise requirements. KLeg is commonly
3
feasible, particularly with the advancement of wearable technology (e.g. waist-mounted
accelerometers). 28 However, it is unclear if simple accelerometry can be used to assess the complex behavior of the lower extremity. Previous research demonstrates that accelerations
measured on the distal tibia are correlated with loading rate during running, 29, 30 and pelvis-mounted accelerometers are sensitive to center of mass acceleration. 31 Advancements in accelerometer technology may yield real time acceleration, and subsequently loading rate,
feedback that would allow runners to monitor and potentially alter lower extremity loading
during running. 28, 32
Additionally, it is unclear if KLeg during hopping is a valid representation of KLeg during
running. 17, 33 KLeg calculated during hopping typically assessed within a fixed frequency ranging1.5-3.2 Hz. 16, 34-37 However, running requires forward propulsion along with a greater variability in foot contact, forward velocity, and stride frequency. 38-40 As noted above,
calculating KLeg during hopping may represent a clinically-feasible assessment whereas the
additional data require to obtain these data during running require dedicated laboratory space and
expertise. Therefore, it is imperative to determine if KLeg during hopping reflects KLeg during
running to improve identification of individuals with heightened risk for running-related lower
extremity injury.
Further understanding of the neuromechanical contributors to KLeg and identifying
clinical KLeg assessment strategies is crucial for identifying individuals at greater risk for
lower extremity injuries and informing interventions designed to alter KLeg. The long-term
4
injuries. The overall objective of this application is to identify neuromechanical contributors to
KLeg. A secondary objective is to evaluate potential clinical indicators of KLeg. Our central
hypothesis is that lesser passive mobility, greater MTS, and greater muscle activation was
associated with greater KLeg. We will also assess the role of MTS in mediating the influence of
muscle activation on KLeg. We will test our hypotheses by assessing the following specific aims.
Specific Aims:
1. To identify neuromuscular contributions to KLeg during hopping and running.
Eccentric activity of the ankle plantarflexors and knee extensors likely influences lower
extremity flexion, and therefore KLeg. We hypothesize that greater KLeg will be associated
with greater ankle plantarflexor MTS and greater knee extensor MTS. Greater KLeg would
also theoretically be associated with greater ankle plantarflexor and knee extensor activation.
However, we hypothesize that MTS would mediate the influence of muscle activation on
KLeg such that individuals with greater MTS will require lesser muscle activation to achieve a
given level of KLeg. These variables was combined with the aforementioned passive clinical
measurements from our previous investigation in a multiple regression model to establish a
more robust estimate of KLeg.
2. To determine the relationship between KLeg during hopping via laboratory (motion
capture) and clinical (waist-mounted accelerometer) measurement techniques.
Advancements in wearable technology may allow for assessment of KLeg in the clinical
setting during hopping via waist-mounted accelerometry. We hypothesize that greater KLeg
assessed via laboratory methods during hopping was associated with greater KLeg derived
5
accelerometry is sensitive to changes in KLeg derived from motion capture induced by an
increase in hopping frequency. We anticipate that changes in KLeg identified via
accelerometry was correlated with changes in KLeg derived via motion capture. Additionally,
we hypothesize that loading rate and peak force derived from accelerometry will be
positively correlated with loading rate and peak force derived from motion capture.
3. To determine the relationship between KLeg during running and hopping.
KLeg is most commonly assessed during hopping and directly reflects KLeg given the
lower extremity’s vertical orientation. However, it is unclear if KLeg during hopping reflects
KVert and KLeg during running. We hypothesize that KLeg during single-leg hopping will be
correlated with KVert during running. Additionally, we hypothesize that KLeg during single-leg
hopping will be positively correlated with KLeg during running.
It is expected that by obtaining our objectives we will gain a deeper understanding of the
contributions to KLeg during dynamic activities. This will allow for an improved clinical
assessment and define rehabilitation targets. This will serve to reduce the risk and financial
burden of running injuries.
Potential pitfalls:
KLeg, along with MTS and muscle activation, are influenced by many factors including
type of activity, running and hopping velocity, fatigue, age, and current training level. In order to
limit the influence of external factors, we will focus our study on adult runners (age 18-40) who
6
injury during the 6 months prior to participation to ensure they are able to complete the study
protocol without pain or altered running/hopping biomechanics. These precautions will allow our
study cohort to reflect an endurance trained group while minimizing external confounding
variables. We will ensure our subjects meet the minimum activity requirements, but there may be
an unforeseen effect of greater training distance volume (e.g. Subject A runs 17 miles/week
while Subject B runs 75 miles/week). In order to account for this we will record current training
volume along with previous best times completed for the preferred race distance (e.g. 5k, 10k, or
marathon) for use as potential covariates. Additionally, previous research has indicated that
greater KLeg is independently associated with greater MTS and greater lower extremity EMG
activation. However, greater MTS with likely mediate and subsequently reduce the amount of
EMG required to generate the same resistance to lengthening of the tissue. Therefore, we
anticipate an inverse relationship between MTS and EMG when combined in a multiple
7
Chapter 2: Literature Review Running injuries
Running is an increasingly popular mode of exercise with over 64 million participants in
formal races in the United States in the spring of 2016. 41 Adults often select running for the positive health benefits 42-44 including reduced mortality and disability. 2, 3 Lee et al. 45 found that runners displayed a 45% lower risk of cardiovascular mortality, the most common cause of death
in the United States, compared to non-runners over a 15 year follow-up. However, as with any
athletic exposure, there is an increased risk for musculoskeletal injury during running
participation, which may serve as major deterrent to continued running participation. 46
Running related injuries occur in up to 79% of individuals who routinely run more than 5
kilometers, and 84% of novice runners experience a running related injury that results in time
lost from training. 4, 47 In conjunction with reduced participation in physical activity, these injuries lead to prolonged recovery, healthcare utilization, and time away from work. 5, 6 Hespanhol et al. 48, 49 estimated that each running related injury incurs $188-196 in costs
associated with healthcare utilization and absenteeism from work. 48, 50 The majority (>90%) of injured runners enter the healthcare system for injury management and treatment. 51 Healthcare utilization is often initiated via a general medical practitioner and often involves referral to a
specialist (e.g. physical therapist). 52 A conservative estimate of a 35% lower extremity injury rate in US runners with 90% healthcare utilization rate would incur an annual financial burden of
8
Runners experience a wide variety of injuries in the lower extremities. Over 80% of
running related injuries in collegiate cross country athletes occur in the lower extremity, 53 and up to 79% of recreational and competitive runners experience a lower extremity running related
injury. 4 There is no standard definition to categorize running related injuries. However the literature typically defines injuries based on 3 domains including a physical compliant,
reductions in training/competition, and/or seeking medical attention. 54, 55 Lower extremity injuries can be further categorized as a single, identifiable traumatic event or the more frequent
repetitive sub-traumatic injury which occurs gradually over time without appropriate healing.
Additionally, running related injuries can be loosely grouped into “hard” tissue (bony/cartilage)
injuries and “soft” tissue (ligament/musculotendinous) injuries. 55 The most frequent running
related injuries include both bony and soft tissues injuries of the lower extremity: patellofemoral
syndrome, iliotibial band syndrome, Achilles tendinopathy, plantar fasciitis, and medial tibial
stress syndrome. 56, 57
Several researchers have attempted to prospectively predict running related injury risk,
but with limited success and often conflicting results. Prior history of running related injuries
puts runners at increased risk for further injury. 4, 58-60 Therefore, it is imperative to reduce initial injury risk to prevent increased risk of future injury. Total distance run and intensity of miles run
are commonly used as markers for cumulative load experienced by the runner. This is supported
in the literature which has found that with increasing distance there is an increased risk for
overuse injury. 4, 59, 61 Van Gent et al. 4 completed a systemic review demonstrating that greater distance run is associated with a greater risk of running related injuries. However this was only
9
training distance was protective against running related knee injuries. Furthermore, intensity of
total distance run is frequently used to assess injury risk. Hespanhol et al. 60 found that runners who completed “speed training” displayed greater risk for injury, but this was not reflected by
van Poppel et al. 62 who found that runners who routinely participated in interval training displayed a lesser injury risk compared to those who did not. These discrepancies in the effects
of training distance and intensity on injury risk highlight the difficultly of accurately and
proactively assessing injury risk. A more tailored approach to assess the runner’s internal
response to the total external loading experienced during running may provide a more useful
injury risk assessment.
Running kinetics and kinematics provide a more informed approach to injury risk for
both soft and hard tissue running related injuries. Running subjects the lower extremity to
repeated landings that are predominantly mitigated by lower extremity joints and musculature. 23 Mitigating these repeated impact forces appropriately is important for reducing running injury
risk. 63 Hreljac et al. 64 found that injury free runners demonstrated significantly lesser peak vertical ground reaction force magnitude and loading rate compared to previously injured
runners. This relationship between loading rates and injury risk was further supported by Davis
et al. 11 who found female runners who had never been injured displayed significantly lower loading rates compared to those who went on to become injured. Greater loading rate is also
associated with bony and cartilage damage in animal models. 9, 10, 65, 66 Mitigating loading rate is predominantly managed by lower extremity articulations and musculature. The kinematic
10
for medial tibial stress syndrome. Dudley et al. 68 found prospectively that runners who displayed greater peak knee external adduction moment and greater peak ankle eversion velocity were
more likely to become injured over the course of a cross country season. Milner et al. 69 found that runners with a previous history of tibial stress fracture displayed greater knee stiffness
during the initial loading phase during running. Collectively, these data suggest that runners who
display greater loading rates are at a greater lower extremity injury risk. Clearly, an assessment
that accounts for both external load experienced by the runner and the associated kinematic
response is imperative to fully quantify injury risk and provide an individualized assessment
Lower extremity stiffness (KLeg) is influenced by both lower extremity kinematics and
kinetics, and may provide a more robust indicator of running related injury risk in the lower
extremity. KLeg can be examined further based on a joint analysis (e.g. knee stiffness vs ankle
stiffness); however, a more incisive analysis of the neuromuscular contributions to KLeg is
warranted. This would elucidate the underlying mechanisms of how the lower extremities
modulates impact loading during dynamic activities. A deeper understanding of these
neuromuscular contributions would allow for more effective, targeted rehabilitation practices and
potentially serve as an identifier for preventative interventions.
Lower extremity stiffness
Stiffness describes the ability of an object to resist deformation. 27 More specifically, this property is derived from Hooke’s Law which is defined as F = kx where the force required to
deform an object (F) is related to a spring constant (k) and the magnitude of linear deformation
(x). The spring constant (k) represents the relationship of force divided by displacement (F/x),
11
capable of deformation in a single plane. KLeg represents the stiffness of the lower extremity, and
is commonly estimated via a spring mass model describing downward displacement of the lower
extremity or total body center of mass on a massless spring during running and hopping,
respectively. 70, 71 Despite the relatively simple initial assessment, KLeg is multifactorial,
involving underlying biomechanical function, neuromuscular control, and contributions from all
involved ligament, tendons, cartilage, bones, and joints. 22, 27
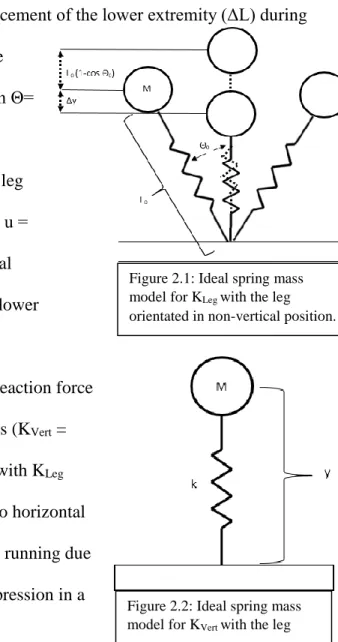
KLeg is more specifically represented by the ratio of the peak vertical ground reaction
force (Fmax) to the compression /downward displacement of the lower extremity (ΔL) during
running (Fmax/ ΔL) (Figure 2.1). ΔL represents the
change in leg length (ΔL = Δy + L0 (1-cos Θ) with Θ=
sin-1(utc/2L0), where Δy = maximum vertical
displacement of the center of mass; L0 = standing leg
length; Θ = half angle of the arc swept by the leg; u =
horizontal velocity; and tc = contact time). Vertical
stiffness (KVert) is a more simplistic model of the lower
extremity that is also commonly reported in the
literature as the ratio of the peak vertical ground reaction force
to the peak vertical displacement of center of mass (KVert =
Fmax / Δy) (Figure 2.2). 27, 71 KVert is synonymous with KLeg
during repetitive vertical hopping given there is no horizontal
velocity. However, KVert differs from KLeg during running due
to the fact that KLeg accounts for relative leg compression in a
Figure 2.1: Ideal spring mass
model for KLeg with the leg
orientated in non-verticalposition.
Figure 2.2: Ideal spring mass
model for KVert with the leg
12
non-vertical alignment along with center of mass displacement whereas KVert accounts for center
of mass vertical displacement only.
KLeg is vital for locomotion and describes the ability of lower extremity to modulate the
impulse associated with ground impact. KLeg is highly variable based on task demands and allows
the lower extremity to serve as a mobile adapter and allow for weight acceptance and subsequent
forward propulsion during running. Additionally, greater KLeg is linked with greater performance
parameters. Rogers et al. 72 demonstrated that greater KLeg was associated with faster and more economical running performance in well trained middle distance runners. This is also supported
by Nagahara et al. 73 who found that improvements in sprint performance over 6 months of training were associated increases in KVert. KVert and KLeg are dependent on and influenced by
task, surface, training history, contact time, age, fatigue, and previous injury. 27
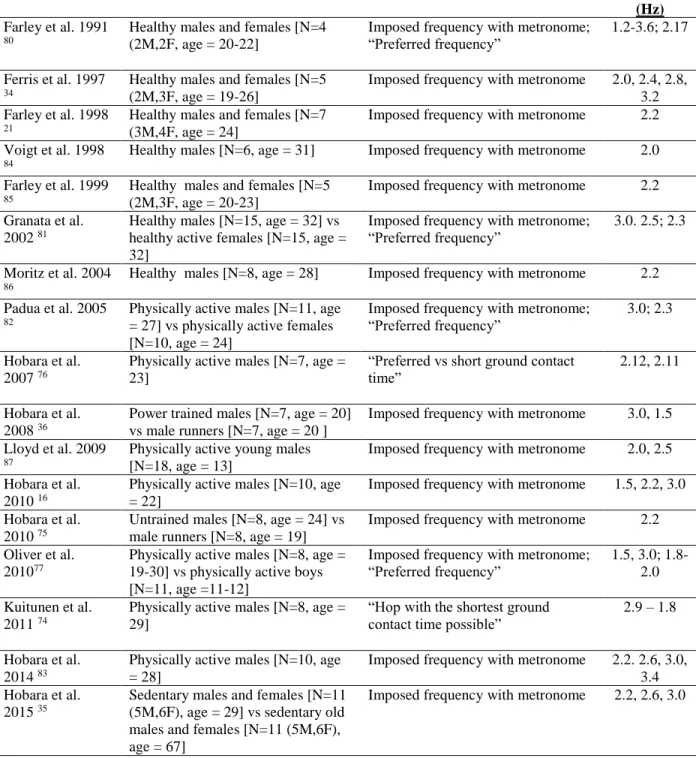
KLeg is task dependent and is most commonly assessed during hopping. 16, 18, 35, 36, 74-78 KLeg can also be obtained during running, however it requires a greater amount of variable
control to reproduce the same conditions among subjects (e.g. running velocity, contact time, and
arc swept by the leg) whereas the only variable controlled during hopping is frequency.
Therefore, KVert during hopping is reported more commonly in the literature.38-40, 79 Preferred human hopping occurs at or near 2.2 Hz 21, 77, 80 with ranges for comfortable hopping occurring between 1.5 and 3 Hz. Hopping frequencies outside of these ranges may not accurately represent
13
Study Population Hopping Task/Instructions Hopping
Frequency (Hz)
Farley et al. 1991
80
Healthy males and females [N=4 (2M,2F, age = 20-22]
Imposed frequency with metronome; “Preferred frequency”
1.2-3.6; 2.17
Ferris et al. 1997
34
Healthy males and females [N=5 (2M,3F, age = 19-26]
Imposed frequency with metronome 2.0, 2.4, 2.8,
3.2 Farley et al. 1998
21
Healthy males and females [N=7 (3M,4F, age = 24]
Imposed frequency with metronome 2.2
Voigt et al. 1998
84
Healthy males [N=6, age = 31] Imposed frequency with metronome 2.0
Farley et al. 1999
85
Healthy males and females [N=5 (2M,3F, age = 20-23]
Imposed frequency with metronome 2.2
Granata et al.
2002 81
Healthy males [N=15, age = 32] vs healthy active females [N=15, age = 32]
Imposed frequency with metronome; “Preferred frequency”
3.0. 2.5; 2.3
Moritz et al. 2004
86
Healthy males [N=8, age = 28] Imposed frequency with metronome 2.2
Padua et al. 2005
82
Physically active males [N=11, age = 27] vs physically active females [N=10, age = 24]
Imposed frequency with metronome; “Preferred frequency”
3.0; 2.3
Hobara et al.
2007 76
Physically active males [N=7, age = 23]
“Preferred vs short ground contact time”
2.12, 2.11
Hobara et al.
2008 36
Power trained males [N=7, age = 20] vs male runners [N=7, age = 20 ]
Imposed frequency with metronome 3.0, 1.5
Lloyd et al. 2009
87
Physically active young males [N=18, age = 13]
Imposed frequency with metronome 2.0, 2.5
Hobara et al.
2010 16
Physically active males [N=10, age = 22]
Imposed frequency with metronome 1.5, 2.2, 3.0
Hobara et al.
2010 75
Untrained males [N=8, age = 24] vs male runners [N=8, age = 19]
Imposed frequency with metronome 2.2
Oliver et al.
201077
Physically active males [N=8, age = 19-30] vs physically active boys [N=11, age =11-12]
Imposed frequency with metronome; “Preferred frequency”
1.5, 3.0; 1.8-2.0
Kuitunen et al.
2011 74
Physically active males [N=8, age = 29]
“Hop with the shortest ground contact time possible”
2.9 – 1.8
Hobara et al.
2014 83
Physically active males [N=10, age = 28]
Imposed frequency with metronome 2.2. 2.6, 3.0,
3.4 Hobara et al.
2015 35
Sedentary males and females [N=11 (5M,6F), age = 29] vs sedentary old males and females [N=11 (5M,6F), age = 67]
Imposed frequency with metronome 2.2, 2.6, 3.0
Table 2.1: Representative sample of hopping studies with respective populations and hopping frequencies
Greater KLeg is associated with greater hopping frequency and running velocity. Hobara et
14
ground contact time which limits the amount of center of mass displacement (Δy) during ground
contact and increases KVert. Greater KLeg induced by increased hopping frequency is supported by
Granata et al. 81 who found greater KLeg when subjects increased their hopping frequency to 3 Hz from their preferred hopping frequency of 2.34 Hz. This change in stiffness was predominantly
influenced by a reduction of center of mass displacement (Δy). Aramapatzis et al. 88 had subjects
complete drop jump landings from 20 cm, 40 cm, and 60 cm height. Subjects were then
instructed to obtain maximum jump height with the shortest amount of contact time following
initial landing. The subjects were then stratified into 5 groups with group 1 having the longest
contact time and group 5 having the shortest contact time. Across all drop jump landing heights,
group 5 displayed significantly lesser Δy and significantly greater Fmax which resulted in
significantly greater KLeg. Greater KLeg is also reflected during running with greater running
velocity and greater stride frequency. 89 Arampatzis et al. 90 had subjects run at five different running velocities between 2.5 and 6.5 m/s and reported greater KLeg with increasing velocity
primarily due to an increase in Fmax. Farley and Gonzalez 38 had subjects run at a variety of stride frequencies at 2.5 m/s on a treadmill that ranged from a 26% reduction in stride frequency to a
35% increase in stride frequency relative to the preferred frequency, and reported a 2.3x increase
in KLeg between the lowest and highest stride frequencies despite the fixed running velocity.
KLeg can be modulated within the first step of landing of a new surface with unexpected
stiffness. 15, 91 Ferris et al. 15 found that runners are able to decrease KLeg by 29% when transitioning from running on a compliant surface to a hard surface. This reduction in KLeg
allowed subjects’ center of mass displacement to remain consistent despite a reduction in surface
15
reductions in surface stiffness. 91 This increase in KLeg allows the runner to minimize center of mass disturbances to maintain overall trajectory and subsequent forward propulsion. This
maintenance of total overall stiffness is reflected during hopping as well. Ferris et al. 34 found that healthy young adults modulate their KLeg to maintain a similar overall total system stiffness
when hopping on a more compliant surface.
KLeg is predominantly influenced by active contributions from the musculature of the
lower extremity that alter individual joint stiffnesses. 22, 27, 88, 90 There is discrepancy in the literature regarding which joint musculature has the greatest influence on KLeg during dynamic
tasks. Several studies have demonstrated that knee stiffness has the greatest influence on KLeg.
Hobara et al. 92 found that knee joint stiffness serves as the primary determinant of KLeg during maximal vertical hopping with smaller contributions from the hip and ankle joints. This is also
supported by Arampatzis et al. 93 who found that increases in KLeg during drop jump landings from 20 cm and 40 cm were driven by increases in both ankle and knee stiffness. However, there
was a stronger correlation between KLeg and knee stiffness compared to ankle stiffness at both 20
cm (KAnkle = 0.52, KKnee = 0.69) and 40 cm (KAnkle = 0.18, KKnee = 0.74). Hobara et al. 16 also reported a significant increase in knee stiffness associated with increased KLeg when increasing
hopping frequency from 1.5 Hz to 3.0 Hz. This dominance of knee stiffness in determining lower
extremity stiffness is also observed during running. Kuitunen et al. 94 reported that change in knee stiffness was the primary determinant of change in KLeg during running. Subjects ran at
70%, 80%, 90% and 100% maximum velocity, and while ankle stiffness remained unchanged
across velocities, knee stiffness increased with increasing velocity was associated with the
16
The ankle joint has also been found to play an important role in KLeg modulation. Farley
et al. 21 had subjects complete bilateral hopping on surfaces with different stiffnesses, and found that as subjects moved from a stiff surface to a compliant surface, ankle stiffness increased 1.75x
to correspond with the increase KLeg while knee and hip stiffnesses did not significantly change.
This finding is supported by a follow up study by Farley et al. 85 in which subjects completed bilateral hopping at preferred and maximal heights, and found that increasing ankle stiffness by
1.9x caused a 2x increase in KLeg. When knee stiffness was increased by 1.7x there was a
minimal effect on KLeg. Muller et al. 95 reported ankle stiffness dominance as the determinant of KLeg during running during overground running over obstacles.
Other studies have found KLeg is modulated through different interactions across multiple
joints including significant changes in ankle and knee 75 and the knee and hip. 16 The literature suggests that KLeg is predominantly influenced by knee and ankle joint stiffness working in
concert to provide resistance to deformation and subsequent propulsion during ground contact.
Given the literature is equivocal regarding whether the knee or ankle joint musculature is the
most critical determinant to KLeg, the focus of this investigation will involve rigorous analysis of
both knee extensor and ankle plantarflexor musculature.
KLeg is also be influenced by age. Oliver et al. 77 found that men (19-30 y.o.) had greater stiffness compared to young boys (11-12 y.o.) hopping at higher frequencies (3 Hz) but not at
lower frequencies (1.5 Hz). Similar results have been reported in 15 y.o. boys compared to 9 y.o.
17
greater EMG activation despite displaying lesser KLeg. 97 Contrastingly, this is not supported by Hobara et al. 35 who found that KLeg did not differ between older and younger adults during hopping. Given these variations in KLeg across age ranges, our investigation will focus on adults
who have reached a similar level of musculoskeletal maturity between the ages of 18-40.
KLeg is also dependent on the level of training, with more highly trained subjects
displaying greater KLeg during dynamic activities. Power training athletes have greater KLeg
during hopping compared to endurance athletes. 36 Additionally endurance trained athletes display greater KLeg during hopping vs untrained subjects.75 Greater KLeg is also associated with improved performance; subjects who demonstrate greater vertical jump height and achieve
greater running velocities display greater KLeg during jumping and running. 73, 98, 99 This indicates that athletes may have an “optimal KLeg” for performance that increases with performance
demands 88. To ensure similar training levels throughout our study, we will recruit only runners who have been running a minimum of 15 miles/week for at least 3 months. 100
Several studies have examined the effects of fatigue on lower extremity stiffness. With
repeated 40m sprints, KVert was significantly decreased, but KLeg remained constant throughout
12 repetitions. 101 An analysis was repeated over 100m repetitions to fatigue in which decreases in KVert, step frequency, and contact time were noticed as the trials progressed. However, KLeg
again remained relatively constant despite a decrease in mean and maximum running velocity. 102 Evidence suggests that there may be both KVert and KLeg decrease with longer runs to exhaustion.
79, 103, 104 However, this contrasts with Degache et al. 105 who found runners maintained KLeg and
18
also evidence that skilled runners do not alter motor patterns in response to fatigue. During 4
repetitions of 100 m to fatigue, skilled sprinters were able to maintain KLeg and even increase it
on the fourth repetition. 106 The skilled sprinters showed minimal change in stride frequency throughout the trials which is different from novice sprinters. They were also able to maintain
consistent contact time intervals whereas novice sprinters demonstrated increased contact time
and subsequently decreased KLeg. In order to minimize fatigue, subjects in our investigation was
instructed to maintain normal training volume during the time frame of the data collection and
refrain from running on the collection day.
KLeg is a relatively simple measurement to describe the complex interaction and
modulation of the lower extremity during dynamic activities. As described by Latash et al. 22 the modulation of the lower extremity requires regulated neuromuscular control of all lower
extremity to generate appropriate stiffness and subsequent propulsion however may not
adequately be modulated to reduce injury risk.
Stiffness and injury risk
Both hopping and running entail an eccentric loading phase to control center of mass
descent followed by a concentric propulsive phase to propel the center of mass forward or
upward, respectively. This interaction is derived from Newton’s second law (FΔt=mΔv) in which
the impulse (FΔt) is equal to the force (F) applied multiplied by the change in time (Δt) and
momentum (mΔv) is equal to the mass of the individual (m) multiplied by the change in velocity
(Δv). In order to achieve faster running velocities, there is a greater change in velocity along with
a shorter ground contact time. Since the individual’s mass remains constant, there must be an
19
This impulse during eccentric loading affects musculoskeletal tissues differently due to
differences in their viscoelastic properties. The elastic modulus is the ratio of stress, the amount
of external force per cross sectional area placed on the tissue, to strain, which represents the
amount of relative deformation the tissue subsequently undergoes compared to original length of
the tissue. This ratio is the material analog of stiffness after accounting for the size of the tissue.
The elastic modulus also influences the strain the tissue can undergo prior to reaching its yield
point which further stress causes tissue
damage. For instance, compression of
skeletal bone and articular cartilage
demonstrate relatively high elastic modulus
which permits a large amount of stress to be
applied while demonstrating minimal strain.
However, lengthening of skeletal muscle,
tendon and ligaments display a relatively smaller elastic modulus, and consequently experience
relatively large deformation relative to the stress placed upon them along with a smaller amount
of stress the tissue can withstand prior to incurring damage (Figure 2.3).
The amount of force applied to a tissue along with the rate it is applied is crucial for
understanding injury risk. Greater loading rate has been linked with potential injury in both
animal and human models. 9-11, 66, 107, 108 This impulsive, or high rate, loading has negative effects on both bone and cartilage health. Radin et al. 9 found biomarkers of both bone and cartilage breakdown after cyclical loading rabbit’s knees at 1.5x body weight at 40 cycles/min for 20-40
minutes/day over periods of 9, 15 and 20 days. Subchondral bone metabolic breakdown and
20
stiffening was observed after 9 days of loading that was exacerbated at 20 days. After a rest
period during which subchondral bone biomarkers returned to baseline levels, metabolic
biomarkers of cartilage breakdown remained elevated. This study served as a groundwork for a
later study by Radin et al. 10 which repeated 1.5x body weight cyclical loading of rabbit’s knees over periods of 1, 2 and 3 days as well as 1, 3 and 6 weeks. A similar protocol of 40 minutes of
loading of 60 cycles/min was completed daily with the load delivered across a 50 ms window.
This greater, or impulsive, loading rate was deleterious for bone and cartilage health.
Subchondral bone stiffening was observed, particularly at the bone/cartilage interface. The
stiffened subchondral bone caused increased stress and eventual fracture of the cartilage matrix
with cartilage fibrillation observed after 3 weeks of loading. The influence of loading rate
compared to overall load was analyzed by Radin et al. 66 who found that severe cartilage fibrillation occurred more frequently at higher loading rates compared to lower loading rates.
This damage occurred even when the joint exposed to lower loading rates demonstrated greater
overall load. The importance of rate of loading was further examined by Ewers et al. 109 who found that the same magnitude of load applied over 5 ms compared to 50 ms generated more
surface fissuring in rabbit retropatellar cartilage. This is supported in human subjects by Radin et
al. 110 who found that subjects with mild knee pain demonstrated significantly greater loading rate and subsequent tissue damage during walking as compared to asymptomatic controls. This
impulsive loading occurred within the first 25 ms following ground contact which has been
shown to be potentially damaging to bone and cartilage including joint effusion, fibrillation of
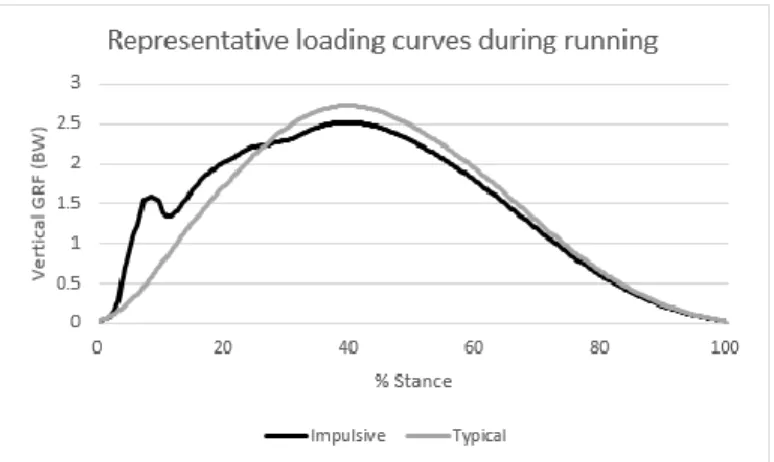
21 Impulse is induced to the lower
extremity during ground contact through
the vertical ground reaction force
(Figure 2.4). The vertical ground
reaction force in certain populations can
mirror impulsive loading in animal
models. The peak loading magnitude and
rate of loading are associated with injury risk. Zadpoor et al. 12 completed a meta-analysis and found that greater average and instantaneous loading rate plays a significant role in tibial and
metatarsal stress fracture injury risk. Davis et al. 11 found retrospectively that runners who displayed greater vertical average loading rate were more likely to experience a tibial stress
fracture. This relationship between loading rate and injury risk was also found prospectively by
Bredeweg et al. 111 who found that novice male runners who went on to become injured during a running training program displayed greater loading rates and shorter ground contact times
compared to the male runners that remained uninjured. However, this relationship was equivocal
since there were no significant relationships between loading rate and contact time in the female
runners. This demonstrates that the loading experienced by the lower extremity can contribute to
injury risk; however, the response to this loading can be mitigated by altering lower extremity
joint angle position and “tuning” the lower extremity muscles to dampen the peak vertical impact
forces. 112 This demonstrates the need for further examination of the ability of the lower extremity musculature to alter the response to external loads during dynamic tasks.
22
KLeg is influenced by both running kinematics and kinetics, and is associated with injury
risk. Williams et al. 13, 113 found that runners with higher, stiffer arches exhibited a greater number of ankle and bony injuries whereas runners with lower, more compliant arches exhibited
more knee and soft tissue injuries. Lorimer et al. 114 found that greater KLeg is associated with higher risk for Achilles tendon injury in runners. Retrospectively, Maquirriain 18 found that subjects with Achilles tendinopathy demonstrated lesser KLeg during single leg hopping on the
affected limb compared to the unaffected limb. Pruyn et al. 115 also found that inter-limb
differences in KLeg were associated with a greater number soft tissue injuries in Australian rules
football players. Prospectively, greater KLeg also resulted in greater risk for hamstring injury in
Australian rules football players during a season. 116 Both excessive and insufficient KLeg appear to increase lower extremity injury risk to musculotendinous and bony tissues. As such, KLeg may
serve as a proxy for lower extremity injury risk in runners. This study will examine the
neuromuscular contributions to KLeg, thereby elucidating the specific mechanisms for altering
KLeg and potentially allow for more targeted preventative and rehabilitative exercise programs.
Neuromuscular contributions to lower extremity stiffness
Skeletal muscle activity and elastic energy return from tendons are the primary method
for producing and transmitting force in the human body. The basic muscle model was first
proposed by A.V. Hill and then improved upon by Huxley with the development of the
cross-bridge theory. 117-119 These developments in modeling demonstrate that both muscle and tendon are viscoelastic tissues with a contractile element (i.e. muscle), a series elastic element (i.e.
tendon) and an additional parallel elastic component associated with the total passive tissues
23
running This muscle tuning can be influenced by active muscle activation as well as passive
musculotendinous stiffness.
Muscle Activity
KLeg is influenced by muscle activation measured by electromyography (EMG) prior to
and during ground contact. EMG measures the relative neural drive to muscles and yields
information regarding muscle on/off times and duration as well as relative muscle activation.
EMG during running and hopping is typically analyzed 200 ms prior to ground contact
(EMGPRE) and up to 200 ms after ground contact (EMGPOST). 16, 36, 76, 95, 100 Generally, EMGPOST can be broken into eccentric and concentric phases, with the instant of the lowest vertical
position of the center of mass serving as the transition between the eccentric loading phase and
the concentric propulsive phase. The EMGPOST signal can be further broken down to analyze the
acute neuromuscular response during ground contact. Specifically, the first 0-30 ms is often
termed background activity (EMGBG) prior to subject response. From 30-60 ms (EMGM1), the
EMG signal represents the voluntary supraspinal muscle activity as well as a short-latency
stretch reflex. Lastly, from 60-90ms (EMGM2) represents voluntary muscle activity and a
long-latency stretch reflex. Responses occurring 100 ms after ground contact are characterized as a
strictly voluntary motor response. 16, 36, 76, 84, 120-124
However, EMG activation does not have a direct association with KLeg. Inducing greater
or lesser KLeg (e.g. changing ground contact time, verbal performance instructions, etc.) can yield
varied EMG response patterns of the lower extremity musculature based on the interaction
between muscular demands and lower extremity touchdown angles. Several studies suggest that
24
EMG activation during hopping with shorter contact times (i.e. greater KLeg) compared to
preferred contact times. Greater running velocity is also associated with greater EMG activity
and KLeg. Kuitunen et al. 94 reported increases in soleus, rectus femoris and vastus lateralis EMG amplitudes as subjects ran at progressively faster speeds (70%, 80%, 90%, and 100% maximal
velocity). This is also reflected by Castro et al. 125 who demonstrated increases in rectus femoris, vastus lateralis, vastus medialis and lateral gastrocnemius activation at 100% vs. 60% maximal
running velocity. Greater activation of the ankle plantarflexors and knee extensors as noted in
these previous investigations is associated with greater KLeg. 126 Collectively, these data indicate that individuals with greater lower extremity stiffness likely display greater activity in lower
extremity muscle groups during hopping and running.
However, these previous studies conflict with other research demonstrating that lower
EMG activation is associated with greater KLeg during dynamic tasks. Hobara et al. 36 reported that power trained athletes displayed lesser EMG activation of the ankle plantarflexors and knee
extensors but greater KLeg during bilateral hopping at 3 Hz compared to endurance trained
athletes. Additionally, both power trained and endurance trained athletes demonstrated lesser
EMG amplitudes and greater KLeg when hopping at 3 Hz compared 1.5 Hz. This is also
supported by Hobara et al. 16 who found that healthy subjects displayed lesser EMGM1 activation of the knee extensors when hopping at 3 Hz compared to 1.5 Hz, as well as lesser EMGM2
activation of the ankle plantarflexors and knee extensors when hopping at 3 Hz compared to 1.5
Hz. These differing results could be attributed to methodical differences. Previous research that
found greater EMG activation associated with greater KLeg had subjects complete a submaximal
25
movement pattern by instructing them to hop with minimal contact time 76 or increase running velocity maximally. 94, 125 Hobara et al. 76 found that even though subjects increased their KLeg with reduced contact time during hopping, they displayed similar hopping frequencies (short
contact time: 2.11 Hz, preferred contact time: 2.12 Hz). These data suggest further analysis of
muscle activity of the ankle plantarflexors and knee extensors during hopping and running are
warranted to understand neuromuscular contributors to KLeg.
Training status also effects KVert, with endurance trained athletes displaying greater lower
extremity EMG activity with lesser KVert and power trained athletes demonstrating lesser lower
extremity EMG activity with greater KVert during hopping at 2.2 Hz.36 Baur et al. 127 found that weekly training volume influenced lower extremity muscle activation patterns in male runners
with lower training runners (< 30 km/week) displaying greater gastrocnemius activation during
the weight acceptance phase of running compared to both intermediate (30 -45 km/week) and
high (>45 km/week) training runners. However this group difference was reversed during
push-off in which the lower training runners displayed significantly less gastrocnemius activation
compared to intermediate and high training runners. Alterations in EMG activation are also seen
in subjects who complete resistance training. Jenkins et al. 128 had male subjects complete a 6 week resistance training protocol utilizing high load (80% 1-rep max) vs low load (30% 1-rep
max) for the leg extensors. Both groups displayed improvements in strength; however the high
load group displayed greater leg extensor EMG activation during maximal contraction compared
to the low load group. However, the high load group displayed lesser EMG activation during
submaximal contractions. To ensure our subjects minimize the influence of training on EMG
26
lower extremity musculature resistance training <3 times/week. Additionally we will track
average weekly training distance to account for any neuromuscular changes associated with
greater training volume.
These studies demonstrate the importance of understanding the interplay of EMG
activation patterns in modulating both KVert and KLeg. Training status of the subjects must also be
accounted for, as endurance trained subjects appear to utilize relatively less EMG activation
compared resistance trained subjects during submaximal tasks. Collectively, these data suggest
that endurance trained subjects demonstrate greater EMG activation of the ankle plantarflexors
and knee extensors during preactivation and weight acceptance compared to strength trained
individuals during hopping. This greater activation is associated with lesser lower extremity
compression, lesser center of mass displacement, and greater KLeg during dynamic activities.
Therefore the focus of this study will analyze similarly trained runners to ensure the effect of
training is minimized and subsequently reduce a potential confounding factor of training.
Musculotendinous stiffness
Musculotendinous stiffness (MTS) describes the ability of the muscle-tendon unit to
resist changes in its length. This measure takes into consideration contributions from passive
structures, the active muscle fibers generating force and the tendon which serves as a power
amplifier and energy redistributor to the skeletal system. 129
MTS plays a role in muscle performance and subsequent overall dynamic performance.
27
athletic performance. MTS is modifiable by training and increases with both isometric and
plyometric training. 131-133 Spurrs et al. 131 had long distance runners complete a 6 week course of plyometric training in conjunction with their normal training load after which the MTS of the
ankle plantarflexors increased bilaterally. Additionally, the runners demonstrated lesser
metabolic demand during running at fixed velocities compared to pre-test and a 2.7% reduction
in time during a 3 km time trial. The improvements in performance during the 3 km run were
without a subsequent increase in metabolic demand. This demonstrates non-oxygen dependent
muscular changes that may be associated with greater elastic energy return allowed for
improvements in running velocity and endurance.
It is well known that training improves muscle size and strength,134 however the tendon is also modifiable and demonstrates unique stiffness independent of training and sex. Females
demonstrate lower tendon stiffness compared to males.135 Tendon structures display greater stiffness after exposure to training driven by changes in elastic modulus. Bayliss et al. 136 found that the Achilles tendon of the take-off leg of a jumping athletes displayed greater stiffness
compared to the flight leg. However, tendon stiffness can also decrease with training. Kubo et al.
137 found that long distance runners displayed lesser knee extensor and plantarflexor tendon
stiffness during a road racing season compared to a track season. Tendon stiffness is also
variable across muscle groups in trained populations. Sprinters display more compliant tendons
for the knee extensors, but not for the plantarflexors compared to healthy controls. 138 Long distance runners display less extensible knee extensor tendons compared to controls, but not for
28
but more compliant ankle plantarflexor tendons. Given this influence on running distance, we
will collect weekly running distance, weekly training pace along with best performance in a race
(e.g. 5k, 10k, or marathon) within the previous year.
MTS also potentially plays a role in injury prevention. Blackburn et al. 141-143 found that greater hamstring MTS may be associated lesser ACL loading. Greater hamstring MTS
associated with greater knee flexion during peak anterior tibial shear force and peak internal
knee-extension and –varus moments during landing. This demonstrates that greater MTS may be
protective against excessive or abnormal joint loading, but may increase musculotendinous and
overuse injury risk. Runners with a previous history of tibial stress fracture displayed greater
ankle plantarflexor MTS compared to healthy runners. 144 Watsford et al. 116 prospectively found that Australian rules football players who demonstrated greater hamstring MTS were more likely
to sustain a non-contact hamstring injury during the season. Given KLeg is a combination of
individual stiffnesses of joints, muscles, tendons and ligaments along with the neuromuscular
control of contractile muscular tissue 22 there is likely an optimal KLeg for performance for maximal vertical jump performance, 88 but optimal values for both KLeg and MTS for minimizing injury risk have yet to be determined.
Greater EMG activation is associated with greater muscle fiber force. However absolute
EMG activation is not synonymous with absolute muscle force. 145 The muscle tendon unit can be tuned to provide appropriate muscle force for the desired total muscle-tendon action 146. The muscle-tendon unit can perform as a motor providing positive work, a brake generating negative
29
tendon deforms and recoils generating elastic force. 147 This highlights the interplay between EMG activation and MTS and their respective ability to alter the muscle-tendon unit. The ankle
plantarflexors and knee extensors are associated with eccentrically controlling center of mass
descent during landing. Therefore greater MTS would require greater external tensile force to
lengthen the muscle-tendon unit and subsequently induce joint angle changes (e.g. a stiffer knee
extensor muscle group would provide greater resistance to knee flexion). Since KLeg is influenced
by the characteristics of all involved tissues, we hypothesize that greater stiffness values in the
muscle-tendon unit via MTS was associated with greater KLeg during hopping. We anticipate that
MTS will mediate the influence of EMG activation on KLeg.
As previously stated, KLeg is predominantly modulated through the knee and ankle joints.
16, 21, 75, 85, 90, 92-95, 148 Man et al. 149 found that metatarsophalangeal stiffness was positively
correlated with KVert and KLeg during running indicating that restrictions in one of the lower
extremity joints is associated with overall global stiffness of the lower extremity. This is
supported by Nagahara et al. 73 who found that sprinters increased their KVert by increasing ankle stiffness via reduced ankle dorsiflexion displacement during running. By increasing the stiffness
of the individual joints of the lower extremity, there is a reduced capacity of the lower extremity
to compress during ground contact. This hypothesis is supported by previous research
demonstrating that lesser passive range of motion at multiple joints of the lower extremity
observed during a clinical exam was associated with greater KLeg (Goodwin et al., In Review).
Subjects who displayed lesser hip internal rotation, ankle dorsiflexion, and lesser first ray
mobility exhibited greater KLeg during overground running. This supports the previous research
30
reduced capacity of the lower extremity to deform (e.g. landing in an extended posture, joint
capsule and musculotendinous restrictions) would be associated with greater KLeg during
dynamic tasks.
Previous literature demonstrates that training affects MTS levels, and endurance trained
runners likely display greater MTS. 131, 132, 139, 140 Additionally, elite level runners demonstrate lesser EMG activation of the lower extremity musculature during dynamic activities compared to
national level runners. 150 Spurrs et al 131 reported increases in lower extremity MTS following a plyometric training protocol. This increase in MTS was associated with improvements in 3k
running performance, but in the absence of an increase in metabolic demand. This supports the
notion that there is improved energy production, via stored elastic return of passive tissues,
which is not associated with active muscle contributions which would be represented in
metabolic demand. Independently, greater MTS and greater EMG activation are associated with
greater KLeg. However, EMG activation contributes to the active component of MTS and,
therefore, MTS may mediate the amount of required muscle activation. Specifically, individuals
with greater MTS likely require a lower level of muscle activation to achieve the same level of
resistance to lengthening. This greater MTS with lesser EMG activation is due in part to the
greater amount of passive stiffness components of the muscle tendon unit (e.g. stiffer tendon and
aponeurosis). For example, a subject with greater MTS will require lesser EMG activation to
obtain the overall resistance the tissue lengthening. Given this relationship, we anticipate that
MTS and EMG will display an inverse relationship when compared to KLeg during hopping and
31
Aim 1 of this project is to identify neuromuscular contributions to KLeg during hopping
and running. We hypothesize that greater ankle plantarflexor MTS combined with lesser ankle
plantarflexor EMG activation was associated with greater KLeg. Additionally we hypothesize that
this inverse relationship will also be reflected with greater knee extensor EMG activation and
lesser knee extensor MTS associated with greater KLeg. Limited ankle and knee joint
displacement during hopping and running induced by restrictions in both passive and active
muscular tissue extensibility will reduce lower extremity compression. These variables was
combined with the aforementioned passive clinical measurements from our previous
investigation in a multiple regression model to establish a more robust estimate of KLeg.
MTS was assessed by calculating linear stiffness of the ankle plantarflexors and knee
extensors. Linear stiffness (k) was calculated utilizing the damped oscillatory method using the
equation k = 4π2mf2 where (m) represents total mass of the system, (f) represents the damped
frequency of the oscillation calculated as the inverse of the first two successive oscillatory time
peaks. 151, 152 The total mass of the system includes the total mass of the foot and shank 153 along with the applied load. This load is typically 30-50% of previously obtained maximal voluntary
contraction force.
EMG activation normalized to standing muscle activity of the knee extensors and ankle
plantarflexors was averaged 75 ms prior to and 75 ms after ground contact during hopping. EMG
activation was average as one value for knee extensor activation and one value for ankle
32
activity with anticipation to ground contact, short-stretch cycle activity during ground contact,
and subsequent concentric muscle action to prepare for the next hopping aerial phase. 36, 76
Clinical Application
KLeg is a global measure assessing the lower extremity’s ability to decelerate the center of
mass and reaccelerate it to the next step during gait, and is linked with potential injury risk.
Assessing KLeg with motion capture is ideal in a dedicated laboratory setting with the capacity to
analyze lower extremity kinematic and kinetic variables. However, given the increased cost for
motion capture equipment and time for personnel training, this set up does not reflect the
majority of current clinical capacities. Estimating KLeg in the clinical setting requires at minimum
a force plate to measure ground reaction forces. 87, 154 However, portable body-worn
accelerometers have emerged as novel method to track activity level, and may permit an estimate
of KLeg. 155, 156
Accelerometers
Accelerometers can be utilized to estimate both position data and loading during dynamic
activities. Uni-axial acceleration data is reflective of the kinetic loading response during ground
contact by multiplying the acceleration curve by the subject’s mass to obtain the vertical force
curve. During vertical hopping the predominant acceleration experience by a subject is in the
vertical direction. Tri-axial accelerometers could be used to obtain resultant acceleration vector
to account for landing in a non-vertical position (e.g. running). KLeg may also be calculated via