GALAXY STRUCTURE AS A DRIVER OF THE STAR FORMATION SEQUENCE SLOPE AND SCATTER
Katherine E. Whitaker1,2,11, Marijn Franx3, Rachel Bezanson4,11, Gabriel B. Brammer5, Pieter G. van Dokkum6, Mariska T. Kriek7, Ivo Labbé3, Joel Leja6, Ivelina G. Momcheva6, Erica J. Nelson6, Jane R. Rigby1, Hans-Walter Rix8,
Rosalind E. Skelton9, Arjen van der Wel8, and Stijn Wuyts10
1
Astrophysics Science Division, NASA Goddard Space Flight Center, Code 665, Greenbelt, MD 20771, USA 2
Department of Astronomy, University of Massachusetts–Amherst, Amherst, MA 01003, USA;[email protected] 3
Leiden Observatory, Leiden University, P.O. Box 9513, 2300 RA Leiden, The Netherlands 4
Steward Observatory, Department of Astronomy, University of Arizona, AZ 85721, USA 5
Space Telescope Science Institute, 3700 San Martin Drive, Baltimore, MD 21218, USA 6
Department of Astronomy, Yale University, New Haven, CT 06520, USA 7
Astronomy Department, University of California, Berkeley, CA 94720, USA 8
Max Planck Institut fur Astronomie, Königstuhl 17, D-69117 Heidelberg, Germany 9
South African Astronomical Observatory, P.O. Box 9, Observatory, Cape Town, 7935, South Africa 10
Max-Planck-Institut fr extraterrestrische Physik, Postfach 1312, Giessenbachstr, D-85741 Garching, Germany Received 2015 June 25; accepted 2015 August 18; published 2015 September 22
ABSTRACT
It is well established that(1)star-forming galaxies follow a relation between their star formation rate(SFR)and stellar mass (M), the “star formation sequence,” and(2) the SFRs of galaxies correlate with their structure, where star-forming galaxies are less concentrated than quiescent galaxies at fixed mass. Here, we consider whether the scatter and slope of the star formation sequence is correlated with systematic variations in the Sérsic indices, n, of galaxies across the SFR–M plane. We use a mass-complete sample of 23,848 galaxies at 0.5 <z <2.5 selected from the 3D-HST photometric catalogs. Galaxy light profiles parameterized byn are based onHubble Space TelescopeCosmic Assembly Near-IR Deep Extragalactic Legacy Survey near-infrared imaging. We use a single SFR indicator empirically calibrated from stacks of Spitzer/MIPS 24μm imaging, adding the unobscured and obscured star formation. We find that the scatter of the star formation sequence is related in part to galaxy structure; the scatter due to variations innatfixed mass for star-forming galaxies ranges from 0.14±0.02 dex atz∼2 to 0.30±0.04 dex atz<1. While the slope of thelog SFR log– M relation is of order unity for disk-like galaxies, galaxies with n>2 (implying more dominant bulges)have significantly lower SFR M than the main ridgeline of the star formation sequence. These results suggest that bulges in massivez∼2 galaxies are actively building up, where the stars in the central concentration are relatively young. Atz<1, the presence of older bulges within star-forming galaxies lowers globalSFR M, decreasing the slope and contributing significantly to the scatter of the star formation sequence.
Key words:galaxies: evolution –galaxies: formation–galaxies: high-redshift
1. INTRODUCTION
One of the outstanding problems in galaxy formation is understanding the causal relationship between the morpholo-gies and star formation histories of galaxies. There is increasing evidence that galaxies with quiescent stellar populations have significantly smaller sizes and more concentrated light profiles than actively star-forming galaxies at fixed stellar mass out to
z=2.5 (Kriek et al. 2009; Williams et al. 2010; Wuyts et al.2011b; van der Wel et al.2014). We know that quenching occurs, causing one population to migrate to the other. However, the process(es) that are primarily responsible for the shutdown of star formation are not well understood. It is yet unclear if the well-defined correlation between stellar mass and star formation rate(SFR; e.g., Brinchmann et al.2004; Noeske et al. 2007; Whitaker et al. 2014; Schreiber et al. 2015, and numerous others)is driven by galaxy mass alone, or if some other parameter, such as surface density(Franx et al.2008)or bulge mass(Lang et al.2014), comes into play.
In the nearby universe, Abramson et al. (2014) find that increasing the galaxy bulge mass-fraction lowers the global specific SFR(sSFRºSFR M). Their working assumption is that star formation occurs in disks(Kennicutt1998), and bulges
are composed primarily of older stars. While the bulge contributes to the total stellar mass of the galaxy, it does not significantly contribute to the global star formation, thereby depressing the sSFR. This naturally predicts aflattening of the galaxy log SFR log– M relation at the massive end where galaxies are bulge-dominated. Whitaker et al.(2014)measure a strong evolution in the slope of the star formation sequence at the massive end, consistent with a flat slope atz<0.5 and a slope close to unity atz>2.5. In other words, even atz∼2 we are seeing a depression in the global specific SFRs among massive galaxies.
Lang et al. (2014) decomposed the bulges and disks of massive high-redshift galaxies out to z=2.5. They speculate that significant bulge growth precedes the departure from the star formation sequence. Lang et al. further demonstrate that the bulge mass is a more reliable predictor of quiescence than the total stellar mass(see also Bell et al.2012). To understand the regulation and quenching of star formation in galaxies across cosmic time, we must take these analyses one step further and connect the structural evolution of quiescent and star-forming galaxies with their sSFRs.
Before we can understand the details of how galaxies quench their star formation, we mustfirst synthesize the properties of massive galaxies in a self-consistent manner. Such an analysis © 2015. The American Astronomical Society. All rights reserved.
11
requires a robust quantification of the rest-frame optical galaxy structural properies and a single indicator for the total obscured and unobscured star formation in galaxies for the entire population. In this Letter, we combine Sérsic index measure-ments derived from Cosmic Assembly Near-IR Deep Extra-galactic Legacy Survey (CANDELS)/WFC3 imaging with totalUV +IR SFRs, usingSpitzer/MIPS 24μm photometry, extending the 24μm stacking technique presented in Whitaker et al. (2014) to probe a range in structural parameters. We present the trends between galaxy M, total sSFR, and n at 0.5 < z < 2.5, exploring the dependence of the slope and scatter of the star formation sequence on galaxy concentration. In this Letter, we use a Chabrier(2003)initial mass function and assume a ΛCDM cosmology with W =M 0.3, W =L 0.7,
and H0=70km s−1Mpc−1. All magnitudes are given in the
AB system.
2. DATA AND SAMPLE SELECTION
2.1. Stellar Masses, Redshifts, and Rest-frame Colors
We take advantage of the Hubble Space Telescope (HST)/ WFC3 and ACS photometric and spectroscopic datasets infive well-studied extragalacticfields through the CANDELS;(Grogin et al. 2011; Koekemoer et al. 2011) and the 3D-HST survey
(Brammer et al.2012). Using stellar masses, redshifts, and rest-frame colors from the 3D-HST 0.3–8μm photometric catalogs
(see Skelton et al.2014), we select samples of 9400, 8278, and 6170 galaxies greater than stellar masses oflogM M=8.8,
9.0, and 9.6 in three redshift intervals of 0.5 < z < 1.0, 1.0<z<1.5, and 1.5<z<2.5. The galaxies are split into star-forming and quiescent sub-samples based on their rest-frame
U-V and V-J colors, following a modified definition of Whitaker et al.(2012a).12We have used theSpitzer/IRAC color selections presented in Donley et al. (2012) to identify and remove luminous active galactic nuclei (AGNs); 3% of the sample were removed as AGN candidates. We note that the results of this Letter do not depend on this step. Thefinal sample comprises 23,848 galaxies at 0.5<z<2.5.
We indicate the stellar mass limits for which the majority of objects in the sample have HF160W <23.5 (see Section 2.2).
These limits are well above the mass-completeness limits presented in Tal et al. (2014), which are determined by comparing object detection in CANDELS/deep with a re-combined subset of exposures reaching the CANDELS/wide depth. The stellar masses of star-forming galaxies have been corrected for contamination of the broadband fluxes from emission lines using the values presented in Appendix A of Whitaker et al. (2014). These corrections only become significant at logM M<9.5 and z>1.5. For example,
Whitaker et al. (2014) find that stellar masses of
M M
log =9.5 are overestimated by 0.06 (0.2)dex at z
1.5< <2.0(2.0< <z 2.5)because of emission linefluxes. Where available, we combine the spectral energy distribu-tions with low-resolution HST/WFC3 G141 grism spectro-scopy to derive grism redshifts with Dz (1+z)=0.3%
accuracy (Brammer et al.2012). We select the“best”redshift to be the spectroscopic redshift, grism redshift or the photometric redshift, in this ranked order depending on availability. Photometric redshifts comprise 62% (79%)of the
z
0.5< <1.5(1.5< <z 2.5)sample, while 26%(19%)have grism redshifts and 12%(2%)spectroscopic redshifts.
2.2. Morphology
The Sérsic (1968) index is a measure of the shape of the surface brightness profile of a galaxy, indicating the concentra-tion of the light; it has been shown to correlate with quiescence
(e.g., de Vaucouleurs1948; Caon et al.1993). At 1<z<3, Bruce et al. (2014) demonstrate that n =4 corresponds to a bulge-to-disk ratio of about four in massive galaxies, where
∼80% of the light is in the bulge. Exponential disks haven=1 and bulge-to-disk ratios of about a quarter, with20% of the light in the bulge. The transition from bulge-dominated to disk-dominated occurs around n =2. We caution that we are not directly measuring the bulge mass-fractions, rather adoptingn as a proxy for bulge dominance. Furthermore, it is not clear whether this interpretation ofn holds atz1.
nis measured fromHST/WFC3JF125Wat0.5< <z 1.5and
HF160Wat1.5< <z 2.5(van der Wel et al.2012). Simulations by van der Wel et al.(2012)show that the systematic errors in n for all galaxy types are <10% for HF160W <23.5, thus
motivating our mass limits. It is complicated to correct for the wavelength dependence ofnwithin the redshift bins, we do not correct for this effect but note thatn increases by∼10% from 4500 to 8000Å.
2.3. Total SFRs
Total star formation rates are derived from stacking analyses of Spitzer/MIPS 24μm photometry, following the procedure detailed in Whitaker et al. (2014).13 TheSpitzer/MIPS 24μm images in the AEGISfield are provided by the Far-Infrared Deep Extragalactic Legacy (FIDEL) survey (Dickinson & FIDEL Team2007), COSMOS from the S-COSMOS survey (Sanders et al. 2007), GOODS-N and GOODS-S from Dickinson et al.
(2003), and UDS from theSpitzerUKIDSS Ultra Deep Survey14
(SpUDS; PI: J. Dunlop). The analysis code uses a high-resolutionJF125W+HF140W+HF160Wdetection image as a prior to model the contributions from neighboring blended sources in the lower resolution MIPS 24μm image (Labbé et al. 2010). All galaxies are “cleaned” of the contaminating flux of the neighboring sources before stacking. We refer the reader to Section 3 of Whitaker et al. (2014) for the full details of the MIPS 24μm stacking analyses. The SFRs derived for quiescent galaxies herein are upper limits, as the 24μm technique overestimates the SFRs for galaxies with log sSFR <-10
yr−1, but remains robust above this limit(Hayward et al.2014; Utomo et al. 2014). For this reason, identifying star-forming galaxies from 24μm-based sSFRs results in a significant fraction of interloping quiescent galaxies.
3. RESULTS
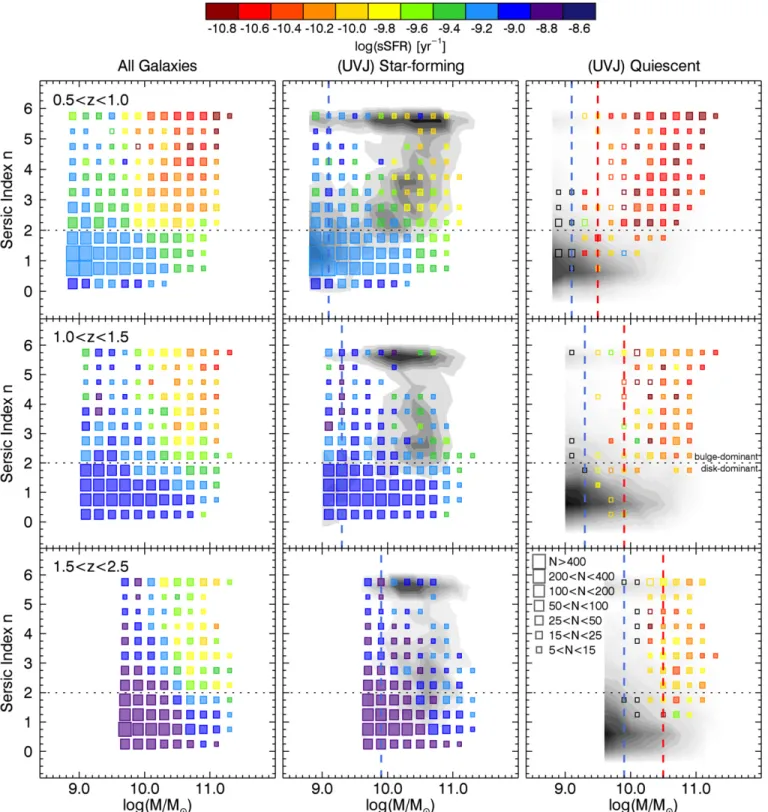
If increasing bulge mass-fractions result in aflattening of the star formation sequence at the massive end (Abramson et al. 2014), we should see a correlation between the n, M, and sSFR. In Figure1, we show the Sérsic indices of galaxies as a function of their stellar mass, color-coded by the UV+IR sSFRs for all galaxies (left), star-forming only (middle), and
12
We no longer requireV-J<1.5, similar to van der Wel et al.(2014), as this is a false upper limit imposed on the quiescent population. This effects
1%
< of galaxies.
13
Stacking is currently the only way to derive SFRs from a single indicator at low stellar masses or SFRs, separating this work from Wuyts et al.(2011b). 14
http://irsa.ipac.caltech.edu/data/SPITZER/SpUDS/
quiescent only(right). Indeed, wefind a decrease in the sSFRs for galaxies with high n atlogM M>10. There does not
appear to be any dependence ofnon the average sSFR for low-mass galaxies withlogM M<10.
Quiescent galaxies with log(M M)>10 tend to have
n>2, consistent with bulge-dominated light profiles. Although this finding is not new, we do show for thefirst time that the
analogous star-forming sub-population with similar n-values also have depressed sSFRs relative to the bulk of the star-forming population. We also see a low-mass quiescent population at 0.5 < z < 1.0 with similar (disk-like) Sérsic indices in Figure1, albeit these galaxies lie close to or below the mass limit. This may suggest that lower-mass galaxies quench their star formation at later times through a more
gradual “slow-track” of gas depletion (see, e.g., Barro et al.2013).
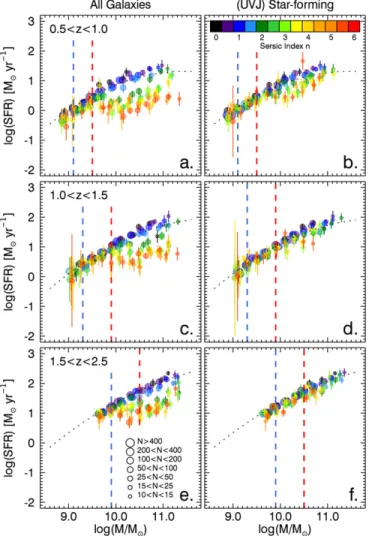
Figure2shows the log SFR–logM projection of Figure1, color-coded by n. At all redshifts, we see a clear correlation between SFR/M and nwhen considering both quiescent and star-forming galaxies (left panels). Although this result is primarily driven by the bulge-dominated, low sSFR quiescent population, we do see a weaker trend for star-forming galaxies only. The more concentrated the light profile of a galaxy( high-n), the more likely that galaxy is to have a depressed sSFR relative to the star formation sequence.
Assuming n is a proxy for bulge-to-disk ratio, we see evidence to support the idea of Abramson et al. (2014): the slope of the star formation sequence is correlated with the build-up of bulges. We note, however, that even galaxies with n =1 exhibit some curvature of the star formation sequence, suggesting an additional mechanism acting to suppress star formation in massive galaxies.
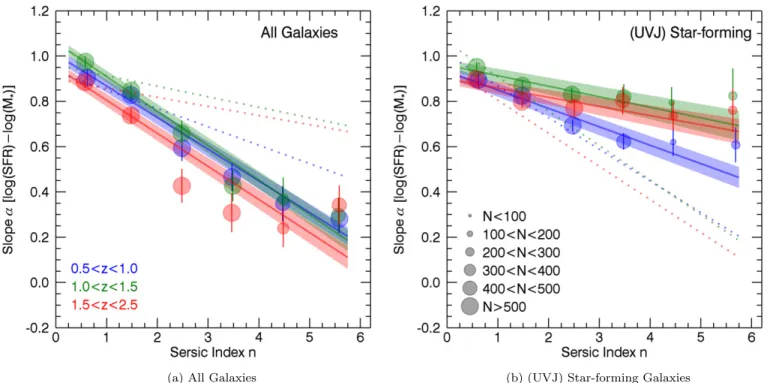
Figure 3 shows the slope of log SFR log– M relation measured above the star-forming mass limits. The error bars include the uncertainty in the slope measurement itself andn,
where the latter is calculated from 100 bootstrap simulations perturbingnby the random errors and repeating the analysis. A summary of the best-fit parameters is found in Table1. We
find similar general trends when selecting star-forming galaxies bylog sSFR( )>−10 yr−1. Whitaker et al. (2012b)
demonstrated that a steeper slope of the star formation sequence is measured when selecting blue star-forming galaxies (e.g., Peng et al. 2010). Here, we show explicitly that by selecting galaxies with prominent disks(which often have blue rest-frame optical colors), we measure a slope close to unity across the full range in stellar mass and redshift. We confirm similar results by Wuyts et al. (2011b), and emphasize the critical importance of understanding selection biases.
4. DISCUSSION
The aim of this Letter is to connect rest-frame optical measurements of the n M– relation with total sSFRs for a single SFR indicator from a purely empirical standpoint. We can thereby connect galaxy structure and star formation to understand the observed bimodal distribution of galaxies across cosmic time. We measure a systematic decrease in the global sSFRs of galaxies with increasingn. Thisflattening of the star formation sequence directly reflects the bimodality of the two stellar populations: quiescent galaxies tend to be bulge-dominated with significantly lower sSFRs, whereas star-forming galaxies are typically disk-dominated with sSFRs consistent with the main ridge of the star formation sequence
(confirming Wuyts et al. 2011b). The measured SFR–M relation for galaxies withn =2 tracks the best-fit relations of Whitaker et al.(2014)in Figure2. Galaxies withn<2 have a slightly steeper (but still curved) relation, whereas galaxies withn>2 show a significantlyflattened relation. We also see that n correlates with the color bimodality of the populations
(Figure4, Panel A).
When considering star-forming galaxies only, pure expo-nential-disk galaxies exhibit a higher slope of the
M
log SFR log– relation than those with a significant bulge component. This result is somewhat dependent on how star-forming is defined: UVJ-selected star-forming galaxies atz<1 withn>2 have rest-frame colors close to the quiescent region
(Panel B, Figure 4). If we shift the quiescent box redward in
V-J by +0.1–0.3 mag and repeat the analysis, we find the same correlation between the slope of the star formation sequence andnatz<1. This is because high-ngalaxies drop out of the sample altogether but variations in the slope from n = 0.5 to n = 3 remain. The galaxies that lie in this intermediate region of rest-frame color space may be an extension of the quiescent population on the verge of shutting down star formation (e.g., Belli et al. 2015, Papovich et al.
2015; M. Yano et al. 2015, in preparation). They have more concentrated light profiles and lower sSFRs than typical star-forming galaxies.
For star-forming galaxies at z > 1, the slope of the star formation sequence instead depends weakly onn(right panel, Figure3). The correlation is not statistically significant above n > 1. Shifting the UVJ selection redward increasingly weakens the trend. Perhaps the larger photometric errors of quiescent galaxies at high-zscatter some into the intermediate parameter space, which get removed by this test. The n >2 star-forming galaxies well separated from the UVJ line show a similar range of colors ton<2 star-forming galaxies(compare
Figure 2.log SFR( )–logM relation of all galaxies(left)and color-selected
star-forming(right)resulting from the stacking analysis across then M– plane
and vertical lines defined in Figure1. Each symbol is color-coded byn; the size of the symbol depends on the number of galaxies in the bin. The error bars are derived from a Monte Carlo bootstrap simulation of the stacking analyses. The average star formation sequence from Whitaker et al.(2014)is shown with dotted lines. Galaxies with significant bulges(n>2)exhibit a shallower slope for the star formation-stellar mass relation.
Panels D and G, Figure4). They may also have similar sSFRs, although n >3 star-forming galaxies are not prevalent at the highest masses. Disk-dominated star-forming galaxies are neither preferentially dusty or dust-free; their range in colors in Figure 4 likely reflects the inclination angle through which we view the disk(Patel et al.2012). The process of forming a significantly massive bulge atz>1 appears to be connected to a transformation in the rest-frame optical galaxy structure and color before the decrease of the global sSFR of galaxies. Panel D in Figure 4 demonstrates that the galaxy morphology is in place at z ∼2 before the reddening of the rest-frame colors associated with passive evolution.
The observation that the correlation between the slope of the star formation sequence and n is weaker among star-forming galaxies atz>1 may tell us something about bulge formation. Traditional bulges may already be in place at z < 1. For example, van Dokkum et al. (2014) find little growth in the centers of massive galaxies below z < 0.8, but at higher redshifts there is growth at all radii. Furthermore, Nelson et al.
(2012)demonstrate that(new)star formation atz∼1 occurs at all radii in exponential disks. In other words, bulges at z1
may already be composed of older stars.
The picture is less clear at higher redshifts; it may be that massive galaxies are actively building up their bulges. From Figures 1–3, we see that bulge-dominated galaxies at high-z exist, but do not seem to have a significantly lower global sSFR. If the bulges of massivez∼2 galaxies are actively forming, the stars will still be young and there should not yet be a strong depression in global sSFRs. Choi et al. (2014) derived stellar ages for a large sample of quiescent galaxies at 0.1<z<0.7 that are consistent with an equivalent single-burst star formation epoch ofz~1.5, supporting the idea thatz∼2 is an important epoch for the bulge formation for massive galaxies. This does not however tell us anything about how bulges grow. We cannot tell if clumps of stars form insitu and migrate to the bulge due to disk instabilities(e.g., Noguchi1999; Elmegreen et al.2008), if they are the result of a rich merger history (e.g., De Lucia et al.2011), or some other mechanism.
The best way to decompose the star formation histories of z∼2 galaxies will be with future spatially resolved studies. For example, Nelson et al. (2015) find that the radial Hα profiles of galaxies above the ridge of the star formation sequence are enhanced at all radii, whereas galaxies below have suppressed star formation at all radii. Their results suggests that a global process regulates gas accretion, and the scatter in the star formation sequence is real. It is however unclear why the amount of gas accretion depends on disk mass instead of total mass. In this work, we demonstrate that this scatter may be related in part ton. In Figure2, the scatter of the SFRs between 10<log(M M)<11 for all galaxies
ranges from 0.34 ± 0.09 dex at 1.5 < z < 2.5, to 0.43 ± 0.05 dex at 1.0 < z < 1.5, and 0.48 ± 0.02 dex at 0.5<z<1.0. When considering UVJ-selected star-forming
Figure 3.Best-fit linear slopeαof thelog SFR log– M relation above the star-forming mass limits depends strongly onnwhen both star-forming and quiescent
galaxies are considered. This trend is weaker for star-forming galaxies only, and may signify active bulge-formation among the most massive galaxies atz∼2, where the stars in the central concentration are younger. The symbol size represents the number of galaxiesN. Dotted lines are the best-fit relation from the opposite panel for reference.
Table 1
Linear Fits to the Slopeαof thelog SFR log– MRelation vs. Sérsic index
All Galaxies (UVJ)Star-forming
Redshift Range a b a b
z
0.5< <1.0 1.01
±0.03
0.14 0.01
- 0.93
±0.03
0.08 0.01
-
z
1.0< <1.5 1.06
±0.03
0.15 0.01
- 0.96
±0.03
0.05 0.02
-
z
2.5< <2.5 0.95
±0.03
0.15 0.01
- 0.90
±0.03
0.04 0.01
-
Note.Linearfit coefficients parameterizing the evolution of the slope,α, of the
M
galaxies only, these values are 0.14 ± 0.02 dex at 1.5 <z <2.5, 0.21±0.05 dex at 1.0 <z <1.5, and 0.30 ± 0.04 dex at 0.5 < z < 1.0. Compared to the roughly constant 0.34 dex observed scatter of the star formation sequence(Whitaker et al.2012b), we show that this scatter is driven in part by real differences in n. Random errors will introduce ∼0.05 dex scatter, and evolution of the average SFR within the redshift bins ∼0.11–0.14 dex (Whitaker et al. 2012b). It may be that a significant portion of the remaining scatter is correlated with variations in n among galaxies. However, we are unable to decompose the relative contributions of intrinsic and systematic scatter at present, and note that the 24μm–LIR conversion itself could
introduce as much 0.25 dex of scatter (Wuyts et al.2011a). These results support the idea that we are witnessing the rapid build-up of bulges at z~2 in massive galaxies. A prominent bulge may be an important condition for quenching to occur (e.g., Bell et al.2012), at least in massive galaxies. Franx et al. (2008) demonstrated that surface density and inferred velocity dispersion are better correlated with sSFR and color than stellar mass. We will explore these dependencies in an upcoming paper (K. Whitaker et al. 2015, in preparation).
We thank the anonymous referee for a highly constructive report. This work is based on observations taken by the 3D-HST Treasury Program (GO 12177 and 12328) with the NASA/ESA HST, which is operated by the Associations of Universities for Resarch in Astronomy, Inc., under NASA contract NAS5-26555. This research was supported in part by an appointment to the NASA Postdoctoral Program at the Goddard Space Flight Center, administered by Oak Ridge Associated Universities through a contract with NASA and by NASA through Hubble Fellowship grant HST-HF2-51368 awarded by the Space Telescope Science Institute, which is operated by the Association of Universities for Research in Astronomy, Inc., for NASA, under contract NAS5-26555.
REFERENCES
Abramson, L. E., Kelson, D. D., Dressler, A., et al. 2014,ApJL,785, L36 Barro, G., Faber, S. M., Pérez-González, P. G., et al. 2013,ApJ,765, 104 Bell, E. F., van der Wel, A., Papovich, C., et al. 2012,ApJ,753, 167 Belli, S., Newman, A. B., & Ellis, R. S. 2015,ApJ,799, 206
Brammer, G. B., van Dokkum, P. G., Franx, M., et al. 2012,ApJS,200, 13 Brinchmann, J., Charlot, S., White, S. D. M., et al. 2004, MNRAS,
351, 1151
Bruce, V. A., Dunlop, J. S., McLure, R. J., et al. 2014,MNRAS,444, 1660 Caon, N., Capaccioli, M., & D’Onofrio, M. 1993,MNRAS,265, 1013 Chabrier, G. 2003,PASP,115, 763
Choi, J., Conroy, C., Moustakas, J., et al. 2014,ApJ,792, 95
De Lucia, G., Fontanot, F., Wilman, D., et al. 2011,MNRAS,414, 1439 de Vaucouleurs, G. 1948, AnAp,11, 247
Dickinson, M., & FIDEL Team 2007, BAAS,39, 822
Dickinson, M., Papovich, C., Ferguson, H. C., et al. 2003,ApJ,587, 25 Donley, J. L., Koekemoer, A. M., Brusa, M., et al. 2012,ApJ,748, 142 Elmegreen, B. G., Bournaud, F., & Elmegreen, D. M. 2008,ApJ,688, 67 Franx, M., van Dokkum, P. G., Schreiber, N. M. F., et al. 2008, ApJ,
688, 770
Grogin, N. A., Kocevski, D. D., Faber, S. M., et al. 2011,ApJS,197, 35 Hayward, C. C., Lanz, L., Ashby, M. L. N., et al. 2014, MNRAS,
445, 1598
Kennicutt, R. C., Jr. 1998,ARA&A,36, 189
Koekemoer, A. M., Faber, S. M., Ferguson, H. C., et al. 2011,ApJS,197, 36 Kriek, M., van Dokkum, P. G., Franx, M., et al. 2009,ApJL,705, L71 Labbé, I., González, V., Bouwens, R. J., et al. 2010,ApJL,708, L26 Lang, P., Wuyts, S., Somerville, R. S., et al. 2014,ApJ,788, 11
Nelson, E. J., van Dokkum, P. G., Brammer, G., et al. 2012, ApJL, 747, L28
Nelson, E. J., van Dokkum, P. G., Förster Schreiber, N. M., et al. 2015, ApJ, submitted(arXiv:1507.03999)
Noeske, K. G., Weiner, B. J., Faber, S. M., et al. 2007,ApJL,660, L43 Noguchi, M. 1999,ApJ,514, 77
Papovich, C., Labbé, I., Quadri, R., et al. 2015,ApJ,803, 26 Patel, S. G., Holden, B. P., Kelson, D. D., et al. 2012,ApJL,748, L27 Peng, Y.-j., Lilly, S. J., Kovač, K., et al. 2010,ApJ,721, 193 Sanders, D. B., Salvato, M., Aussel, H., et al. 2007,ApJS,172, 86 Schreiber, C., Pannella, M., Elbaz, D., et al. 2015,A&A,575, A74 Sérsic, J. L. 1968, Atlas de Galaxias Australes (Córdoba, Argentina:
Observatorio Astronómico)
Skelton, R. E., Whitaker, K. E., Momcheva, I. G., et al. 2014,ApJS,214, 24 Tal, T., Dekel, A., Oesch, P., et al. 2014,ApJ,789, 164
Utomo, D., Kriek, M., Labbé, I., et al. 2014,ApJL,783, L30
Figure 4.Rest-frameU-V andV-Jcolors also reflect a bimodality in the Sérsic index(panel(a)), with bulge-dominated galaxies predominatly inhabiting the quiescent region and disk-dominated galaxies in the star-forming region. There do not exist strong trends within the quiescent and star-forming populations. The notable exception is the cross-over region between these two populations, where galaxies tend to be bulge-dominated, matching the quiescent population, while still residing in the star-forming color–color parameter space atz<1(panel(b)). Conversely, atz>1.5, star-forming galaxies with high Sérsic indices cover the full color– color parameter space(panel(d)).
van der Wel, A., Bell, E. F., Häussler, B., et al. 2012,ApJS,203, 24 van der Wel, A., Franx, M., van Dokkum, P. G., et al. 2014,ApJ,788, 28 van Dokkum, P. G., Bezanson, R., van der Wel, A., et al. 2014,ApJ,791, 45 Whitaker, K. E., Franx, M., Leja, J., et al. 2014,ApJ,795, 104
Whitaker, K. E., Kriek, M., van Dokkum, P. G., et al. 2012a,ApJ,745, 179
Whitaker, K. E., van Dokkum, P. G., Brammer, G., et al. 2012b, ApJL, 754, L29